
Ichimoku Cloud Explained: Tenkan, Kijun, Kumo and Forex Trend Analysis
PipSePaisa • Forex Education & Research
INTRODUCTION
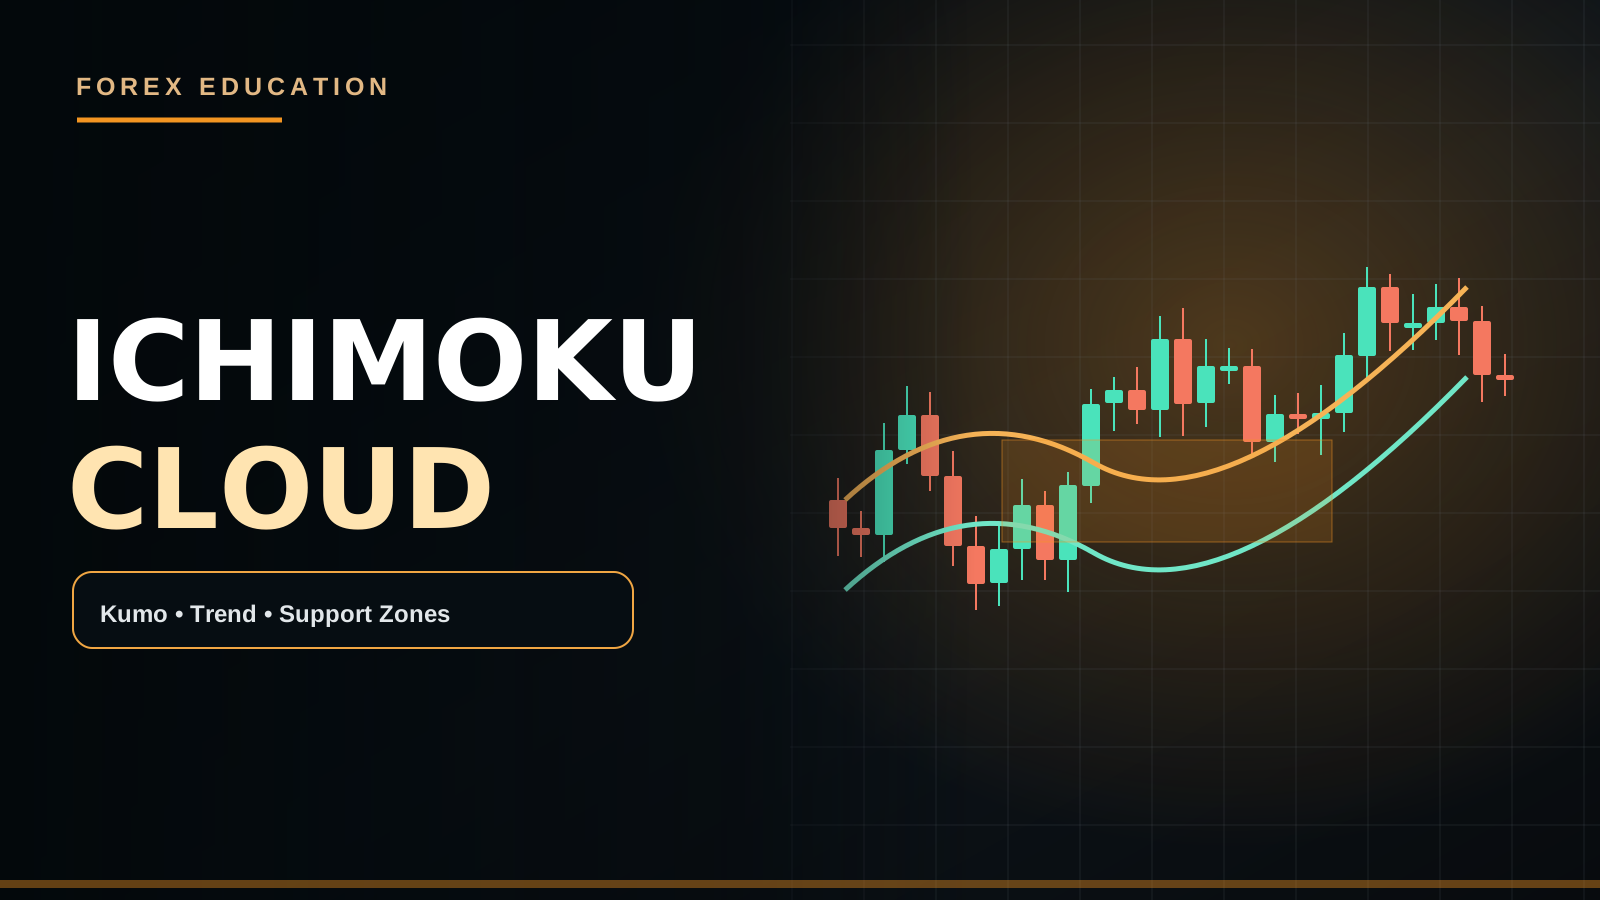
Ichimoku combines several calculations based on recent high-low midpoints, including Tenkan-sen, Kijun-sen, Senkou spans and Chikou span. The Kumo Cloud is plotted forward as a visual context tool, not a future-price prediction.
PRACTICAL MARKET EXAMPLE
Price above a rising H1 cloud can align with bullish context while H4 structure remains bearish. Tenkan/Kijun cross inside a wide Kumo may carry a different context from a cross well above it.
IMPORTANT LIMITATIONS
Cloud thickness and displaced spans do not prove institutional orders or a fixed support wall.
THE FIVE ICHIMOKU COMPONENTS
Ichimoku Kinko Hyo is a multi-component price-analysis system often translated as 'one glance equilibrium chart.' It includes Tenkan-sen, Kijun-sen, Senkou Span A, Senkou Span B and Chikou Span. A complete interpretation considers the position of price relative to the cloud, the slope of lines, possible crosses and the background market structure. None of the components are a direct inventory of institutional pending orders. The cloud can visually summarize trend context but does not ensure a specific future candle result.
TENKAN-SEN AND KIJUN-SEN
Tenkan-sen is commonly the midpoint of the highest high and lowest low over the previous nine periods. Kijun-sen uses a similar midpoint over twenty-six periods. These are range midpoints, not moving averages of closing prices in the conventional SMA sense. Tenkan can react more quickly because the lookback is shorter. A Tenkan cross above Kijun may signal improving shorter-term price position, but its reliability depends on whether the broader trend and major Supply/Demand support that interpretation.
SENKOU SPAN A
Senkou Span A is typically the midpoint of Tenkan and Kijun plotted forward by twenty-six periods. This forward displacement is a visual convention that draws the calculated average ahead of current time. It does not mean the algorithm has access to future market prices or knows where trading will occur. Traders sometimes interpret the span as part of a future cloud boundary, but actual price can cross it without respecting the line. If settings change, line placement and chart labels change too.
SENKOU SPAN B
Senkou Span B commonly uses the midpoint of the highest high and lowest low over fifty-two periods and is displayed forward by twenty-six. Together, Span A and Span B create the Kumo. A relatively thick cloud indicates separation between the two calculated boundaries. That thickness can suggest a broad modeled area rather than a precise entry price; it cannot prove which institutions have orders there. In sideways markets the cloud may twist and multiple lines overlap, increasing interpretive ambiguity.
CHIKOU SPAN
Chikou Span usually represents the current closing price plotted backward by twenty-six periods. It allows visual comparison of today's price level with the historical chart at an earlier time. This offset must not be mistaken for a backtested trade that could have been entered in the past with future information. When reviewing historical screenshots, ensure the position of the Chikou line is interpreted as a plotting convention, not as independently observable predictive information.
PRICE ABOVE, BELOW OR INSIDE KUMO
Price above the current cloud is commonly described as a bullish environment, while price below can signal bearish context. Price inside the cloud often reflects less directional clarity under the Ichimoku framework. Yet an H1 bullish cloud can coexist with H4 bearish structure: the lower timeframe may simply be rallying as part of a larger correction. Use the cloud with swing structure and historical horizontal levels instead of forcing every above-cloud candle into a Buy.
TENKAN/KIJUN CROSSES
A Tenkan cross above Kijun is often labeled bullish; a cross below is bearish. Some Ichimoku schools rank signals based on whether the cross occurs above, within or below the cloud. A bullish crossover above a supportive Kumo may offer different context from one beneath a bearish cloud. But even a visually strong cross can appear after a large move when nearby resistance limits reward. A crossover is a condition to assess, not an entry order in isolation.
A BULLISH EUR/USD EXAMPLE
Suppose EUR/USD H4 produces higher highs and higher lows. H1 price trades above a rising Kumo but pulls back toward an H1 Demand Zone. Tenkan briefly moves below Kijun, then price shows completed bullish rejection and M5 breaks a local lower high. A trader may evaluate continuation once the price-action trigger is complete, while using the significant H1 rejection low for invalidation. The cloud provides background, not a justification for hiding a wider-than-budget Stop Loss.
A BEARISH GBP/USD EXAMPLE
GBP/USD H4 is bearish and an H1 rally approaches previous Supply while price remains below the cloud. Tenkan turns down beneath Kijun and an M5 candle closes below local Support. That may fit a bearish trend-continuation thesis. But if the Bank of England unexpectedly signals a more restrictive interest-rate path, GBP could break above the cloud and invalidate the technical scenario. Economic developments matter more than treating the plotted spans as walls.
KUMO TWISTS AND FALSE SIGNALS
When Span A crosses Span B, the cloud color may change or twist. This reflects changing relationships between range-midpoint calculations; it is not a guaranteed future trend reversal. In a range, repeated cloud twists and Tenkan/Kijun crosses may produce conflicting signals. Look for real progress in H1 swing highs/lows and sufficient movement away from consolidation. A single cloud color change is weak evidence unless the system's other conditions support it.
CLOUD THICKNESS AND STOPS
Some traders set Stop Loss beyond a cloud boundary. That is only appropriate if the boundary reflects meaningful invalidation under a tested method. A cloud can be very wide, making the required stop larger than the account's risk budget, or unusually thin, placing it within normal market noise. Do not alter Lot Size after seeing a cloud label without checking actual price distance, contract value and spread. Price structure is often a clearer stop reference.
TIMEFRAME CHOICE
Ichimoku nine, twenty-six and fifty-two settings represent numbers of bars, not fixed clock durations. On M5, twenty-six bars cover a different period from twenty-six H4 bars. A forward-plotted cloud on a five-minute chart therefore cannot automatically determine a multi-day market outlook. Choose H4 for broad context, H1 for levels and M5/M15 for completion triggers if that is the tested hierarchy. Multiple Ichimoku charts may disagree without either being inherently wrong.
FUTURE CLOUD IS NOT FUTURE KNOWLEDGE
A major beginner mistake is seeing a colored cloud projected to the right and believing the indicator already predicts next week's exact Support and Resistance. The forward cloud is computed using prices already observed; its plotting position is shifted to aid visual comparison. Future actual price may trade above, below or directly through it. Price shocks from CPI/NFP, ECB or Fed policy can change what happens when that period arrives. Interpret projection conventions honestly.
ICHIMOKU AND NEWS
A major economic announcement may create displacement through Tenkan, Kijun and the entire Kumo. Spreads can widen and stop-market orders may experience slippage. Waiting for a completed H1/M15 close or stable M5 structure might filter some uncertainty, but it does not guarantee that a new trend will persist. Check whether the announced data changes real rates, USD/GBP/EUR expectations and nearby market structure. A cloud cannot override macroeconomic repricing.
A TESTABLE ICHIMOKU SYSTEM
Document settings, chart timeframe, condition for price above/below Kumo, Tenkan/Kijun cross requirement, Chikou confirmation rules if used, structural Stop Loss, news filter and target strategy. Compare results of cloud-context plus M5 price confirmation with a simpler H4 trend/H1 zone framework. Measure real net P&L after costs, not only screenshot appearance. Evaluate ranges separately because the cloud can generate ambiguous flips in choppy markets.
FREQUENTLY ASKED QUESTIONS
Is Ichimoku a collection of moving averages? It is a multi-line framework based largely on high-low midpoints rather than standard close-price SMAs. Does a cloud shown ahead predict future price? No. Can H1 bullish cloud coexist with H4 downtrend? Yes. Does a Tenkan/Kijun cross guarantee profit? No. Can price break through a thick Kumo? Yes. Should a trade without its required M5 confirmation be skipped? Yes.
A NUMERICAL TENKAN AND KIJUN EXAMPLE
Suppose the highest high over the last nine completed H1 candles is 1.1100 and the lowest low is 1.1040. Tenkan-sen equals their midpoint, 1.1070. If the highest high over the selected twenty-six-period Kijun window is 1.1120 and the lowest low is 1.1000, Kijun-sen equals 1.1060. Tenkan is therefore above Kijun, but that alone does not mean a bullish trade is attractive. If H4 Supply starts at 1.1080, a Buy might have very little room to the next major selling area.
CLOUD RECLAIM VERSUS A TEMPORARY BREAK
A close above the H1 Kumo followed by another candle returning inside it may be an unsuccessful breakout. A sustained series of H1 higher lows and candles holding above the cloud suggests more persistent acceptance, but the pattern still needs risk assessment. Some traders wait for the cloud boundary to be retested while others require Tenkan/Kijun and Chikou alignment. Both approaches must be written before reviewing charts. Switching confirmation rules to fit the trade you want creates an inconsistent record.
AN ICHIMOKU PRACTICE PLAN
Choose one liquid currency pair, use the default Ichimoku settings, and save twenty consecutive H1 observations with H4 context. Note where price was relative to the Kumo, whether the cloud was twisting, and how Tenkan/Kijun behaved. Separately log whether a genuine M5 entry trigger completed at a meaningful H1 level. When a trade stops out, ask whether the setup followed its rules rather than calling the cloud broken. Measure actual net risk multiples after spread and commission. Chart descriptions become educationally valuable only when tested against outcomes.
PIPSEPAISA FREE COURSES
For structured technical analysis education, explore the Free Forex Technical Analysis Course with Sir Sajid Khan Ghori. To understand the economic context behind Forex and Gold, explore the Free Forex Fundamental Analysis Course with Sir Ghulam Abbas. Visit www.pipsepaisa.com and select Courses for enrollment instructions. Courses and trading content cannot guarantee profit.
RISK DISCLAIMER
This is for education only. No indicator, chart pattern or economic release guarantees a trading outcome. Always calculate potential account loss, consider spreads and slippage, and wait for completed confirmation before trading.
Read in Roman Urdu
INTRODUCTION
Ichimoku mein Tenkan, Kijun, Senkou Spans aur Chikou Span recent High/Low Midpoints se derive hote hain. Kumo Cloud forward plot hoti hai, magar future price ka guaranteed forecast nahi.
PRACTICAL EXAMPLE
H1 Price Kumo ke upar bullish context de sakti hai magar H4 bearish ho. Wide Cloud ke andar Tenkan/Kijun Cross aur Cloud ke bahar Cross same trade quality nahi.
LIMITATIONS
Kumo Thickness actual hidden bank order inventory ka proof nahi, aur Cloud permanent Support Wall nahi.
ICHIMOKU KE FIVE MAIN COMPONENTS
Ichimoku Kinko Hyo ek Multi-Line Technical Analysis System hai jiska meaning roughly one-glance equilibrium chart kaha ja sakta hai. Is mein Tenkan-sen, Kijun-sen, Senkou Span A, Senkou Span B aur Chikou Span hain. Complete Analysis mein Price ka Cloud se relation, Lines ki Slopes, Crossovers aur H1/H4 Market Structure dekhi jati hai. Koi Line direct Bank Pending Orders ka map nahi. Cloud Trend Context visually summarize kar sakti hai, future Candle Guarantee nahi.
TENKAN-SEN AUR KIJUN-SEN
Tenkan-sen commonly previous 9 Bars ke Highest High aur Lowest Low ka midpoint calculate karti hai. Kijun-sen similar calculation 26 Bars par karti hai. Ye Closing Prices ki normal SMA nahi, High-Low Range Midpoints hain. Tenkan short lookback ki wajah se faster respond kar sakti hai. Tenkan Kijun ke upar cross kare to possible Bullish Price Position Shift ho sakti hai. Lekin H4 Supply, Trend aur actual Candle Confirmation ke baghair guaranteed Buy nahi.
SENKOU SPAN A
Senkou Span A usually Tenkan aur Kijun ka Midpoint hoti hai aur 26 Bars forward plot hoti hai. Forward Draw hone ka matlab Algorithm Future Market Data dekh sakta hai, ye bilkul nahi. Indicator current/past calculated Value ko Chart par right side shift karta hai. Kuch traders ise Future Cloud Boundary interpret karte hain, lekin Actual Price line ko break bhi kar sakti hai. Settings change hon to Cloud Placement aur Labels bhi different honge.
SENKOU SPAN B
Senkou Span B common method mein previous 52 Bars ke Highest High aur Lowest Low ka Midpoint hoti hai, jo 26 Bars forward plot hoti hai. Span A aur Span B ke darmiyan Kumo Cloud banti hai. Thick Cloud dono calculated boundaries ki large separation show kar sakti hai. Lekin Thick Cloud institutional Limit Orders ka confirmed evidence nahi. Sideways Market mein Cloud Twist aur Lines overlap ho sakti hain, interpretation confusing ban sakti hai.
CHIKOU SPAN
Chikou Span commonly Current Closing Price ko 26 Bars backward plot karti hai. Is se Trader aaj ka Price Level past chart structure ke relation mein visually compare kar sakta hai. Lekin backwards plotting ko historical trade mein Future Information available thi, aisa assume nahi karna. Backtesting mein ye important hai ke Chikou Indicator Display aur original Candle-Time Information alag samjhein. Colored line ka past area mein nazar aana predictive magic nahi.
PRICE ABOVE / BELOW / INSIDE KUMO
Price Kumo ke upar ho to Ichimoku Framework mein commonly Bullish Context consider, neeche Bearish Context aur andar uncertain direction. Lekin H1 Bullish Cloud H4 Bearish Trend ke andar normal Pullback Rally bhi show kar sakti hai. H1 Price above Cloud se H4 Structure automatically Bullish nahi ho jati. Confirmed H4 Swings aur important H1 Supply/Demand areas samjhein. Har Cloud Position par Market Order lena professional strategy nahi.
TENKAN/KIJUN CROSS
Tenkan Kijun ke upar jaye to Bullish Cross aur neeche aaye to Bearish Cross kaha jata hai. Kuch Ichimoku Schools Cloud ke above, inside ya below Cross ko different priority deti hain. Lekin even favorable Crossover huge rally ke baad Late Entry de sakta hai. Nearest Opposing Supply ya Demand se Profit Target room check karein. Crossover Entry Condition ka ek part hai, complete SL/TP aur Risk Management System nahi.
EUR/USD BUY EXAMPLE
Maan lein EUR/USD H4 Higher High/Higher Low banati hai. H1 Price Rising Kumo ke upar hai aur Price previous H1 Demand tak Pullback karti hai. Tenkan Kijun Cross temporary change ho, phir M5 par Bullish Engulfing local Lower High ke upar complete close deti hai. Possible Trend Continuation Buy evaluate ho sakti hai. SL H1/M5 meaningful rejection Low ke beyond, Lot Money Risk se calculate. Cloud Bullish hone ka matlab Stop Remove karna valid nahi.
GBP/USD SELL EXAMPLE
GBP/USD H4 Downtrend mein hai. H1 Rally purane Supply Zone ke qareeb aaye jab Price Cloud ke neeche hai. Tenkan Kijun se below shift kare aur M5 Bearish Candle Local Support ke neeche Close ho. Ye conditional Sell Continuation Setup ho sakta hai. Lekin Bank of England unexpected Hawkish Guidance de to GBP rapidly strong ho kar Kumo ke upar bhi break kar sakti hai. Economic News se Technical Scenario invalidate possible hai.
KUMO TWIST AUR FALSE SIGNALS
Span A, Span B cross karein to Cloud Color Twist ho sakti hai. Iska matlab High/Low Midpoint Calculations ka relation change hua. Ye guaranteed Future Downtrend ya Uptrend signal nahi. Sideways Market mein repeated Twists aur Tenkan/Kijun Crosses False Signals produce kar sakti hain. H1 Actual Swing Break, Support/Resistance aur Follow-Through dekhein. Sirf Cloud Green/Red Change ko live Buy/Sell Recommendation samajhna risk hai.
CLOUD THICKNESS AUR STOP LOSS
Kuch Strategies SL Cloud Boundary ke beyond rakhti hain. Lekin ye tabhi sensible jab Boundary actual Price Invalidation ke relation mein meaningful ho. Cloud bohat thick ho to Stop Wide aur Account Risk large ban sakta hai. Cloud thin ho to Stop normal candle Noise ke andar ho sakta hai. Lot Size Broker Contract Value, Pip Distance aur Equity Risk se calculate karein. H1 Meaningful Swing Levels common alternative invalidation references ho sakte hain.
TIMEFRAME CHOICE
Ichimoku 9, 26 aur 52 Bars ke numbers hain, fixed hours nahi. M5 par 26 Bars 130 Minutes ka lookback hai, jabke H4 par 26 Bars many days cover karti hain. M5 Cloud ko automatically long-term Macro Forecast na samjhein. H4 Broad Bias, H1 Zone, M15 Setup aur M5 Completed Trigger jaisi hierarchy define karein. Charts different direction show kar sakti hain because timescales different hain. Ye normal analytical difference hai.
FUTURE CLOUD ACTUAL FUTURE DATA NAHI
Beginners kabhi Chart ke right side Future Kumo ko dekh kar samajhte hain Market aglay week wahan guaranteed reverse karegi. Lekin Forward Cloud already observed High/Low Prices se calculate hui hoti hai aur plotting right-shifted hoti hai. Actual Future Market Price Cloud ke upar, neeche ya seedha uske through move kar sakti hai. CPI/NFP aur Fed Policy surprises existing calculations ko future outcome predict karne se nahi bacha sakte.
NEWS AUR ICHIMOKU
High Impact Economic Event price ko Tenkan, Kijun aur Complete Cloud ke through fast move kara sakta hai. Wide Spreads aur Stop Slippage risk hota hai. Kuch traders M15/H1 Completed Close aur M5 Stable Structure ka wait karte hain. Lekin ye approach guaranteed Trend Continuation nahi. News Report ki Actual vs Forecast Interpretation, USD Yields aur H1/H4 Structure important hain. Technical Indicator independent macroeconomic predictor nahi.
ICHIMOKU BACKTEST
Chosen Settings, Timeframe, Kumo Position, Tenkan/Kijun Cross, Chikou Conditions agar use karte hain, M5 Candle Close, SL, TP aur News Filter likhein. Consistent historical rules se Net P/L, Average R aur Drawdown measure karein. Cloud-Only Entry aur H1 Zone + Confirmation Method separately compare karein. Ranging Market mein extra false crosses include karein. Sirf perfect screenshots trading edge prove nahi karte.
ICHIMOKU FAQ
Ichimoku normal SMAs? Nahi, mostly High/Low Midpoint Calculations. Future Cloud future market predict? Nahi. H1 Bullish aur H4 Downtrend simultaneously? Haan. Tenkan/Kijun Cross guaranteed profit? Nahi. Price Thick Cloud break kar sakti? Haan. M5 Confirmation missing ho to trade? No Confirmation = No Trade.
TENKAN AUR KIJUN NUMERICAL CALCULATION
Maan lein last 9 Completed H1 Candles ka Highest High 1.1100 aur Lowest Low 1.1040 hai. Tenkan-sen inka Midpoint = (1.1100 + 1.1040)/2 = 1.1070. Last 26 H1 Bars mein Highest High 1.1120 aur Lowest Low 1.1000 ho to Kijun-sen = 1.1060. Tenkan Kijun se upar hai, magar guaranteed Buy nahi. Agar H4 Supply 1.1080 par start ho rahi hai to Entry 1.1070 ke qareeb se Target Space bohat limited ho sakti hai. Indicator Cross Trading Economics nahi batata.
CLOUD RECLAIM VS FALSE BREAKOUT
Price H1 Kumo ke upar Close de, magar next Candle wapas Cloud ke andar aa jaye to temporary Breakout ho sakti hai. Agar multiple H1 Candles Cloud ke upar hold kar ke Higher Lows banayein to bullish acceptance ka context stronger ho sakta hai. Lekin Trend continuation guaranteed nahi. Kuch Strategies Kumo Retest ke baad Buy, kuch Tenkan/Kijun aur Chikou Alignment require karti hain. In rules ko Historical Outcomes dekhne se pehle decide karein. Winning charts mein flexible Rule aur Losing mein strict Rule use karna biased data hai.
ICHIMOKU PRACTICE WORKSHEET
Ek major Forex Pair select karein. Default Settings par H1 Chart ke 20 consecutive meaningful observations save karein. Har screenshot mein H4 Direction, Kumo Position, Tenkan/Kijun Cross, Cloud Twist aur M5 Completed Entry Confirmation record karein. Jo Trade hit hui uska Structural Stop aur Net R Result bhi include karein. Kumo Fail hone par sirf Indicator ko blame na karein; dekhein SL Zone invalid thi, News Surprise hua ya Entry late thi. Trading Costs aur Slippage ko honest record mein add karein.
PIPSEPAISA FREE COURSES
Sir Sajid Khan Ghori ke Free Forex Technical Analysis Course mein Price Action, Market Structure aur Confirmation seekhein. Sir Ghulam Abbas ke Free Forex Fundamental Analysis Course mein Gold aur Forex ke Economic Data ka concept samjhein. www.pipsepaisa.com par Courses Tab se Enrollment Instructions check karein. Course Profit ki guarantee nahi.
DISCLAIMER
Ye sirf educational content hai. Koi Indicator, Pattern ya News guaranteed signal nahi. Structural Stop Loss, Account Risk, Spread aur Completed M5 Confirmation ka wait karein. No Confirmation = No Trade.
Educational content only. Trading involves risk. Always use independent analysis and appropriate risk management.