
Linear Regression Channels Explained: Trend Lines, Standard Deviation Bands, Forex Entries and Risk
PipSePaisa • Forex Education & Research
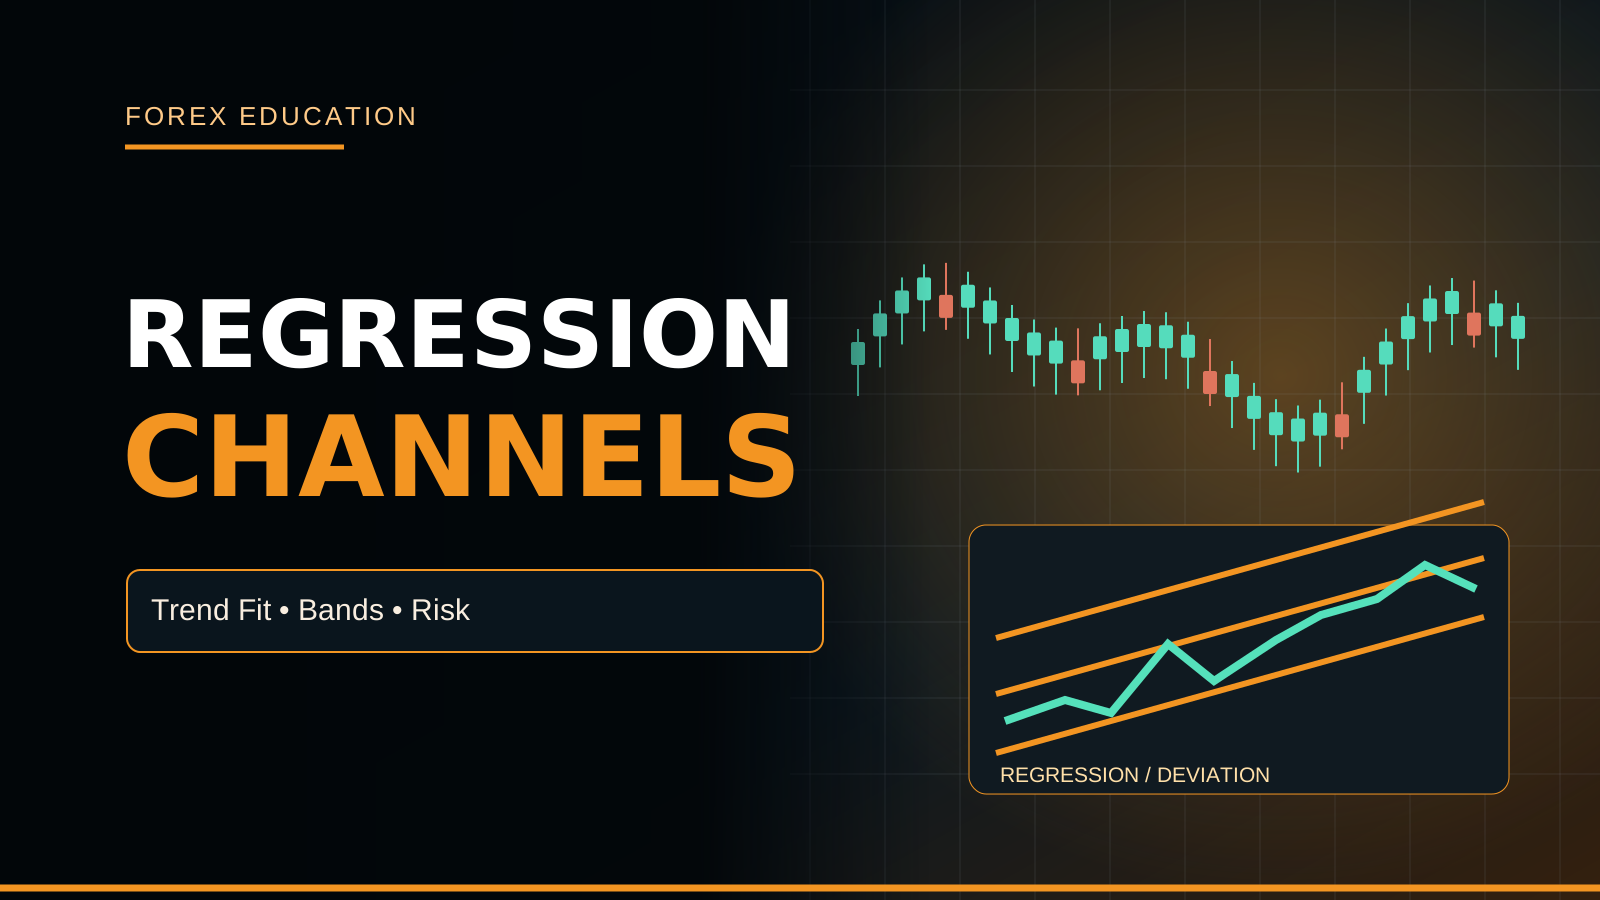
WHAT A LINEAR REGRESSION CHANNEL SHOWS
A linear regression channel fits a straight statistical trend line to a selected sequence of prices and displays upper and lower boundaries around that fit. Traders use the visualization to describe trend direction, how widely prices fluctuate around the fitted path and whether the latest market price appears relatively stretched. A regression channel is not an exchange order book and does not identify guaranteed bank support or resistance. Its output depends strongly on the selected start and end bars. Two analysts choosing different periods can draw visibly different channels from the same chart.
REGRESSION LINE VERSUS ORDINARY TRENDLINE
A manually drawn trendline often connects selected swing highs or lows according to a trader's judgment. A linear regression line instead uses a mathematical best-fit method across the selected observations. The regression line may pass through the middle of price action instead of connecting visible lows. Neither method is inherently a guarantee of profitable entries. Regression reduces some subjective anchoring but introduces sensitivity to the chosen sample. Manual market structure remains important to decide whether a calculated channel boundary aligns with meaningful H1 Supply or Demand.
WHAT LEAST SQUARES MEANS
A common regression method chooses the slope and intercept that minimize the sum of squared vertical residuals between observed prices and the fitted line. If price is represented on the vertical axis and bar index on the horizontal axis, the resulting straight line summarizes the linear relationship over the selected sample. Squaring residuals gives relatively large deviations more weight. The fit describes historical data; it does not force future candles to return to the line. Different input prices such as Close or Typical Price can change the outcome.
THE REGRESSION LINE EQUATION
The basic fitted line can be written as predicted price y = a + b × x, where a is an intercept and b is slope per bar under the selected coordinate system. Positive b implies the historical fit rose across that window; negative b implies it declined. Its numerical magnitude depends on instrument quote units and bar duration. A slope of one unit per H1 bar on Gold is not comparable directly with a slope of 0.0001 per M5 bar on EUR/USD. Normalize and label units when making comparisons.
WHAT THE MIDDLE LINE REPRESENTS
The centerline is the regression's fitted value through the chosen data sample. Some traders treat it as a visual balance reference, but it is not the same as Volume Profile Point of Control, VWAP or an executed weighted-average market price. A return toward the centerline may occur in ranges, yet strong directional moves can remain far from it. Opening a countertrend trade simply because price is above the midpoint can lead to substantial losses. Any mean-reversion hypothesis should be defined and tested separately from a breakout approach.
HOW CHANNEL BOUNDARIES ARE PLACED
Many regression channel implementations draw parallel bands above and below the centerline using a multiple of residual standard deviation or other specified distance. Standard deviation describes dispersion of historical price residuals under an implementation's measurement conventions. Some drawing tools allow fixed-width bands or maximum-deviation endpoints instead. These are not mathematically identical. A label saying 'Regression Channel' does not establish one universal formula. Before reproducing a TradingView line in MT5, inspect whether the tool uses close-only data, high/low extremes and what deviation calculation it applies.
A SIMPLE DEVIATION EXAMPLE
Imagine the regression line at a particular bar predicts a hypothetical price of one hundred and the chosen channel-width estimate is five price units. With a multiplier of two, a simplified symmetric channel shows an upper boundary at one hundred and ten and lower boundary at ninety. These numbers are educational examples rather than a live Forex quote. If volatility increases, the residual dispersion may widen the bands after recalculation. Price crossing one hundred and ten does not prove it must fall back to the midpoint.
WHY ANCHOR POINTS ARE CRITICAL
A fixed regression channel drawn across last week's Gold trend can have a very different slope from a channel started at the beginning of the month. Including a major CPI breakout or a previous consolidation can materially alter the fitted line and its deviation. Changing start or end points after seeing a winning trade can create hindsight bias. A testable system must specify the window in advance, such as the previous one hundred completed H1 bars, rather than move anchors to match the latest price. The sampling rule is part of the trading strategy.
REGRESSION CHANNELS CAN REPAINT BY RECALCULATION
A rolling regression channel is recalculated as new bars enter and older bars leave the selected window. This can alter recent fitted values and the appearance of historical bands depending on implementation. A manually anchored channel also changes if an analyst adjusts its endpoint. These shifts are not necessarily evidence of malicious repainting, but they create risks for backtesting. A strategy must reconstruct the channel exactly as it existed when the decision was made. Viewing today's recalculated line against last month's candles can give a false sense of signal accuracy.
REGRESSION SLOPE AND TREND STRENGTH
A strongly positive regression slope suggests upward average price movement over the chosen sample, but its raw size depends on quote scale and timeframe. A steep fitted slope does not by itself reveal whether movement was orderly or dominated by one exceptional news candle. Residual dispersion or a normalized fit statistic can offer separate information about how closely price follows the line. Yet high correlation with the past is not proof of future continuation. Combine slope interpretation with H4 swing structure, volatility and available reward-to-risk.
WHAT A HIGH R-SQUARED VALUE MEANS
Some regression tools display R-squared, a statistic related to how much variation in the selected historical prices is explained by a linear fit under the specified model. A higher value can indicate that a straight line matches the past sample more closely, while a lower value suggests substantial deviations. It does not guarantee a strategy win rate or predict the direction of future market moves. A high R-squared after a long trend might deteriorate suddenly during a major economic surprise. Never translate it into a probability of winning the next trade.
CHANNEL BOUNDARIES AND SUPPORT RESISTANCE
Regression bands may overlap visually with previously marked Supply or Demand Zones, but the statistical line and the price-action zone arise from different definitions. The channel can move each bar, while a structural H1 level may remain fixed until price invalidates it. An upper-band touch inside H4 Supply could motivate looking for bearish confirmation, but it cannot guarantee selling pressure. Similarly a lower band at H1 Demand is a conditional observation rather than certain institutional accumulation. The Stop should follow structural invalidation, not a convenient band intersection.
BREAKOUT VERSUS MEAN REVERSION
One strategy might Buy when price closes above the upper regression band, seeking continuation. Another might consider selling after a failed breakout, expecting a return toward the midline. These are opposite hypotheses. A market with strong H4 bullish structure can punish a reflexive countertrend short, while a sideways market can punish breakout chasers. Decide which regime, trigger and invalidation you are testing before viewing historical winners. A failed breakout is not always a profitable reversal signal, and price can remain outside the envelope.
REGRESSION CHANNELS VERSUS DONCHIAN
Donchian Channels use the highest High and lowest Low over a rolling window, producing step-like extreme boundaries. Regression Channels fit a line and often use statistical deviation bands. The former highlights observed range extremes, while the latter describes an average trend and dispersion. A Donchian breakout level may coincide with a regression upper band but the formulas are fundamentally different. Traders should not assume they generate equivalent signals or Stops. Each should be separately tested against the same chart, time period and realistic trade costs.
REGRESSION CHANNELS VERSUS KELTNER
Keltner Channels usually place ATR-derived bands around an EMA, which differs from a linear least-squares regression line with residual-dispersion boundaries. A strong one-off candle may affect these calculations differently. A regression channel's slope can reflect the entire selected window, while EMA weights recent observations more heavily. A strategy using Keltner Width as an ATR proxy cannot simply replace that number with residual standard deviation without retesting. Different mathematical assumptions lead to different entries and chart shapes.
TIMEFRAME SELECTION FOR A GOLD CHART
An H4 regression line can describe broad trend direction, while an H1 line shows a narrower movement and M5 reflects short-term noise. Different slopes may coexist: Gold can make an M5 bearish pullback inside a bullish H4 regression channel. Therefore a trader should define which timeframe provides bias and which supplies entry timing. A common structure-led approach marks H4 swings, H1 Supply/Demand and waits for completed M5 confirmation. A short-term channel flip does not automatically overturn the larger trend. Timeframe alignment prevents overtrading.
GOLD BUY EXAMPLE AT H1 DEMAND
Suppose XAUUSD H4 structure is bullish and an H1 regression channel slopes upward. Price retraces toward a previously marked H1 Demand Zone near the lower statistical band. An M5 bullish engulfing or Change of Character completes after a real price rejection. A Buy could be evaluated conditionally with a Stop below meaningful structural invalidation and target toward H1 Supply. Yet if a Fed surprise suddenly raises US real yields, the scenario can fail. Do not infer that the lower regression band guarantees buyers.
EURUSD SELL EXAMPLE AT H1 SUPPLY
Imagine EUR/USD H4 has lower highs and lower lows while an H1 regression fit slopes down. Price rallies to H1 Supply near the upper deviation band and then prints a completed bearish M5 structure shift. A Sell might satisfy a tested plan if the Stop above the swing high and target near opposing Demand yield sensible reward-to-risk. If an ECB announcement causes sustained price acceptance above Supply, the bearish thesis is invalidated. The fitted upper line should never replace a real invalidation level.
MT5 AND TRADINGVIEW IMPLEMENTATION
TradingView offers regression drawing tools and scripts, while MT5 implementations may require a custom indicator or EA calculation. Their default input-price source, window, standard-deviation convention and anchor behavior may differ. To reproduce levels, compare the same OHLC feed, bar timestamps and formulas. For automation, do not use future candles or the final values of a rolling channel that were unavailable when an old trade occurred. Actual market orders need broker Bid/Ask quotes, tick value, stop-level compliance and realistic fill assumptions.
BACKTESTING AND AVOIDING DATA LEAKAGE
A valid historical test must specify the regression window, band multiplier, chart timeframe, entry trigger, structural Stop and target before reviewing outcomes. Rolling-channel values should be reconstructed using only the data that existed at each decision timestamp. Measure performance against a simpler H4/H1 price-action strategy with the same spread, commission and slippage assumptions. Include channel crosses that failed, missed pullback entries and periods with no trades. Optimize one dataset, then validate out of sample. A visually smooth retrospective channel does not guarantee future profitability.
LINEAR REGRESSION CHANNEL FAQ
Does a regression line connect every swing low? No. Do upper bands show confirmed institutional sell orders? No. Is a rolling channel constant after new bars arrive? No. Is R-squared the same as win probability? No. Can price remain outside a band during a trend? Yes. Is a statistical lower band an automatic Buy? No. Can the method help describe past trend and dispersion? Yes. Use the channel as optional context while actual H4/H1 price structure, completed M5 confirmation, structural Stops and responsible position sizing determine whether a trade is justified.
PIPSEPAISA FREE COURSES
Explore multi-timeframe chart structure, price zones and entry confirmation in Sir Sajid Khan Ghori's Free Forex Technical Analysis Course. Learn how central-bank rates, inflation and USD flows affect Gold with Sir Ghulam Abbas's Free Forex Fundamental Analysis Course. Visit www.pipsepaisa.com Courses for current enrollment. Educational only, not personalized financial advice. Leveraged Forex and Gold involve the risk of significant capital loss.
Read in Roman Urdu
LINEAR REGRESSION CHANNEL KYA HAI?
Linear Regression Channel selected Historical Candlestick Price Data par statistical straight best-fit trend line aur upper/lower bands draw karta hai. Trader trend slope, Price Deviation aur potential overextended areas visualize kar sakta. Ye actual Institutional Orders ya guaranteed Supply/Demand not directly. Chart selected Start/End Bars change ho to Channel slope/boundaries differ. Gold XAUUSD H1 aur EURUSD H4 different period lines. Next M5 reversal confirmed nahi. Price Structure and Risk Management zaroori.
REGRESSION VS TRENDLINE
Manual Trendline Trader selected Swing Highs/Lows connect karta hai. Linear Regression mathematically all selected Bars ki Price Series par best-fit Line, often central Trend. Isliye regression line actual Support Low touch compulsory nahi. Less hand-drawn fitting but Start/End Period selection still subjective. Chart Analyst H4 HH/HL structure separately mark kare, Regression Slope automatically BOS/CHoCH nahi. H1 Supply/Demand and M5 candle confirmation needed for real trade.
LEAST SQUARES FORMULA CONCEPT
Regression Least Squares selected bar index x aur Price y par best-fit straight line choose karta hai jo Squared Vertical Errors sum minimize. Errors large hon to square ki wajah se more weight. Historical Fit Future Gold Price line follow guaranteed nahi. Source Price Close vs HL2/Typical Price different calculation. Chart Equation y=a+bx concept. Slope trend orientation, Bank Money Flow proof nahi. Timeframe selected essential.
LINEAR REGRESSION EQUATION
Basic Equation y = a + b×x; a intercept, b Slope per Bar. b Positive selected Window fitted Trend upward, b Negative downward. Gold per H1 Bar $1 slope aur EUR/USD M5 slope 0.0001 directly compare nahi. Timeframe, Pair Digits and Price Units matter. Line Price forecast future exact quote nahi. H4 Actual Market Structure HH/HL LH/LL test. Regression Support is statistical estimate.
REGRESSION MIDDLE LINE
Regression Centerline best-fit average trajectory for selected prices. Ye VWAP, Volume Profile POC ya exact Institutional Fair Value nahi. Price above Centerline Strong H4 Trend mein for long period remain possible. Middle Return every Candle guaranteed nahi. H1 Supply ke without blindly Upper Sell ya Centerline below Buy mistakes. Actual Swing Structure and complete M5 Rejection/CHoCH. Backtest separate Trend Following and Mean Reversion rules.
CHANNEL UPPER LOWER BANDS
Regression Channel Upper/Lower commonly Residual Standard Deviation Multiple away from Centerline. Some Platforms fixed distance ya maximum extreme envelope use, output differ. Source Close, High/Low, Stdev Calculation, Regression Window and Multiplier check. MT5 vs TradingView same Price Chart but Channel Values different could be algorithm choice. Upper Band true pending Sell Limit Orders confirm nahi. Price M5 close with H1 Supply/Demand required. Safe Lot and Stop.
DEVIATION EXAMPLE
Hypothetical Regression Mid Value100, Distance Estimate5, Multiplier2. Upper Channel 110, Lower90 under simple symmetric formula. Ye hypothetical prices hain, live EURUSD/XAUUSD nahi. Historical Residual Dispersion change to Bands recalculate. Upper110 touch = guaranteed Sell Reversal nahi. Gold trend momentum high to beyond Band continue. H4 Supply, M5 Bearish Confirmation, SL Swing High and RR. Source method important.
ANCHOR PERIOD CHOICE
Regression Window Start aur End Bars drastically slope change. Gold CPI Breakout included vs excluded fit different. Last 100 Completed H1 Bars system define karein to fair Backtest, after Result lines drag to touch winners misleading. TradingView manual Channel vs EA rolling Regression different recalculation. H4 Trend first, then Indicator context. Future Candles earlier historical decision mein include Lookahead Bias. No Confirmation = No Trade.
REGRESSION RECALCULATION ISSUE
Rolling Regression each new completed Candle par Window shift, Old Bars leave, slope and Band Values update. Historical Chart recent line change possible depending plotting method. Manual Endpoint move ho to earlier Channel different. Ye always future-data scam nahi, ordinary recalculation. Lekin Strategy Backtest at decision-time Channel must reconstruct. Today final line ke against old Winning M5 Entries compare biased. MT5 EA previous closed bar calculations and screenshots useful. No Confirmation = No Trade.
REGRESSION SLOPE TREND
Regression Slope steep positive historical Sample Uptrend, steep negative Downtrend. Lekin one huge NFP Gold Candle full line slope change kar sakti, smooth Trend proof nahi. Quote Unit/Timeframe make slope magnitudes noncomparable across EURUSD and XAUUSD. Residual Standard Deviation Fit Quality context, future trend guaranteed nahi. H4 HH/HL or LH/LL, H1 zone and M5 full candle confirm. Account Risk constant.
R SQUARED EXPLAINED
Regression R-Squared selected Historical Price Variation ka linear Fit Quality statistic. High Value means past sample straight line explains more of fitted variation, Trading Win Rate same number nahi. R² 0.90 = next 10 Trades 9 wins guaranteed false. Gold NFP after Trend Reversal R² change fast. Period selection and Scale matter. Use only historical descriptive context. H4/H1 Supply/Demand with complete M5 confirmation necessary.
REGRESSION SUPPORT RESISTANCE
Upper Regression Band H4 Supply overlap, Lower H1 Demand overlap visually. Statistical Band Price Calculation, P+ Buying/Selling Zone real Price Structure based. Regression line move after new Bars, Structural Zone fixed until invalidate. Sell only H1 Supply Rejection + M5 Bearish Full CHoCH/Engulfing if strategy. Stop meaningful Price Swing beyond, not random Band level. Order Flow guarantee none. No Confirmation = No Trade.
BREAKOUT VS MEAN REVERSION
Upper Regression Band above Full Close Trend Continuation Buy hypothesis, Upper Rejection countertrend Sell/Mean Reversion hypothesis, contradictory Strategies. H4 Strong Uptrend mein Upper Sell repeated SL possible. Sideways H1 Range mein breakouts fail. Entry Mode before Backtest define, after winning chart rules switch unfair. H1 Supply, M5 Price Rejection and Structural SL. Trade missing confirmation skip. No Confirmation = No Trade.
REGRESSION VS DONCHIAN
Donchian Highest High/Lowest Low rolling Window, Regression best-fit Centerline plus Deviation. Donchian extrema step-like, Regression slope continuously trend-based. Levels sometimes align but same institutional Orders proof nahi. Donchian upper breakout and Regression upper breakout different conditions. MT5 EA Conversion separate formulas. H4/H1 Structure and M5 complete Candle use. Stop and Lot Risk consistent in comparison.
REGRESSION VS KELTNER
Keltner EMA Center plus ATR bands, Regression Least Squares Center plus Residual Dispersion/Tool-Specific width. One Huge Gold News Candle both different degree respond. EMA recent prices more weight; regression full Window fit. ATR and Standard Deviation identical volatility metric nahi. Keltner Setup Regression par directly copy and guarantee same signal false. Indicator Parameter, Period, Close Price and Stop Rules tested. No Confirmation = No Trade.
H4 H1 M5 REGRESSION
H4 Regression Bullish broad Trend, H1 Pullback flat, M5 momentary Bearish slope simultaneously possible. M5 Red slope H4 Major Reversal guaranteed nahi. H4 Structure define, H1 P+ Zone map, M5 Completed Engulfing/CHoCH for entry. Regression channel optional Trend/Extension context. Multiple opposite timeframes ke Signals confusion before trade avoid. News volatility Gold Bands shift. No Confirmation = No Trade.
GOLD BUY REGRESSION EXAMPLE
XAUUSD H4 HH/HL, H1 Regression upward slope. Gold H1 Demand Zone near Lower Band Retest, M5 Bullish Engulfing/CHoCH Full Close. Conditional Buy with SL Swing Low below, target H1 Supply. Hot CPI/FOMC Real Yields higher to Gold reverse possible. Lower Statistical Band exact Bank Buy Orders nahi. Lot Equity Risk and Broker Gold Contract Size. Educational Scenario not live Buy Call.
EURUSD SELL REGRESSION EXAMPLE
EUR/USD H4 LH/LL, H1 Regression downward, Price H1 Supply + Upper Deviation Band near. M5 Full Bearish CHoCH confirmation, conditional Sell. SL real Swing High beyond, target H1 Demand. ECB Surprise EUR strong and Supply above acceptance then Sell wrong. Channel line convenient visual but Structural Stop invalidation based. Pip Value, Spread and account risk. No Confirmation = No Trade.
MT5 TRADINGVIEW REGRESSION
TradingView Manual Regression Channel drawing aur custom Pine Indicator vs MT5 iCustom/EA formulas differ. Start/End Time, Close Source, Standard Deviation width, Window Length and sample n vs n-1 convention check. Backtest prior M5 Entry pe future H1 Bars data use lookahead bias. MT5 EA Candle Closed Index, Buffer Loading and TF Change readiness. Actual Order Bid/Ask Quote, Spread, StopLevel, Lot Risk. Indicator band synthetic level real guaranteed fill nahi.
REGRESSION BACKTEST
Regression Window N Bars, Source Price, Deviation Width, H4/H1 Trend, M5 Full Candle Trigger, SL and TP written. Historical Decision Time par only existing Bars se Channel calculation. Future H1 High use to early M5 entry fraudulent backtest. Plain Price Action vs Regression Filter, same dates/Spread/Lot Risk compare. All Losing and Missed Winners. Net R, Drawdown, Trade Frequency and Out-of-Sample Period. Perfect Final Chart shows past fit, future guarantee nahi.
REGRESSION FAQ
Regression line all Swing Lows connect? Nahi. Upper Band actual Bank Sell Wall? Nahi. Rolling Channel fixed forever? Nahi. R-Squared win probability? Nahi. Price outside Band trend continue? Haan. Lower Band guaranteed Buy? Nahi. Historical Trend/Dispersion Context useful? Haan. Workflow H4 Market Structure → H1 Supply/Demand → Regression optional context → M5 Full Engulfing/CHoCH Close → Structural SL/TP/Lot. No Confirmation = No Trade.
PIPSEPAISA FREE COURSES
Sir Sajid Khan Ghori Free Forex Technical Analysis Course aur Sir Ghulam Abbas Free Forex Fundamental Analysis Course www.pipsepaisa.com Courses par current information. Educational Guide, financial advice nahi. Gold/Forex leveraged losses possible.
REGRESSION RISK CHECKLIST
Regression Channel draw karne se pehle Trader selected Period fixed rakhe, like last 100 completed H1 Candles. Agar Chart Screenshot after trade different regression Endpoint use kare to dishonest hindsight result. MT5 EA and TradingView script matching Source Prices and Deviation method verify. News ke current M5 Candle forming ho to Regression and Band Recalculation happen possible; line touch before Candle Close guaranteed reversal nahi. H4 Gold Bullish yet Regression Lower Band near H1 Demand, Buy only M5 full Bullish Engulfing/CHoCH after real Price Rejection. Upper Band at H1 Supply, Sell only bearish confirmation under written rules. Structural SL Swing behind, TP next Opposing Zone, enough reward-to-risk required. Regression Band Price units and Account Dollars different; calculate broker contract size, pip/tick value and volume using equity risk percent. Large Gold CPI/NFP swings slippage risk. Journal No Trade decisions bhi. No Confirmation = No Trade.
Educational content only. Trading involves risk. Always use independent analysis and appropriate risk management.