
Donchian Channels Explained: Forex Breakout Strategy, Channel Highs/Lows and Position Risk
PipSePaisa • Forex Education & Research
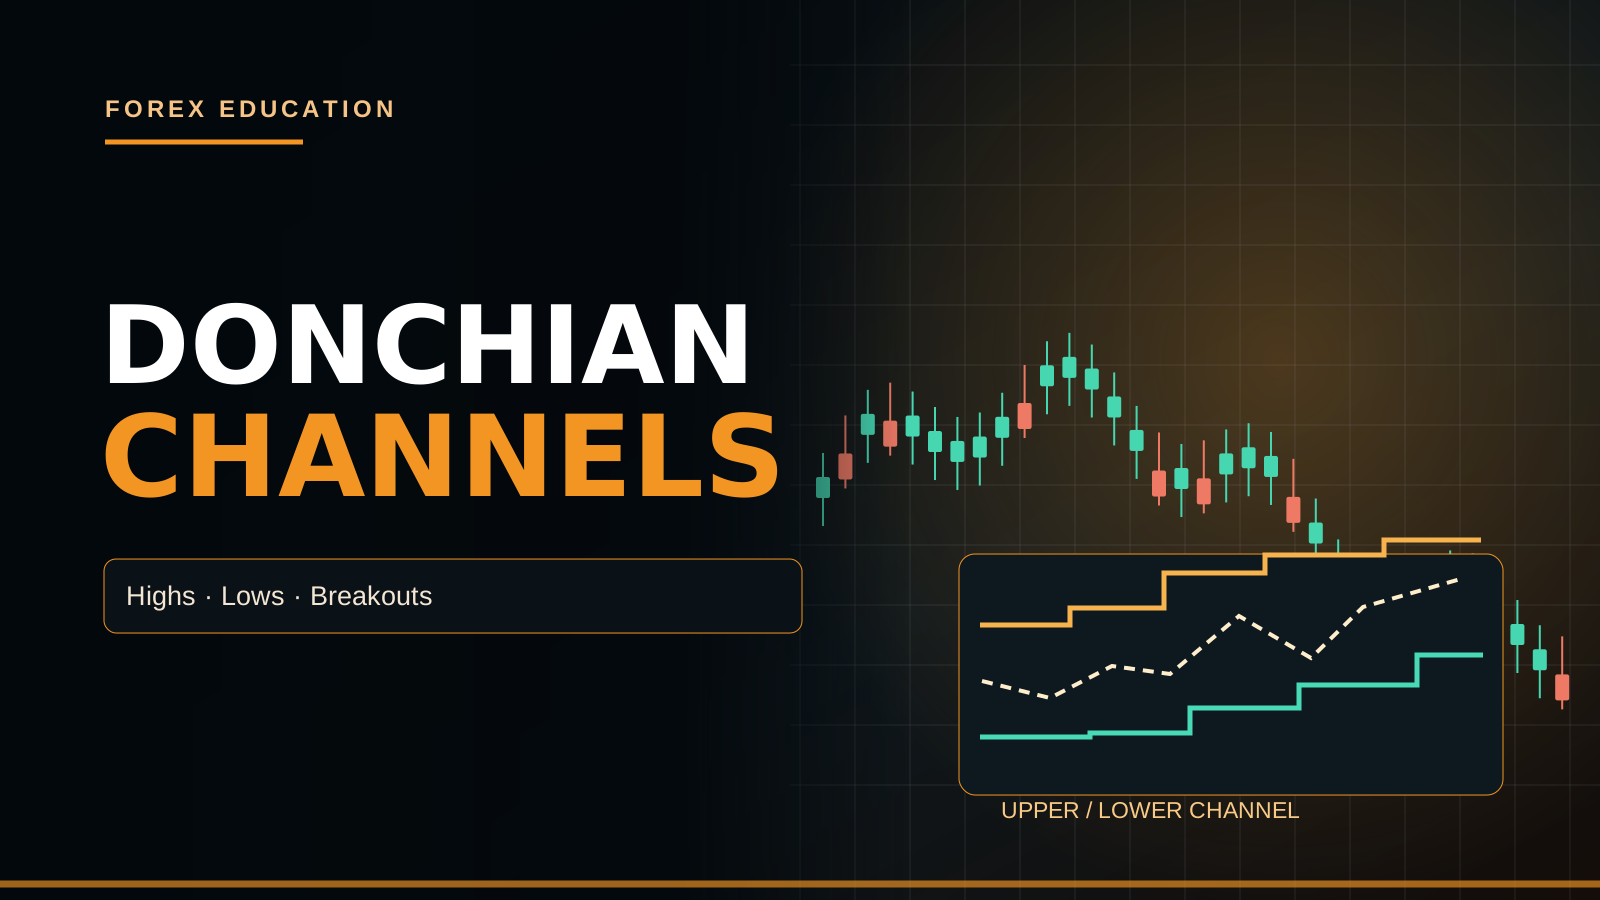
WHAT ARE DONCHIAN CHANNELS?
Donchian Channels are a price-based technical indicator that plots an upper boundary, a lower boundary and commonly a middle reference derived from recent highs and lows over a selected lookback. They are often associated with trend-following breakout systems. The upper line generally represents the highest high of the lookback window, and the lower line represents its lowest low under the chosen bar inclusion convention. These levels can highlight price expansion and compression, but they are not forecasts of guaranteed future highs or lows. A breakout can fail.
HOW THE UPPER CHANNEL IS CALCULATED
A common upper-channel formula is the maximum High over the most recent N completed bars. For a twenty-period Donchian upper band, take the highest price reached in the selected twenty-bar window according to the software's definition. Some implementations include the current still-forming bar, while others reference only prior completed bars for signaling. That distinction matters greatly: a current-bar high cannot be broken above itself in the same way as a previous-channel high. Clarify the indexing convention before backtesting.
HOW THE LOWER CHANNEL IS CALCULATED
The lower Donchian band is commonly the minimum Low across the chosen lookback. A twenty-bar lower channel therefore marks the lowest price among the selected twenty observations. In a strong downward trend, the band may step lower as new lows develop. In a sideways range, it can remain flat and indicate an area repeatedly tested by price. However, a lower-band touch does not automatically mean a Buy. Trend-following systems may instead interpret a break beneath prior lows as a bearish continuation signal.
MIDDLE CHANNEL FORMULA
Many Donchian displays include a middle band calculated as (Upper Channel + Lower Channel)/2. This midpoint summarizes the price range rather than a traded volume Point of Control. It is not necessarily the average transaction price or a fair-value level used by institutions. A trader can use it as a rough reference for where price sits inside the channel, but it should not be confused with a moving average, VWAP or Volume Profile POC. Each tool calculates different information.
WHAT LOOKBACK LENGTH MEANS
A short lookback reacts quickly to recent range changes but may produce more frequent breakouts and false signals. A longer lookback captures broader extremes and changes less often, potentially reducing noise while providing fewer entries. Twenty-period and fifty-five-period concepts appear in classic trend-following discussions, but no universal setting suits every instrument or timeframe. Gold volatility and EUR/USD behavior can differ, as can M5 and H4 charts. Test the chosen N on independent historical data rather than selecting it by one attractive screenshot.
HOW TO IDENTIFY AN UPSIDE BREAKOUT
For a bullish breakout model, price moves above the upper band derived from earlier completed candles. Some traders require a completed M5, M15 or H1 Close beyond the prior boundary before considering the move confirmed. A wick above the band that closes back inside may be treated as a failed breakout instead. But the exact close rule is a design choice requiring testing. A price breakout without enough target room to higher-timeframe Supply may still be unattractive. Avoid entering only because a line was touched.
HOW TO IDENTIFY A DOWNSIDE BREAKOUT
A bearish trend-following model may watch price close below the lowest low of a prior lookback. That can indicate new downward price exploration rather than an oversold Buy opportunity. Yet markets often make false breaks below equal lows and rebound into a range. A cautious model might wait for a retest of the broken band or a bearish M5 structure confirmation. If H4 Demand lies immediately beneath price, the target may be too close. A genuine signal must combine entry logic and invalidation.
FALSE BREAKOUTS AND RE-ENTRIES
A Donchian upper-band breakout can quickly return inside the channel, especially in low-liquidity periods or near high-impact economic releases. This creates a potential false breakout. But a failed break does not automatically predict a large reversal either. A trader who shorts every return inside the band is operating a separate contrarian strategy from a standard trend-following breakout method. These methods should have distinct rules, Stops and backtests rather than being mixed opportunistically.
WHAT A CHANNEL SQUEEZE MEANS
When the upper and lower Donchian boundaries move closer together, the observed range across the lookback has narrowed. Some traders interpret this as consolidation before a possible expansion. But narrow ranges can persist longer than expected, and a breakout can occur in either direction. The Donchian width alone does not determine the strength of future momentum. ATR or other volatility measures may provide complementary context, but adding an indicator is not proof of a better trading edge.
DONCHIAN CHANNEL WIDTH
Channel width can be calculated as Upper Band minus Lower Band, expressed in the instrument's price units or normalized as a percentage of a relevant price. A Gold width of fifteen dollars and an EUR/USD width of fifty pips are not directly comparable without contract and percentage context. The width summarizes recent extreme-to-extreme range but does not equal the correct Stop Loss for every strategy. Actual risk should be tied to structural invalidation and volume, not simply the indicator width.
DONCHIAN VERSUS BOLLINGER BANDS
Donchian Channels use rolling highs and lows. Bollinger Bands commonly use a moving average plus/minus a multiple of standard deviation. Both may expand during volatility, but their mathematical definitions and visual responses differ. A Bollinger upper-band touch is not equivalent to breaking a prior twenty-bar Donchian high. Some strategies mean-revert from a Bollinger extreme, while Donchian trend-following methods may enter in the direction of a breakout. Choose the framework and conditions explicitly instead of mixing signals without testing.
DONCHIAN VERSUS KELTNER CHANNELS
Keltner Channels generally center around a moving average and use an average true range-based envelope, while Donchian Channels use observed price extremes. A Keltner channel can change as volatility estimates move even if the highest and lowest prices stay the same. Donchian's upper band is directly connected to the selected lookback maximum. A strategy designed for ATR envelopes cannot be transferred to the Donchian method without modification. Different underlying calculations lead to different signals and Stop placements.
DONCHIAN AND TURTLE TRADING
Donchian breakout channels are often associated with historical trend-following methods including ideas popularly linked with the Turtle Trading experiments. However, a broad historical association does not mean that any twenty-bar breakout copied today is profitable. Original systematic methods included specific position sizing, exits, risk controls and portfolio rules. Market conditions and transaction costs have changed. Educational summaries should avoid marketing a channel line as a proven money machine without contemporary, properly tested evidence.
BREAKOUT PLUS RETEST METHOD
Some traders prefer a completed close beyond the prior Donchian band and then a pullback to the broken level. If the former resistance holds as potential support and M5 forms a completed bullish engulfing, a conditional Buy can be evaluated. Conversely, a bearish breakout may retest former support from below. But many genuine trends do not retest, so waiting can miss opportunities. Retest entry systems and immediate breakout systems should be compared fairly with all missed and failed trades included.
H4 TREND AND H1 ZONES
Donchian signals can be more informative when assessed alongside larger price structure. A bullish H4 Higher High/Higher Low sequence supports a trend-following long hypothesis, while H1 Demand can offer an entry area on pullback. A fresh upside channel breakout directly into H4 Supply may be risky. The same principle applies to bearish channels approaching strong H1 Demand. Structure and market location often matter more than simply selecting the longest streak of band breakouts.
EUR/USD BUY EXAMPLE
Imagine EUR/USD H4 is bullish and an H1 range has developed beneath a prior swing high. A completed M15 candle closes above the twenty-bar Donchian upper level. The next M5 pullback retests the broken high and creates a bullish higher low. A trader could evaluate a Buy using a Stop below the retest swing and a target near the next H1 Supply. If the spread or Stop distance makes the target-to-risk ratio unattractive, the trade should be skipped.
GOLD SELL EXAMPLE
Suppose XAUUSD H4 has lower highs and lower lows and Gold has rallied back into H1 Supply. A fresh completed bearish M5 structure shift occurs as the price closes beneath a previous Donchian lower boundary. If the trader's tested plan requires an M5 retest, that must occur before entry. Stop Loss belongs beyond actual price invalidation, and Gold lot size should reflect its contract size. A higher US real yield may reinforce the macro bias, but neither indicator nor economics makes the next candle certain.
USING ATR FOR STOP CONTEXT
Average True Range measures recent price-range volatility. Some trend systems use ATR to help assess whether a Stop is unusually tight relative to normal fluctuations. But an ATR-based Stop may not correspond to the precise structural point where a breakout thesis fails. A hybrid risk plan could consider both H1 swing structure and measured volatility, with a clear maximum monetary loss. If the required Stop distance cannot fit the broker's minimum lot within the risk budget, skipping is sensible.
TRAILING EXIT WITH A CHANNEL
A trend-following system may use a shorter-period opposing Donchian line as a trailing exit reference, allowing a trade to run until price breaks against the established trend. This can capture large moves but may give back floating gains and stop out during sideways periods. An exit based on a synthetic indicator value still needs actual tradable price execution. The choice of entry lookback and exit lookback affects payoff distribution. Test both systematically before using a complex recovery or pyramiding plan.
NEWS BREAKOUTS AND SLIPPAGE
NFP, CPI and FOMC announcements can trigger large channel breakouts accompanied by widening spreads or reduced order-book depth. A completed M5 breakout might occur far from the original band, making the Stop to structural invalidation very wide. Entering immediately at the first tick could produce an even worse fill. If the strategy is tested for ordinary trading sessions, do not assume it transfers directly to news volatility. A strong channel signal and bad execution location can coexist.
BACKTEST WITHOUT LOOK-AHEAD
A valid channel breakout test must use the upper and lower boundaries known before the signal decision. If the current bar is included in the channel computation, explicitly account for that when assessing whether the bar truly crossed the previous range. Future H1 closes must not be used to justify earlier M5 entries. Backtests should use executable bid/ask assumptions, fees, slippage and consistent Exit rules. Compare with a simple H4 trend plus H1 zone strategy to assess whether Donchian adds meaningful value.
COMMON DONCHIAN MISTAKES
Typical mistakes include assuming every upper-band touch signals Buy, using lower-band touch as both Buy and Sell depending on hindsight, ignoring lookback indexing and confusing the channel midpoint with VWAP or Volume POC. Others place Stop Losses mechanically at the opposite band regardless of monetary risk, chase news candles after most of the move, or optimize N until historical results look perfect. A robust process uses a written signal rule, actual structure, correct lot sizing and independent validation.
DONCHIAN CHANNELS FAQ
Is Donchian based on historical high and low prices? Yes. Does an upper-band breakout guarantee a rally? No. Can a lower-band break be a sell-continuation signal? Yes, under a defined trend-following strategy. Is the middle band a volume-based POC? No. Do twenty and fifty-five periods always outperform other settings? No. Can the indicator be combined with a completed M5 engulfing or CHoCH? Yes, but it requires testing. The practical workflow is H4 trend, prior-channel break, H1 location, confirmation and disciplined risk.
PIPSEPAISA FREE COURSES
Explore the Free Forex Technical Analysis Course by Sir Sajid Khan Ghori for market structure, breakout confirmation and disciplined trading. Explore Sir Ghulam Abbas's Free Forex Fundamental Analysis Course for the macroeconomic events affecting Gold and Forex. Visit www.pipsepaisa.com Courses for current enrollment information. Educational use only, not individualized financial advice. Leveraged trading involves risk of substantial loss.
Read in Roman Urdu
DONCHIAN CHANNELS KYA HAIN?
Donchian Channels Price High/Low based Technical Indicator hai jo selected Lookback Bars ka Highest High aur Lowest Low use karta hai. Upper Channel recent highest price, Lower Channel recent lowest price aur Middle line midpoint show kar sakti hai. Forex Trend Breakout Strategy mein commonly use. Lekin Upper Line break hone ka matlab next Candle guaranteed Bullish nahi. Fakeout, News Spike aur Sideways Whipsaw possible. H4/H1 Structure aur M5 Confirmation important.
UPPER BAND FORMULA
Upper Donchian Channel = Previous selected N Bars ka maximum High, depending indicator implementation. N=20 ho to selected 20 candles mein highest price. Lekin Some Chart Current Forming Candle include, kuch previous completed 20 bars. Entry Signal mein current-bar inclusion problem: Current High khud Channel Up shift kar sakta hai. Isliye Breakout Trigger previous completed Channel Boundary pe define karein. TradingView/MT5 Settings consistent. Backtest Future Close Leak nahi.
LOWER BAND FORMULA
Lower Donchian Channel selected Lookback Candles ka Lowest Low. N=20 mein previous 20 bars ka Minimum Low identify. Strong Bearish Trend mein Lower Band new lows par step down, sideways Market mein same Level flat remain. Lower Line Touch guaranteed Support Buy nahi. Breakout Trend-Following Strategy lower Channel breach par Sell Bias bhi discuss kar sakti. H4 Direction aur H1 actual Supply/Demand important. Trade Type strategy pehle define.
MIDDLE LINE KYA HAI?
Donchian Middle Channel Formula (Upper High + Lower Low)/2 commonly. Ye selected Range ka midpoint hai. Isko VWAP, EMA ya Volume Profile POC same nahi samjhein. EMA historical closing prices weighted, VWAP price-volume based, POC highest volume/time activity level. Donchian Middle simple Highest/Lowest Range Center. Market midpoint se guaranteed reverse nahi. H1 Zones aur structure always observe.
LOOKBACK PERIOD SETTING
Donchian Period N short ho, Channel recent Range changes fast follow aur false signals more possible. N larger ho to broader H1/H4 High/Low capture, Signals fewer aur sometimes late. Classic Trend-Following Materials 20/55 periods discuss karte hain, but Gold/EUR/USD universally best nahi. M5 N=20 aur H4 N=20 completely different Time Horizon. Strategy Timeframe aur tested historical sample same hona chahiye.
DONCHIAN BUY BREAKOUT
Bullish Breakout Rule previous completed Donchian Upper Band ke above Price move aur chosen Candle full Close. One Wick above Upper aur Close inside Fakeout potential. Lekin Candlestick Confirmation rule predefine karein M5/M15/H1. H4 Downtrend aur H1 Supply near ho to Buy despite Band Break poor RR. Next Resistance tak realistic Target. No Confirmation = No Trade. Price Band touch ko guaranteed trend start na samjhein.
DONCHIAN SELL BREAKOUT
Bearish Trend Model previous N Bar Lowest Low ke below completed Close watch karti hai. Ye new Downside Price Exploration clue, automatically Oversold Buy nahi. Lekin Equal Lows Sweep ke baad range reclaim possible. Sell ke liye H4 LH/LL Bias, H1 Support Breakdown, M5 Bearish Retest/CHoCH Full Close. H4 Strong Demand near ho to no Target Room. Stop logical Broken Level/Swing High beyond. Indicator alone guarantee nahi.
FAKEOUT RE ENTRY
Upper Band break kar ke Price immediately Channel inside Close ho to potential False Breakout. Lekin Fakeout label automatically deep Bearish move guarantee nahi. Breakout Buy Strategy aur Failed Breakout Sell Strategy different systems hain. H1 Supply Rejection aur M5 Bearish CHoCH present ho to contrarian setup conditional. Same Indicator green/red dekh kar random Strategy Switch na karein. Historical Wins aur Losses both count.
CHANNEL NARROW RANGE
Upper aur Lower Donchian Bands near ho jayein to selected Historical High-Low Range smaller hai. Some Traders Consolidation aur potential breakout observation ke liye use. Lekin Narrow Range several Sessions continue bhi aur Fakeouts repeated. Width alone next direction predict nahi. ATR Volatility Context add kar sakte hain, but ATR High = Guaranteed Buy/Sell nahi. H1 Support/Demand aur actual Break Candle Close wait karein.
CHANNEL WIDTH FORMULA
Donchian Width = Upper Price − Lower Price. Gold XAUUSD Band Gap $15 aur EUR/USD Range 50 Pips, units different. Width selected N bars ki extreme Range hai, direct Account Money Risk nahi. Structural Stop nearest Swing Low/High beyond depending strategy. Percentage Normalization Compare helpful, but Gold Contract Size and Forex Pip Values separate. Huge Channel Wide ho to same Lot increased Risk. Calculate before Entry.
DONCHIAN VS BOLLINGER
Donchian Upper/Lower recent Highest/Lowest Price se. Bollinger Bands Moving Average + Standard Deviation based. Dono Volatility Context show kar sakte hain but mathematical behavior different. Bollinger Upper Touch aur Previous Donchian High Break same Signal nahi. Some Bollinger Strategies Mean Reversion use, Donchian Trend Systems Breakout direction. Trader ko exact Entry Logic define aur independently test karna chahiye. Two Indicators label together A++ win guarantee nahi.
DONCHIAN VS KELTNER
Keltner Channels Moving Average Center aur ATR-based bands commonly use karte hain. Donchian Highest High/Lowest Low window se. Keltner Volatility Estimate change ho to Band move, even if prior Range extremes constant. Donchian High recent N-Bar max. Keltner breakout Rules Direct Donchian par same perform guaranteed nahi. Formula/Backtest separate. Chart Lines visually similar hone se indicator meanings equal nahi.
TURTLE TRADING CONCEPT
Donchian Channels Classic Turtle Trend-Following discussions se linked commonly. Lekin old historical Strategy Concept ka matlab aaj same 20-Bar Breakout guaranteed profitable nahi. Systems mein Entry, Exit, Lot Size, ATR Risk, Correlation aur Portfolio Rules include hotay hain. Ek TradingView Line alone full System nahi. Current Gold/Forex Spread, Slippage aur Out-of-Sample Results test karein. Historical Famous Strategy Future Guarantee nahi.
BREAK RETEST ENTRY
Donchian Upper Band Above M15/H1 Completed Close, then Price broken Band par Retest kare. Former Resistance Support hold aur M5 Bullish Engulfing Full Close ho to conditional Buy. Lower Band Break ke baad retest below Sell equivalent. Lekin Strong Trend Retest na de to Trade Miss. Missed Winners Backtest mein record. Retest Rule change kar ke after winners Early Entry pretend na karein. No Confirmation = No Trade.
H4 H1 DONCHIAN CONTEXT
H4 HH/HL Uptrend aur H1 Demand Price Location Donchian Bullish Signal ke saath confluence. Upper Band Break directly H4 Supply par ho to late Buy risk. H4 LH/LL Trend mein Lower Band Break next H1 Demand near ho to Sell TP insufficient. Multi-Timeframe Levels before Indicator Signal map karein. Trend Line and Channel same direction appear but no guaranteed success. Proper RR needed.
EUR/USD BUY EXAMPLE
Hypothetical EUR/USD H4 Bullish aur H1 Consolidation. M15 Previous 20-Bar Donchian Upper Break + Full Close. M5 Retest par Higher Low aur Bullish Engulfing complete. Buy Candidate SL Retest Low below, TP next H1 Supply. Agar target only 10 Pips aur structural SL 25 Pips, no Trade. CPI/FOMC News imminent ho to Spread Risk. Ye Educational Setup hai, Live Signal nahi.
GOLD SELL EXAMPLE
XAUUSD H4 Lower High/Lower Low aur H1 Supply Pullback. M5 Bearish CHoCH + previous Donchian Lower Level Break Full Close. Tested System retest require kare to wait. Stop actual price Swing High beyond, Gold Lot Contract Size/Equity risk se. Real US Yield Up fundamental bearish context ho sakta, but Gold P+ Selling Zone aur Donchian Break guaranteed win nahi. SL and reasonable Target necessary.
DONCHIAN ATR STOP
ATR Recent Volatility measure karta hai. Donchian Breakout mein random 5 Pip Stop Normal Fluctuations se hit possible. ATR-based Stop Context useful but H1 Structural Invalidation ko ignore na karein. Hybrid SL meaningful Swing plus volatility buffer under chosen method. Lot Money Risk Constant rakhne ke liye Stop Distance larger ho to Volume reduce. Broker Minimum Lot Risk Limit exceed ho to No Trade. Risk Budget important.
DONCHIAN TRAILING EXIT
Some Trend Systems opposite shorter-period Donchian Band breach ko Exit/Trailing signal use karte hain. Strong Trends mein Profits run possible, sideways Market mein repeated small Losses. Floating +2R Profit eventually +0.5R Close ho sakti hai. Indicator Level actual Broker Stop Fill guarantee nahi. Entry N aur Exit N separate backtest. Recovery Lot Double kar ke sideways whipsaws manage karna risk increase. Hard Account Loss Limit rakhna zaroori.
DONCHIAN NEWS BREAKOUT
NFP/CPI/FOMC par Gold Huge Donchian Upper/Lower Channel Break kar sakti hai. M1 Candle Spread Wide, Slippage high. Completed M5 breakout already 100 Pips move hone ke baad target room small. Ordinary London Trend System News Shock mein same reliability guaranteed nahi. News Avoid Filter follow karein. Strong Breakout label Risk-free Entry nahi. No Confirmation = No Trade.
DONCHIAN BACKTEST RULE
Backtest mein previous completed N-Bar Upper/Lower Band use karein, current bar High include logic correctly account. M5 Open Candle par future H1 Close knowledge use na karein. Entry, SL/TP, News Filter aur Session predefine. Bid/Ask Spread aur realistic Slippage. Plain H4 Trend/H1 Demand Model vs Donchian Filter Results Net R compare. Hindsight Selected Winning Breakouts edge prove nahi. All failed signals include.
COMMON CHANNEL ERRORS
Upper Line Touch = Buy guaranteed, Lower Line Touch = Sell/Buy arbitrary, Current-Bar inclusion confusion, Donchian Midpoint same as VWAP, Opposite Band random huge SL, News M1 Chase, Perfect Period optimize after historical losers. Ye mistakes. Indicator Price Range show karta, institutional pending orders confirm nahi. Clear Written Entry/Exit, H1 Zone, M5 Complete Close, Structural SL aur Correct Lot necessary. No Confirmation = No Trade.
DONCHIAN FAQ
Donchian High Low based? Haan. Upper Break guaranteed Rally? Nahi. Lower Break Bearish continuation clue? Possible under defined system. Middle POC/VWAP? Nahi. N20/N55 universal best? Nahi. M5 Engulfing/CHoCH ke saath use? Haan but backtest required. Final Workflow H4 Trend → H1 Supply/Demand → Previous Donchian Band → Full Candle Break/Retest → M5 Confirmation → Structural SL/TP/Lot. No Confirmation = No Trade.
PIPSEPAISA FREE COURSES
Sir Sajid Khan Ghori ka Free Forex Technical Analysis Course aur Sir Ghulam Abbas ka Free Forex Fundamental Analysis Course www.pipsepaisa.com ke Courses section se check karein. Educational Content hai, Financial Advice nahi. Leverage se capital loss possible.
Educational content only. Trading involves risk. Always use independent analysis and appropriate risk management.