
How to Identify Forex Trends with Trendlines and Market Structure
PipSePaisa • Forex Education & Research
INTRODUCTION
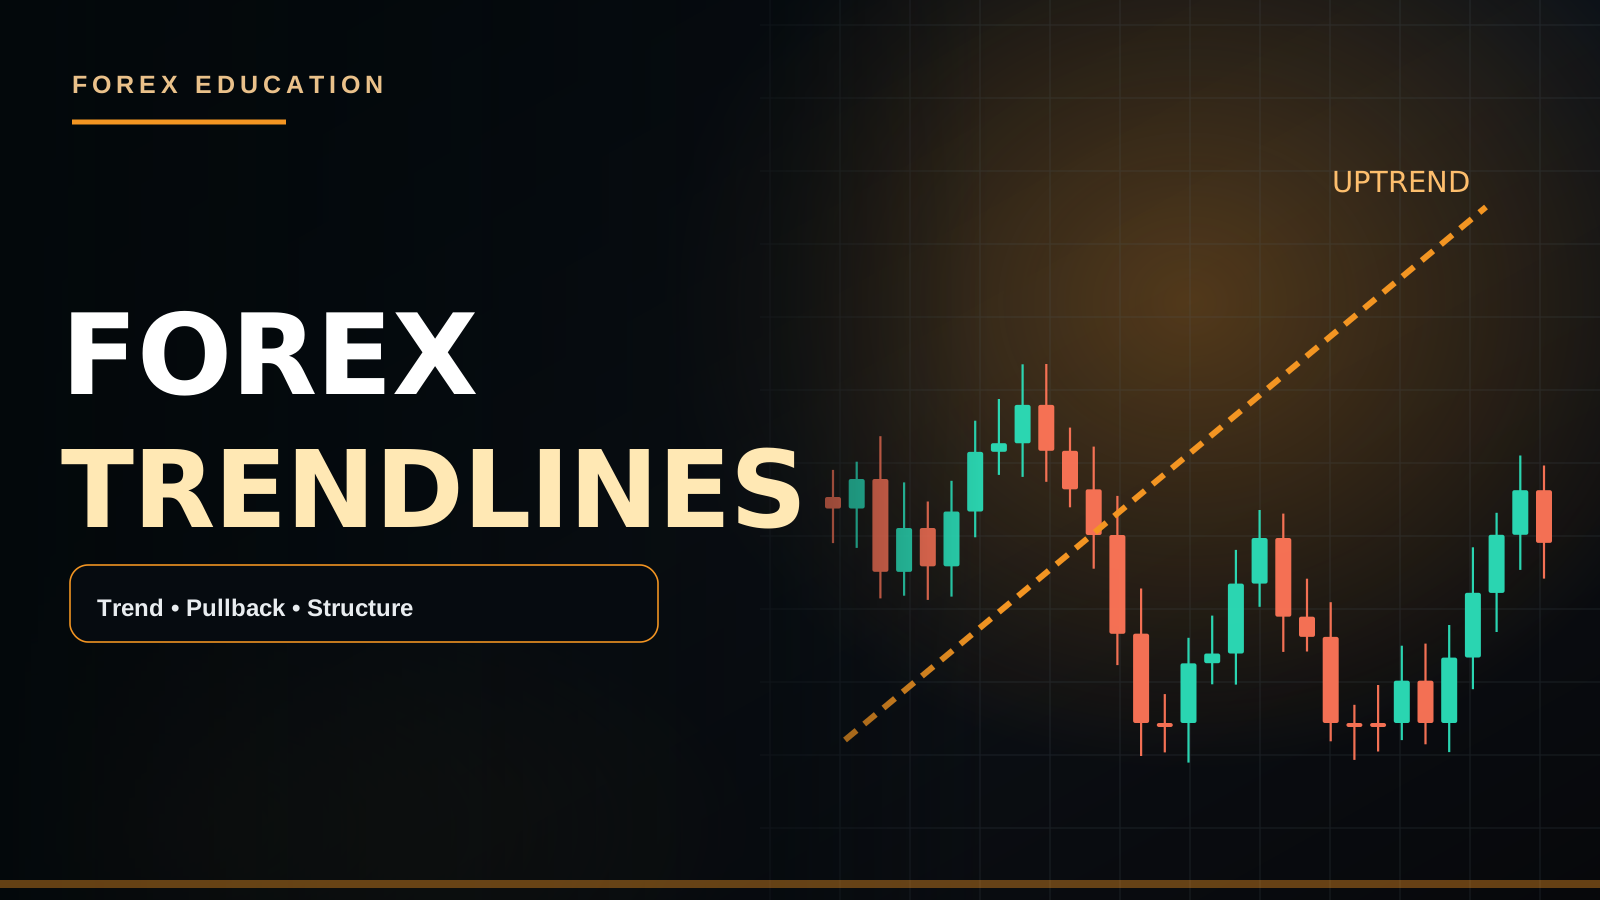
Trendlines are visual guides that connect meaningful swing points to illustrate the direction and pace of price movement. They are not mechanical barriers that price must respect. The strongest analysis combines swing structure, horizontal zones and an explicit definition of when the trend thesis has changed.
1. DEFINE THE TREND FIRST
An uptrend generally produces higher swing highs and higher swing lows; a downtrend produces lower highs and lower lows. Sideways ranges can produce apparently convincing trendlines that fail quickly. Start with H4 or H1 to identify major market structure before drawing diagonals on a noisy M1 chart.
2. DRAW A CONSISTENT LINE
For a rising trend, anchor a line beneath meaningful higher lows; for a falling trend, connect lower highs. Use at least two well-separated swings and treat a third reaction as additional context. Different chart scales and wick-versus-close conventions can produce slightly different lines, so regard the line as a zone rather than an exact entry point.
3. QUALITY OVER TOUCH COUNT
A steep line often breaks because price cannot maintain the previous rate of acceleration. Many touches do not guarantee future defense. Consider whether the line aligns with horizontal demand or supply, a major moving average, session structure or an obvious liquidity area.
4. BREAK AND RETEST EXAMPLE
Suppose GBP/USD has formed progressively higher lows and is trading above a rising line on H1. A strong candle closes below both the line and a recent higher low; a subsequent rally fails below that structure. This may indicate weakening bullish control. One intrabar wick through the trendline without structure change is weaker evidence.
5. ENTRY AND RISK PLAN
For trend continuation, wait for price to pull toward a suitable zone, then assess a confirmed rejection. For potential trend reversal, require a structural shift and a rational invalidation point. Choose a target at a relevant opposing zone, not simply a fixed number of pips.
6. COMMON MISTAKES
Forcing a line through unrelated swings, moving anchors after every loss, assuming all line breaks are reversals and ignoring economic data can make trendline analysis unreliable.
FAQ
Do trendlines work without horizontal support? They can show direction, but horizontal structure adds important context. Is M1 best for trends? Lower timeframes provide detail but also more noise.
TREND STRUCTURE BEFORE A DIAGONAL LINE
An uptrend is commonly expressed by higher swing highs and higher swing lows. A downtrend shows lower highs and lower lows. A trendline can visually organize those swings, but the line's angle depends on chart scale and selected anchors. If price is ranging, a convincing line drawn across small candles might have little predictive value.
HOW TO DRAW A BULLISH OR BEARISH TRENDLINE
For an uptrend, choose at least two well-separated significant higher lows on H1 or H4. Extend the line forward without repeatedly shifting its anchors. For a downtrend, connect lower swing highs. A third meaningful reaction offers context but not certainty. Wick and candle-body methods can produce different boundaries, so treat the line as an area of interest.
VALID BREAK VS TEMPORARY WICK
A wick through a line can indicate short-term volatility rather than trend reversal. Consider whether a completed candle closes beyond the line and whether an important swing low or high has also broken. If a rising trendline breaks but the H4 higher-low sequence remains intact, the move may still be a pullback inside the major uptrend.
RETEST EXAMPLE
Suppose GBP/USD has an H1 uptrend. Price closes below its rising line and a recent meaningful higher low. A subsequent rally retests the underside of the line but fails to regain former support. An M5 lower high and bearish close may strengthen a short-term bearish scenario. Any entry still needs a clear stop beyond structural invalidation and a realistic target.
TRENDLINE WITH SUPPORT AND RESISTANCE
Confluence means multiple independent observations align; it is not a guarantee. A rising trendline meeting H1 demand can focus attention on a possible reaction. If the same area is immediately beneath large H4 supply or a major CPI announcement, the risk context changes. Keep horizontal price structure primary.
TRENDLINE MISTAKES
Do not force the line through candles that do not belong to one swing sequence. Avoid moving anchors after losses. Do not interpret every line break as a CHoCH unless your swing criteria agree. A line without risk management is merely an annotation.
FAQ
How many touches are required? Two anchors can draw a line; more reactions provide context. Does a broken trendline always reverse the market? No. Can M5 and H4 trends conflict? Yes.
TREND DIRECTION IS NOT THE SAME AS TREND STRENGTH
An uptrend is normally identified from successive higher highs and higher lows. But a market can still be moving up while its momentum slows. If successive bullish swings become shorter, pullbacks deepen and candles repeatedly reject the upper range, the trend may be weakening even before an important low breaks. That does not guarantee reversal. Separate the questions "Is price making upward progress?" and "How strong is the latest buying pressure?"
HOW SWING SELECTION CHANGES THE ANALYSIS
A one-minute chart contains many local peaks that disappear when viewed on H4. When drawing an H1 trendline, anchor it to confirmed H1 swing lows rather than random M1 candles. If the same line can be moved substantially by changing zoom level, it may not be a robust trading reference. Use a written swing-definition rule and keep old screenshots for comparisons. A line's apparent accuracy after price has already moved can be an effect of hindsight.
UPTREND, DOWNTREND AND SIDEWAYS MARKET
A rising market makes higher meaningful highs and lows; a falling market makes lower highs and lows. In a range, price may test similar upper and lower boundaries repeatedly without sustained progress. Trendline breakout strategies may struggle in choppy sideways conditions because small breaks are quickly reversed. Identify the regime first, then select a strategy built for that behavior. Do not force every market into a trending label.
TWO-POINT TRENDLINE VERSUS CHANNEL
Two swing lows allow a rising trendline to be drawn. A third reaction may suggest the line is widely observed, but it cannot guarantee the next bounce. A parallel line drawn across opposite swing highs creates a possible trend channel, helping visualize where price is extended within its recent trajectory. Channel boundaries remain estimates; breakout, acceleration or sideways consolidation can invalidate the channel at any time.
WICK BREAK, BODY CLOSE AND BOS
A trendline can be pierced by a wick during an intraday liquidity sweep, then regained by the same candle. A completed close beyond the line suggests a more sustained move, but a market-structure break carries separate information. Suppose an H1 uptrend still holds its last major Higher Low: a trendline break may describe slower momentum rather than full bearish reversal. A meaningful Close below the Higher Low may be the more important change.
A NUMERICAL TRENDLINE EXAMPLE
Imagine GBP/USD forms H1 swing lows at 1.2640, 1.2680 and 1.2710 while highs rise. A trader draws a rising trendline underneath those lows. Price later closes below the line but holds 1.2710 and rebounds. That is a warning about the line, not necessarily a structural reversal. If price instead closes below 1.2710, rallies toward 1.2710 and fails to regain it, the evidence for a bearish structural shift increases. All prices here are illustrative.
TRENDLINE WITH SUPPLY AND DEMAND
A rising trendline that converges with H1 demand may create an area to monitor. Strong displacement from that region plus a completed M5 bullish close can offer confirmation under some models. Conversely, a line entering major H4 Supply may face selling pressure even if the slope remains bullish. Keep horizontal market structure and major macroeconomic releases on the chart planning checklist. Multiple indicators agreeing is not proof that the trade cannot fail.
ENTRY STRATEGY WITH A PULLBACK
First mark the H4 directional structure. Next identify an H1 area where a pullback might end. Draw a line only if confirmed swings support it. Wait for price to reach the region and for a lower-timeframe rejection or CHoCH to complete. Place Stop Loss beyond an actual swing invalidation and choose a realistic target around previous highs or opposing Supply. Calculate volume from the stop distance and planned money loss.
FALSE TRENDLINE BREAKS DURING NEWS
CPI, NFP and FOMC can temporarily increase volatility enough to cross multiple trendlines. Price might then reverse when a revised or conflicting part of the report is understood. A candle breaking a diagonal line during a news spike provides weaker independent information than a structural change confirmed after the market stabilizes. Trading every break without news filters can create unplanned exposure.
BACKTESTING QUESTIONS
How do you choose swing points? Is a wick break enough or must a candle close? Does a retest have to occur? Is a high-impact news window excluded? Is the setup valid in ranges? What timeframe decides the main trend? If these criteria change from screenshot to screenshot, the test does not represent one reproducible strategy.
FAQ
Can a trendline hold five times then fail? Yes. Is a steeper line stronger? Not necessarily; it can be easier to break as momentum normalizes. Can a downtrend produce green engulfing candles? Yes, during pullbacks. Should every trendline break be sold? No. The final decision depends on market structure, confirmation and risk.
CONCLUSION
Use trendlines to organize market behavior, not to replace confirmation, structure or risk management.
PIPSEPAISA FREE COURSES
Sir Sajid Khan Ghori — Free Forex Technical Analysis Course. Want to join? Message the PipSePaisa team on WhatsApp or open the Courses tab at www.pipsepaisa.com for enrollment.
Sir Ghulam Abbas — Free Forex Fundamental Analysis Course. Message on WhatsApp or visit the Courses tab to enroll.
RISK NOTICE
Educational examples are hypothetical; leveraged trading can cause capital loss. Not financial advice.
Read in Roman Urdu
INTRODUCTION
Trendline chart par meaningful swing points connect kar ke price ki direction aur pace show karti hai. Ye koi guaranteed wall nahi. Trend ko samajhne ke liye Higher High, Higher Low, Lower High aur Lower Low bhi dekhein.
1. PEHLE TREND PEHCHANEIN
Uptrend mein aam tor par Higher High aur Higher Low bante hain. Downtrend mein Lower High aur Lower Low. H4/H1 par main structure samjhein, phir lower timeframe dekhein.
2. TRENDLINE KAISE DRAW KAREIN
Bullish trend mein significant higher lows ke neeche line connect karein; bearish trend mein lower highs ko jorein. Kam az kam do meaningful swing points hon. Wick aur close ki wajah se line mein farq aa sakta hai, is liye exact point ki bajaye area samjhein.
3. LINE KI QUALITY
Bohat steep trendline jaldi break ho sakti hai. Check karein kya trendline horizontal zone aur structure ke saath align ho rahi hai. Touches guarantee nahi dete.
4. BREAKOUT EXAMPLE
GBP/USD H1 par higher lows bana raha hai. Agar candle rising line aur recent higher low dono ke neeche close kare, phir retest fail ho, to bullish trend weak ho sakta hai. Sirf wick cross ko final reversal na samjhein.
5. ENTRY AUR SL
Continuation entry par zone se rejection aur candle confirmation dekhein. Reversal mein structural shift confirm karein. SL relevant swing ke beyond aur TP next logical zone par plan karein.
COMMON MISTAKES
Line ko zabardasti fit karna, har wick ko break samajhna aur fundamental news ignore karna.
FAQ
Kya sirf trendline kafi hai? Nahi, structure aur risk plan zaroori hain.
PEHLE TREND STRUCTURE SAMJHEIN
Uptrend mein generally Higher High aur Higher Low bante hain. Downtrend mein Lower High aur Lower Low. Trendline in swings ko visually connect karti hai, lekin trendline ka angle chart zoom aur anchor points se change ho sakta hai. Sideways range ke andar random diagonal line ko major trend na samjhein.
BULLISH AUR BEARISH TRENDLINE
H1/H4 par do meaningful, alag-alag higher lows connect kar ke rising trendline banayein. Bearish ke liye lower highs connect karein. Teesri genuine reaction useful context de sakti hai. Wick aur Body anchors mein farq hota hai; ek method consistently follow karein.
WICK BREAK YA REAL BREAK?
Price trendline ke neeche wick bana kar wapas close kare to ye short-term volatility bhi ho sakti hai. Important ye hai ke candle close hui? Kya previous meaningful Higher Low bhi break hua? Agar H4 bullish structure intact hai, to trendline break sirf pullback ho sakta hai, full reversal nahi.
RETEST EXAMPLE
GBP/USD H1 bullish trend mein hai. Rising trendline aur important Higher Low ke neeche candle close hoti hai. Baad mein price broken line ko neeche se retest kar ke reject ho. M5 Lower High aur bearish close mile to possible bearish setup evaluate kar sakte hain. SL relevant structure ke beyond aur TP realistic support tak plan karein.
SUPPORT/RESISTANCE KE SAATH COMBINE
Agar rising trendline H1 Demand Zone par mil rahi hai to confluence ho sakti hai. Lekin nearby H4 Supply ya CPI/NFP news ho to risk badal sakta hai. Horizontal Market Structure ko trendline se zyada meaningful context dena useful hai.
COMMON MISTAKES
Line ko zabardasti every candle se fit karna, loss ke baad anchors shift karna aur har minor break ko CHoCH kehna avoid karein.
FAQ
Kitne touches? Do anchors line bana sakte hain, teesri reaction context. Har break reversal? Nahi. M5 aur H4 trend different? Haan.
TREND DIRECTION AUR TREND STRENGTH ALAG HAIN
Uptrend mein generally Higher High aur Higher Low ki sequence hoti hai. Lekin agar price abhi upar ja rahi hai to iska matlab ye nahi ke momentum pehle jaisi strong hai. Agar new Bullish Swings chhote ho rahe hon, Pullbacks deep hon aur Upper Side par repeatedly rejection aa rahi ho to trend ki strength weak ho sakti hai. Lekin ye immediate bearish reversal ki guarantee nahi. Do sawal separate rakhein: Market ki current direction kya hai? Aur is direction ka momentum kitna strong hai?
SWING POINTS CONSISTENT KYUN?
M1 par hundreds of chhote Highs/Lows nazar aate hain jo H4 chart par meaningful nahi hote. Agar H1 Trendline draw kar rahe hain to H1 ke important confirmed Swing Lows ya Highs use karein. Zoom badalne se trendline dramatically shift ho jaye to reference weak ho sakta hai. Written rule banayein swing confirm hone ke liye candle close aur surrounding price action ka kya standard hai. Chart move hone se pehle screenshot lena Backtesting ko honest rakhta hai.
UPTREND, DOWNTREND AUR RANGE
Uptrend mein meaningful Higher High/Higher Low, Downtrend mein Lower High/Lower Low. Sideways Range mein price ek Upper Boundary aur Lower Boundary ke darmiyan repeated movement de sakti hai. Ranging market mein Trendline Breakout strategy repeated False Signals de sakti hai. Is liye pehle identify karein market trend mein hai ya range mein, phir us condition ke mutabiq strategy use karein. Har chart par zabardasti bullish ya bearish trendline fit na karein.
DO POINTS AUR TREND CHANNEL
Do meaningful Swing Lows connect kar ke Rising Trendline ban sakti hai. Teesri genuine reaction extra context de sakti hai, guaranteed next bounce nahi. Agar Upper Swing Highs par parallel line draw karein to possible Trend Channel banta hai. Channel ke andar price kis side extended hai, ye visually samajh aa sakta hai. Lekin channel boundaries exact market rules nahi; Breakout ya Strong Momentum channel ko invalidate kar sakta hai.
WICK BREAK VS CANDLE CLOSE VS BOS
Kabhi price trendline ke neeche wick banati hai aur same candle line ke upar close kar deti hai. Ye short-term Sweep ho sakta hai. Completed Close line ke beyond ho to pressure ka zyada clue milta hai. Lekin actual Market Structure break ek alag cheez hai. Agar H1 rising trendline break hui magar last meaningful Higher Low intact hai to full Downtrend reversal assume karna jaldi ho sakta hai. Relevant Higher Low ke neeche decisive Close stronger structural evidence hai.
GBP/USD NUMERICAL EXAMPLE
Maan lein GBP/USD H1 Swing Lows 1.2640, 1.2680 aur 1.2710 banaye aur Highs bhi progressively upar hon. Trader Rising Trendline mark karta hai. Baad mein price line ke neeche close hoti hai lekin 1.2710 hold kar ke rebound de. Ye Trendline warning hai, confirmed complete reversal nahi. Agar H1 price 1.2710 ke neeche close kare, phir usay retest kar ke reject kare to bearish structural shift ki evidence stronger ho sakti hai. Ye numbers live signals nahi.
TRENDLINE AUR SUPPLY/DEMAND
Rising Trendline H1 Demand Zone se intersect ho to confluence ka possible area ho sakta hai. Lekin jab tak M5 bullish close, Rejection ya CHoCH na aaye, sirf intersection Buy guarantee nahi. Agar wahi rising line H4 Supply ke andar pohanch rahi ho to Selling Pressure ka context bhi important hai. Horizontal Structure, News aur Market Trend ko combine karein. Multiple tools ka agree hona guaranteed winning trade nahi.
PULLBACK ENTRY STEP BY STEP
Pehle H4 par main Trend identify karein. H1 par potential Pullback Zone mark karein. Confirmed swings ke basis par Trendline draw karein, sirf aesthetic line nahi. Price zone par aaye to M5/M15 rejection, Engulfing Close ya CHoCH wait karein. SL meaningful swing ke beyond aur TP Previous Swing High ya opposite Supply ke qareeb evaluate karein. Lot Stop Distance aur Dollar Risk se calculate karein.
NEWS KE WAQT FALSE TRENDLINE BREAK
CPI, NFP ya FOMC par volatility suddenly barh sakti hai aur price multiple trendlines cross kar sakti hai. Phir revisions ya Fed interpretation change hone par price reverse bhi ho sakti hai. News Candle ka line cross hona normal post-news structure se different quality ka evidence hai. Agar aapka tested plan News Avoid karta hai to Trendline Breakout ke temptation mein rule mat torein.
BACKTESTING CHECKLIST
Swing Selection ka rule kya? Wick Break count hoti hai ya Candle Close chahiye? Retest mandatory? Major News ke waqt trade allowed? Sideways Market mein setup valid? H4 bias follow karna hai ya H1? Jab criteria every trade mein consistent honge tab result meaningful hoga. Sirf hindsight screenshot se profitable strategy prove nahi hoti.
FAQ
Paanch successful touches ke baad line fail? Haan. Steep Trendline automatically strong? Nahi. Downtrend mein Bullish Engulfing candle? Pullback mein possible. Har Trendline Break par Sell? Nahi. Market Structure + Confirmation + Risk Management ko priority dein.
TRENDLINE KO RETEST KE SAATH ANALYZE KAREIN
Line break ke baad turant Sell karna aur retest ka wait karna different strategies hain. Agar H1 Rising Trendline break hui, phir price old line ke neeche Lower High banaye aur important H1 Higher Low bhi break kare, to bearish pressure ka context stronger ho sakta hai. Lekin agar price line reclaim kar le aur H4 Structure bullish intact ho to original reversal idea weak ho sakta hai. Ek Small M5 Wick aur Major H1 Swing Break ko equal importance na dein.
TRENDLINE BACKTEST
Har setup mein Trendline ke Anchor Points, Swing Timeframe, Third Touch, Break Candle Close, Retest aur SL level note karein. Kya Line H1 Demand/Supply se intersect thi? Kya High Impact News aayi? Trendline se entry ka exact trigger kya tha? In details se strategy reproducible banegi aur hindsight drawing errors kam honge.
CONCLUSION
Trendline ek visual tool hai; confirmation aur risk management usay practical analysis mein badalte hain.
PIPSEPAISA FREE COURSES
Sir Sajid Khan Ghori ka Free Forex Technical Analysis Course join karne ke liye WhatsApp par message karein ya www.pipsepaisa.com ke Courses tab par enroll karein.
Sir Ghulam Abbas ke Free Forex Fundamental Analysis Course ke liye bhi WhatsApp ya Courses tab use karein.
DISCLAIMER
Examples sirf education ke liye hain, live signals nahi. Leveraged trading mein loss ho sakta hai.
Educational content only. Trading involves risk. Always use independent analysis and appropriate risk management.