
Pin Bar Candlestick Strategy: Rejection Wicks, Location and Entry Confirmation
PipSePaisa • Forex Education & Research
INTRODUCTION
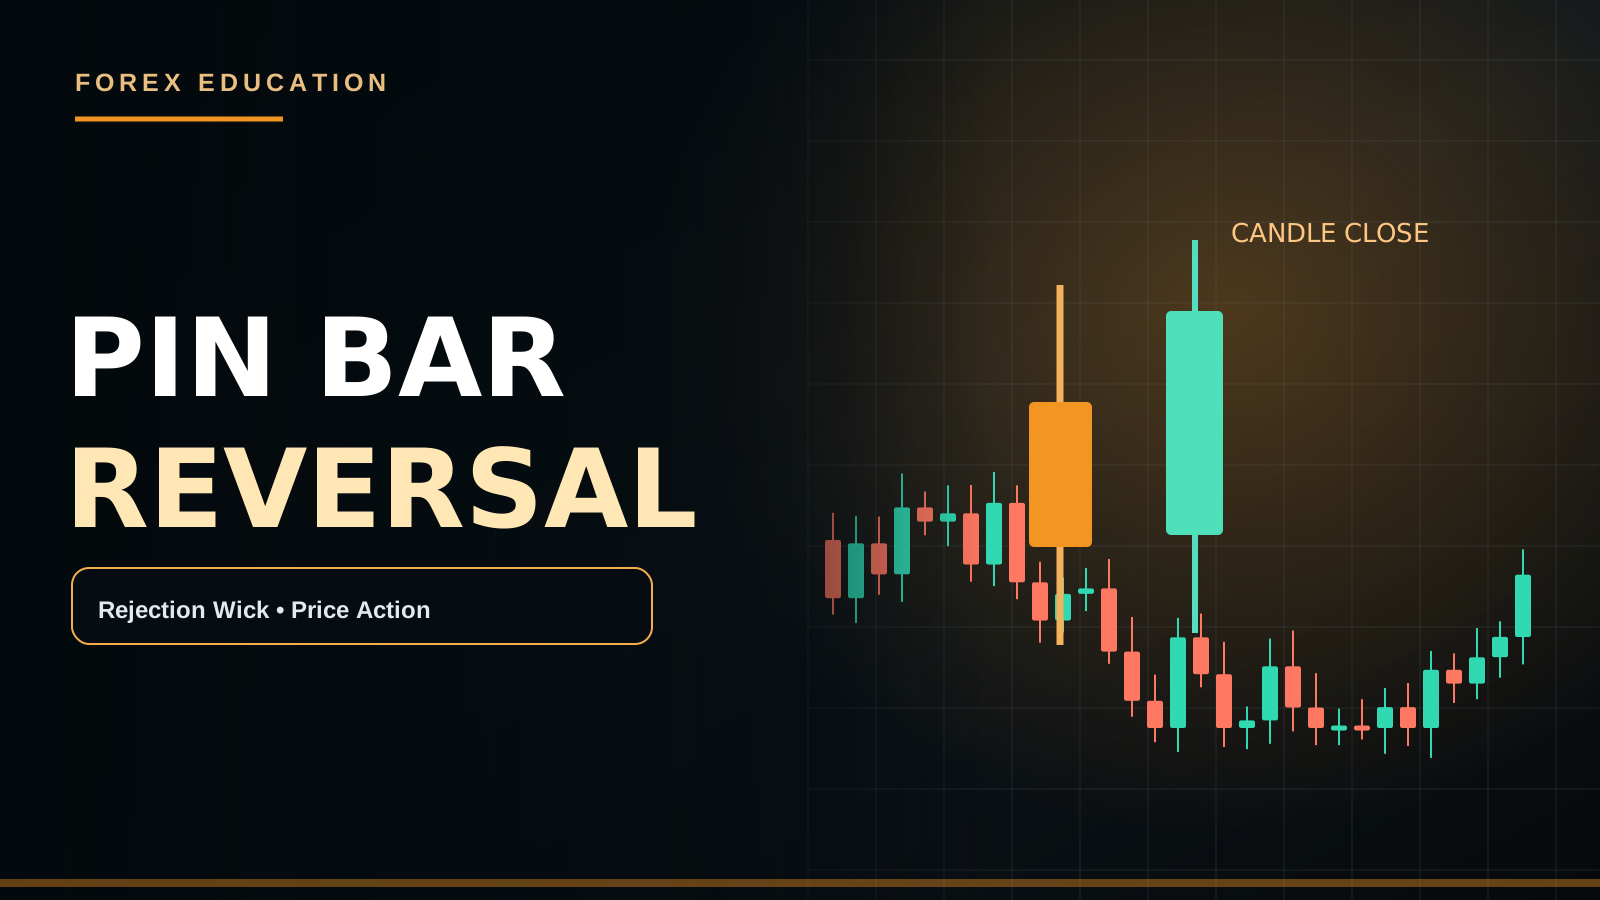
A Pin Bar has a relatively small real body with one prominent wick, suggesting that price explored a level and returned. The wick reflects the price path, not definitive proof of manipulation or an institutional order block.
PRACTICAL MARKET EXAMPLE
If EUR/USD forms a long lower wick into H1 Demand, buyers may have reacted, but entering before the bar closes risks mistaking a still-forming candle for a confirmed Pin Bar.
IMPORTANT LIMITATIONS
A rejection wick at the middle of a range carries different context from one at an important H4 swing extreme.
THE ANATOMY OF A PIN BAR
A Pin Bar is a candle with a relatively small real body and one conspicuously long wick. The longer wick indicates that price traded farther in one direction during the bar but finished closer to the opposite end. It can therefore show rejection of a price excursion. However, that does not reveal the identities or exact motives of market participants. The shape is an observable historical result, not proof of a deliberate Stop Hunt by a particular bank.
BULLISH AND BEARISH VERSIONS
A bullish rejection-style Pin Bar typically has a long lower wick and a body closer to the upper range. A bearish version has a prominent upper wick and a body nearer the lower range. Some educators require wick length at least twice the body, while others add restrictions about the opposite wick or exact closing position. There is no universal official exchange definition. Choose an objective proportion and apply it consistently. A candle with a tiny body and two long wicks may be better classified as indecision.
WICK LENGTH RELATIVE TO VOLATILITY
A ten-pip wick can be significant on a quiet EUR/USD M5 session and almost meaningless during a high-volatility news candle. Therefore wick proportion and absolute price range should both be interpreted relative to the chart's conditions. ATR can provide a context for typical candle range, though the indicator itself does not confirm reversal. A very large Pin Bar may require a Stop Loss so wide that realistic target space becomes unattractive.
WHY LOCATION CHANGES THE SIGNAL
A bullish Pin Bar at a previously defended H1 Demand Zone is different from one appearing randomly in the middle of a strong H4 downtrend. A bearish Pin Bar near H4 Supply or Previous Day High may offer a more coherent reversal observation than one inside a quiet range midpoint. Horizontal Support/Resistance and swing structure show where price previously reacted. The Pin Bar supplies a possible sign of recent rejection, not an unconditional directional instruction.
THE ROLE OF CANDLE CLOSE
On a forming M5 candle, a long lower wick can develop during the first minutes and disappear into a full bearish body by the close. A trader who labels it a confirmed bullish Pin Bar before the five-minute interval ends is acting on incomplete information. The completed body location and wick length are necessary for a close-based pattern. Waiting for the bar to finish is a rule, not a guarantee that it will win.
A EUR/USD BULLISH PIN BAR EXAMPLE
Suppose EUR/USD H4 structure remains bullish and price returns into H1 Demand around 1.1020–1.1030. M15 forms a long lower wick that dips below the zone but closes back inside. The trader then waits for M5 to break a local lower high with a completed bullish engulfing. This could support a continuation Buy if Stop Loss beneath the meaningful rejection low fits the risk budget. Nearby H1 Supply still determines how far a realistic target might be.
A GBP/USD BEARISH PIN BAR EXAMPLE
GBP/USD is in a bearish H4 trend and rallies into H1 Supply. M15 prints a long upper wick and closes near its lower end, suggesting rejection of higher prices. A trader might wait for M5 Lower High and a bearish candle close below local Support before considering Sell. But if the Bank of England unexpectedly changes policy guidance, the price can rise through the Pin Bar high. Structural invalidation and macroeconomic context matter more than the wick alone.
A GOLD PIN BAR NUMERICAL CASE
Hypothetically, Gold has an M15 candle High $2530, Low $2510, Open $2526 and Close $2520. Its upper wick from the body top to High is $4, and its lower wick extends from the body bottom to Low by $10. That gives a comparatively larger lower wick, although different definitions may not call the candle a textbook Pin Bar because the body is still substantial. Instead of forcing labels, calculate the actual body and wick dimensions and follow the written threshold.
PIN BAR VERSUS HAMMER AND SHOOTING STAR
Hammer and Shooting Star patterns also emphasize a long wick and smaller real body. Traders often use the terms differently depending on whether the candle appears after a downtrend or an uptrend. A long lower-wick candle at H1 Demand can be called a bullish rejection or Hammer, while an upper-wick candle near Supply may resemble a Shooting Star. The important information is price context, the completed candle shape and the next structural behavior, not which popular name sounds stronger.
ENTRY AT THE WICK OR AFTER BREAKOUT
An aggressive Buy Limit near the lower wick attempts to enter during rejection, possibly before the candle completes. A conservative trader may wait for the next candle to break the Pin Bar high with a completed close. These strategies have different entry prices, invalidation distances and failure rates. A next-bar breakout strategy can avoid some weak rejection attempts but enter late. Choose one method before evaluating history; do not mix the best historical timing from each approach.
STOP LOSS BEYOND THE REJECTION
A bullish Pin Bar's low can serve as a possible structural invalidation reference if the entry thesis depends on that rejection holding. A bearish Pin Bar may use its high. But placing Stop Loss exactly at the wick tip without accounting for spread and broker trigger mechanics may be too sensitive. Additional buffer rules should be tested, not invented after price moves against the trade. Calculate Lot Size using actual money risk and price distance.
FAKE REJECTIONS AND CONTINUATION
A long upper wick during a strong bullish breakout can reflect temporary profit-taking rather than a durable Sell signal. Similarly, a lower wick in a powerful downtrend may simply be a brief bounce. The next candle can continue in the original direction and invalidate the reversal hypothesis. A Stop Loss hit after a valid Pin Bar is not necessarily manipulation. The pattern should be judged over a series of trades with consistent rules and realistic costs.
H4, H1, M15 AND M5 HIERARCHY
H4 identifies trend and major Supply/Demand. H1 provides the location where a reaction could matter. M15 can show a completed Pin Bar, and M5 can refine entry through Engulfing, Higher Low/Lower High or CHoCH. If the entry timeframe is M5, the M15 candle must first be completed for a model requiring M15 confirmation. Mixing unfinished higher-timeframe candles with lower-timeframe triggers can create false confidence.
PIN BARS DURING ECONOMIC EVENTS
CPI, NFP and FOMC can produce long wicks in both directions due to rapid repricing and uneven liquidity. A visually dramatic Pin Bar during a news release may carry higher slippage and spread risk than one during a quiet confirmed retest. If the strategy avoids high-impact event windows, do not abandon that restriction when a large wick appears. The macroeconomic reason for movement may matter more than the candle's isolated shape.
HOW TO BACKTEST PIN BAR STRATEGIES
Fix the wick-to-body requirement, total range threshold, timeframe, H4 trend, H1 zone, opposite wick limits, close position, entry method, Stop Loss and target. Record all qualifying patterns, including those that immediately fail. Note whether the bar occurred at Demand, Supply or Range Middle, and compare those groups. Include transaction costs and actual execution prices. A collection of best-looking rejection candles does not establish net profitability.
PIN BAR FAQ
Does every long wick mean reversal? No. Can a candle look like a Pin Bar before close and change? Yes. Is a Hammer always a Buy? No. Can rejection fail after correct confirmation? Yes. Should a trader move SL farther away because a wick looks institutional? No. Is higher-timeframe context useful? Yes. No Confirmation = No Trade is the discipline, not a profit guarantee.
THE DIFFERENCE BETWEEN REJECTION AND ACCEPTANCE
A long wick shows price could not maintain the extreme during that completed bar, but it does not establish how future participants will value the area. Some technical approaches ask whether the next two or three candles actually hold beyond the wick midpoint or reclaim a nearby swing level. A candle closing beyond the Pin Bar's high after a bullish rejection can add information, but the confirmation may be late. A strategy should state which follow-through is required and which subsequent price action invalidates the rejection thesis.
AVOIDING OVERCONFIDENCE FROM A PERFECT CANDLE
A visually exceptional lower-wick Pin Bar that forms immediately before an NFP release may be less useful than a less dramatic candle in a calm H1 demand retest, because the information environment and execution costs differ. Traders can improve their process by assessing volatility, event timing and target room before deciding whether a beautiful textbook candle deserves any trade. Do not treat the apparent precision of a screenshot as evidence of future certainty.
PIPSEPAISA FREE COURSES
For structured technical analysis education, explore the Free Forex Technical Analysis Course with Sir Sajid Khan Ghori. To understand the economic context behind Forex and Gold, explore the Free Forex Fundamental Analysis Course with Sir Ghulam Abbas. Visit www.pipsepaisa.com and select Courses for enrollment instructions. Courses and trading content cannot guarantee profit.
RISK DISCLAIMER
This is for education only. No indicator, chart pattern or economic release guarantees a trading outcome. Always calculate potential account loss, consider spreads and slippage, and wait for completed confirmation before trading.
Read in Roman Urdu
INTRODUCTION
Pin Bar ki Body relatively small aur ek Wick prominent hoti hai. Price ne level test kar ke return diya, ye context milta hai; institutional manipulation ka guaranteed proof nahi.
PRACTICAL EXAMPLE
EUR/USD H1 Demand par Long Lower Wick banaye to Bullish Reaction possible hai, lekin Candle Close se pehle Entry Early Signal ho sakta hai.
LIMITATIONS
Range Middle mein Pin Bar aur H4 Swing Low par Pin Bar ki quality same nahi.
PIN BAR KI ANATOMY
Pin Bar ek Candle hai jisme Real Body relatively small aur ek Wick prominently long hoti hai. Long Wick indicate karti hai ke Price ne ek Direction mein further trade kiya lekin Candle opposite end ke qareeb finish hui. Ye Rejection ka visible clue ho sakta hai. Lekin is se exact Bank Identity ya intentional Stop Hunting prove nahi hoti. Candle Historical Price Behavior show karti hai, future certain reversal nahi.
BULLISH AUR BEARISH PIN BAR
Bullish Rejection Pin Bar mein Long Lower Wick aur Body Upper Side ke qareeb hoti hai. Bearish Pin Bar mein Long Upper Wick aur Body Lower Side ke qareeb. Kuch Educators Wick minimum 2× Body require karte hain, kuch opposite wick ka size aur candle-close position bhi. Universal Exchange Definition nahi. Apna Wick/Body Ratio fix karein. Agar Candle ki dono Wicks long aur Body tiny hai to Doji/Indecision Interpretation bhi possible hai.
WICK SIZE AUR VOLATILITY
EUR/USD Quiet M5 Session mein 10-Pip Wick meaningful ho sakti hai, magar NFP News Candle par 10 Pips normal Noise ho sakti hain. Wick-to-Body Ratio aur Total Candle Range ko Current Volatility ke context mein samjhein. ATR recent average movement ka reference de sakta hai. Bohat Large Pin Bar ka Structural SL wide aur Nearest TP close ho to Risk/Reward poor. Perfect-looking Wick har price par valid entry nahi.
LOCATION KYUN IMPORTANT?
H1 Demand par Bullish Pin Bar ka context Strong H4 Downtrend ke middle mein random Lower Wick se different hai. H4 Supply/Previous Day High ke qareeb Bearish Rejection observation useful ho sakti hai. Horizontal Support/Resistance, Swing High/Low aur Economic News ko combine karein. Candle Wick possible Reaction show karti hai, guaranteed Big Reversal nahi. M5 Confirmation ke baghair First Touch Trade aggressive speculation ho sakti hai.
M5 CANDLE CLOSE WAIT
Open M5 Candle par long Lower Wick appear ho sakti hai, magar last minute mein Price phir neeche fall kare aur Candle full Bearish Body ban jaye. Is liye Close-Based Pin Bar Model mein unfinished Candle ko confirmed signal na samjhein. Final Body Position aur Wick-to-Body Ratio complete hone ke baad evaluate karein. M5 Close ka wait disciplined filter hai, guaranteed winning trade ka promise nahi.
EUR/USD BUY EXAMPLE
EUR/USD H4 Bullish Structure mein hai aur H1 Demand 1.1020–1.1030 ke area mein Price Pullback karti hai. M15 Candle Demand ke neeche Wick de kar Zone ke andar close karti hai. M5 local Lower High break kar ke completed Bullish Engulfing de to possible Buy Continuation. SL meaningful rejection Low ke beyond aur Lot Dollar Risk ke mutabiq. H1 Supply qareeb ho to expected Target Space limited ho sakti hai.
GBP/USD SELL EXAMPLE
GBP/USD H4 Downtrend mein H1 Supply tak Rally karti hai. M15 Upper Wick long aur Body Lower End ke qareeb close ho. Ye possible bearish rejection show karti hai. M5 Lower High aur Bearish Candle local Support ke neeche complete close kare to Sell evaluate. Lekin unexpected BoE Policy Guidance GBP ko Supply ke upar bhi push kar sakti hai. Pin Bar new Fundamental Information ko cancel nahi karti.
GOLD NUMERICAL CANDLE
Gold M15 High $2530, Low $2510, Open $2526 aur Close $2520 maan lein. Upper Wick Body Top $2526 se High $2530 tak $4. Lower Wick Body Bottom $2520 se $2510 tak $10. Lower Wick comparatively large hai, lekin Body bhi $6 hai. Agar Strategy Wick minimum 2× Body demand karti hai to ye exact Pin Bar Rule meet nahi karegi. Har Candle ko force karke Pattern label na dein. Actual Dimensions calculate karein.
PIN BAR VS HAMMER/SHOOTING STAR
Hammer aur Shooting Star bhi small Body plus Long Wick Shapes describe karte hain. Trend Context ke mutabiq Names use hotay hain. H1 Demand par Long Lower Wick Hammer/Bullish Rejection, H1 Supply par Upper Wick Shooting Star/Bearish Rejection ho sakti hai. Lekin Naam se zyada Timeframe, Price Location, Completed Close aur Structural Follow-Through important hai. Isliye 'Shooting Star = Sell now' universal Rule nahi.
WICK ENTRY VS NEXT CANDLE BREAK
Aggressive Buy Limit lower wick ke qareeb attempt kar sakti hai jab candle abhi complete nahi. Conservative Model next Candle Pin Bar High ke upar complete close ka wait kar sakta hai. First Model earlier Price de sakta hai magar False Rejection fills possible. Second Model late Entry aur Wider Stop de sakta hai. Both Strategies ke Win Rate, Net R aur Stop Distances independently compare karein. Winner dekh kar retroactive method change na karein.
STOP LOSS PIN BAR EXTREME
Bullish Pin Bar mein SL meaningful Lower Wick/Rejection Extreme ke below reference ho sakta hai, Bearish mein Upper Wick High. Lekin Spread aur Broker Trigger Rules ke bawajood exact tip par Stop normal Noise se hit ho sakta hai. Tested Small Buffer use ho sakta hai; trade against jaane ke baad arbitrary SL wide na karein. Entry Price se Stop Distance nikaal kar Equity Risk se Lot calculate karein.
FAKE REJECTION
Strong Uptrend ke waqt Upper Wick temporary Profit Taking show kar sakti hai, durable Sell nahi. Strong Downtrend mein Lower Wick temporary Bounce ho sakti hai, full Bullish Reversal nahi. Subsequent Candle original Trend continue kar sakti hai. Valid Pin Bar SL hit hone ka matlab guaranteed Institutional Manipulation nahi. Candlestick Strategy ko consistent sample, costs aur Risk Management se judge karein.
H4 H1 M15 M5
H4 Trend/Primary Zones, H1 Location, M15 Completed Pin Bar aur M5 Entry Trigger ki hierarchy rakhein. Agar Model M15 Close demand karta hai to M15 Candle open hote waqt M5 Green Reaction par early Buy confirmed nahi. M5 CHoCH, Higher Low ya Engulfing Close use karein. Structural Stop aur Target Space check karein. Multiple Timeframe Signals underlying same Price reflect kar sakti hain, guaranteed independent confirmations nahi.
CPI NFP LONG WICKS
CPI, NFP aur FOMC par rapid Price Repricing se Upper/Lower long Wicks ban sakti hain. Spread Wide, Slippage aur temporary Liquidity Thin ho sakti hai. News Candle ka dramatic Pin Bar normal H1 Retest ke Pin Bar se different execution environment mein hota hai. Agar News Avoid Rule hai to badi Wick dekh kar exception na banayein. Report Actual/Forecast aur DXY/Yields Reaction bhi relevant hain.
PIN BAR BACKTEST
Wick-to-Body Ratio, Candle Range, Opposite Wick Limit, H4 Trend, H1 Level, M15 Close, M5 Confirmation, Entry Type, Structural SL, TP aur News Filter pehle define karein. Har Qualified Pattern record karein. H1 Demand vs Range Middle performance compare karein. Broker Costs aur Slippage include karein. Sirf best historical Pin Bars ki gallery Positive Trading Edge ka proof nahi.
FAQ
Har Long Wick Reversal? Nahi. Open Candle Pin Bar change? Haan. Hammer Always Buy? Nahi. Confirmed Setup Loss? Haan. Wick Institutional guaranteed? Nahi. H4 Context important? Haan. No Confirmation = No Trade.
REJECTION AUR ACCEPTANCE KA FARQ
Pin Bar ki Long Wick indicate karti hai ke us bar ke andar Price Extreme hold nahi kar payi. Lekin Future Traders us level ko reject ya accept karenge, guaranteed nahi. Kuch Methods next 2–3 Candles mein Price Pin Bar High/Low ke relation ko observe karti hain. Bullish Pin Bar ke baad next Candle High ke upar complete close kare to additional confirmation mil sakti hai. Lekin Entry Late bhi ho sakti hai. Price lower reject area decisively break kare to Bullish Thesis invalid. Written Entry aur Invalidation Rules pehle decide karein.
DOLLAR RISK EXAMPLE
EUR/USD Bullish Pin Bar ka Low 1.1000 aur proposed Buy Entry 1.1025 ho to Stop exactly Low par 25 Pips distance hai, additional Buffer aur Spread se pehle. Agar Account Equity $2,000 aur chosen Risk 0.5% yani $10 hai to desired Pip Value $10/25 = $0.40, typical USD EUR/USD Account mein approximately 0.04 Lot. Lekin Broker Lot Steps aur Fees check karein. Wick jitni long ho, Stop Distance utni wide ho sakti hai. Perfect Rejection dekh kar fixed large Lot mat lagayein.
PREVIOUS DAY HIGH LOW REACTIONS
Previous Day High ke upar Long Upper Wick bane to potential Buy-Side Sweep/Rejection discuss ho sakti hai. Previous Day Low ke neeche Long Lower Wick possible Sell-Side Sweep. Lekin Wick se exact Stop Orders ka world-wide count ya Institutional Manipulation prove nahi. Candle Close, H1 Structure aur M5 Confirmation observe karein. Agar Previous Day High strong Breakout ke baad Support act kare to Reversal Sell model fail ho sakta hai. Opposite scenarios bhi plan karein.
PIN BAR PRACTICE
M15 Chart se 30 consecutive Pin Bar Candidates select karein. Wick/Body Ratio, H1 Location, H4 Trend, Candle Range, Spread, News Window, M5 Follow-through, Entry, SL, TP aur Actual Net R record karein. Demand par Pin Bars aur Range Middle Pin Bars ki separate performance compare karein. Jo Patterns fail hon unhein screenshot gallery se delete na karein. Ek perfect visual Candle statistically reliable system ka proof nahi. No Confirmation = No Trade.
PIPSEPAISA FREE COURSES
Sir Sajid Khan Ghori ke Free Forex Technical Analysis Course mein Price Action, Market Structure aur Confirmation seekhein. Sir Ghulam Abbas ke Free Forex Fundamental Analysis Course mein Gold aur Forex ke Economic Data ka concept samjhein. www.pipsepaisa.com par Courses Tab se Enrollment Instructions check karein. Course Profit ki guarantee nahi.
DISCLAIMER
Ye sirf educational content hai. Koi Indicator, Pattern ya News guaranteed signal nahi. Structural Stop Loss, Account Risk, Spread aur Completed M5 Confirmation ka wait karein. No Confirmation = No Trade.
Educational content only. Trading involves risk. Always use independent analysis and appropriate risk management.