
Fibonacci Retracement in Forex: 38.2%, 50%, 61.8% Levels and Price Action Confluence
PipSePaisa • Forex Education & Research
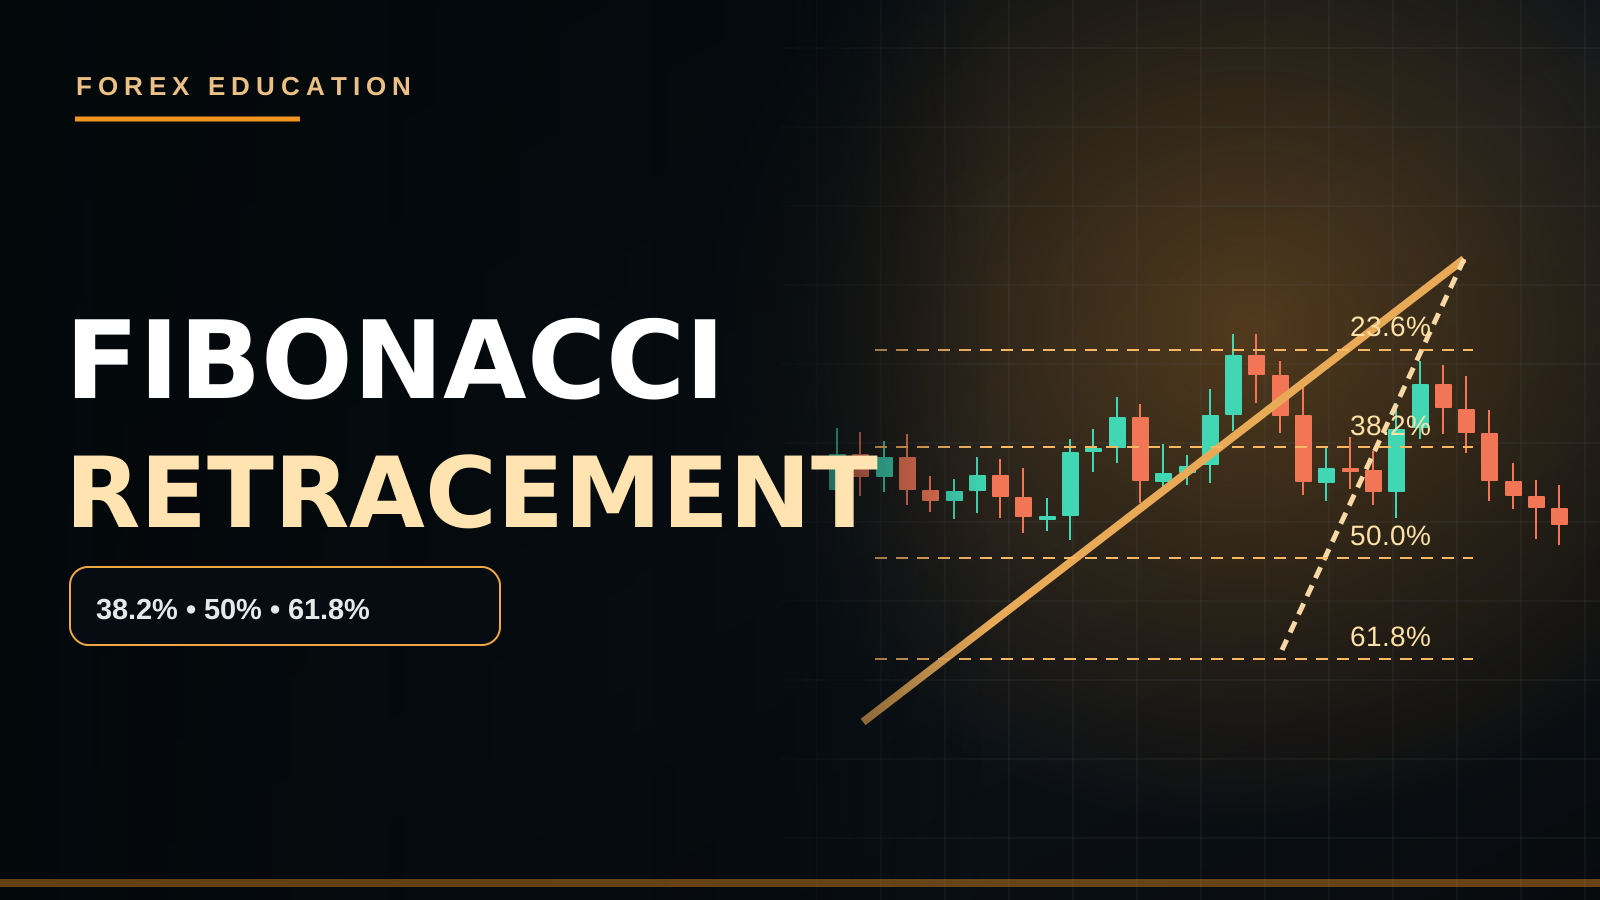
INTRODUCTION — FIBONACCI AS A MEASURING TOOL
Fibonacci Retracement helps traders visualize how far price has moved back into a prior directional swing. Charting platforms typically offer reference percentages such as 23.6%, 38.2%, 50%, 61.8% and 78.6%. Those lines are mathematically calculated from the selected high and low, but they are not hard barriers in the marketplace. The useful questions are which swing was selected, whether the market is trending, what nearby Supply/Demand exists, how confirmation is defined and where the scenario becomes invalid.
FIBONACCI RATIOS AND THE 50% LEVEL
Fibonacci-related percentages are associated with ratios between numbers in the Fibonacci sequence. For instance, 61.8% is linked to the reciprocal of the golden ratio, while 38.2% and 23.6% are related derived ratios. The commonly displayed 50% retracement is a practical midpoint, not a Fibonacci-sequence ratio in the strict sense. Many charting tools include it because half of a prior move can be a psychologically and geometrically convenient reference.
SELECT A MEANINGFUL SWING
Suppose EUR/USD makes a sustained H1 rise from a confirmed swing low to a significant swing high. Retracement is measured within that completed upward leg, rather than a random pair of M1 wicks. If a trader changes the anchors after seeing whether price bounced, the historical example becomes misleading. Different swing scales produce different Fibonacci lines. Document the timeframe, start price, end price and reason each anchor qualifies as meaningful.
DRAWING AN UPTREND RETRACEMENT
A common bullish method anchors the Fibonacci tool from the relevant swing low to swing high. The retracement lines indicate how far price has pulled back from the high. In a typical tool, a 38.2% retracement means the pullback has surrendered 38.2% of the prior upward distance. Confirm your platform's drawing direction and settings; some charting tools label zero and one in the reverse visual orientation. The calculation matters more than where the labels happen to appear.
DRAWING A DOWNTREND RETRACEMENT
For a bearish impulse, draw from the selected swing high down to the confirmed swing low according to the tool's conventions. An upward rebound toward 50% or 61.8% describes the portion of the fall that price has regained. Traders sometimes monitor those areas alongside H1 Supply or a prior Lower High. However, a strong rally above the retracement region can indicate that sellers have lost control. Fibonacci is a measurement of a past move, not proof of future resistance.
EXACT BULLISH NUMERICAL EXAMPLE
Suppose a swing rises from 1.1000 to 1.1100, a distance of 100 pips. A 38.2% pullback from the high gives approximately 1.10618. A 50% pullback is 1.1050. A 61.8% pullback is 1.10382. These are not guaranteed turning points. They simply map percentages of the original 100-pip move. Spread, chart precision and broker execution conditions mean an exact Buy at the theoretical decimal may not be practical.
EXACT BEARISH NUMERICAL EXAMPLE
Imagine GBP/USD falls from 1.2800 to 1.2700, a 100-pip decline. A 38.2% upward retracement from the bottom is 1.27382, 50% is 1.2750 and 61.8% is 1.27618. If H1 Supply lies around 1.2750–1.2770, the 50% and 61.8% levels fall inside the broader supply band. This may be an area to observe for bearish price action, not an automatic Sell order.
THE SO-CALLED GOLDEN ZONE
Some traders call the area around 61.8% or 50%–61.8% the Golden Zone, and others prefer a wider band including 78.6%. Terminology varies by educational framework. Nothing in Fibonacci mathematics guarantees that Gold, EUR/USD or Bitcoin must reverse from those lines. A level may align with visible structure or may lie in empty price space. Test the exact zone definition before attributing special accuracy to it.
FIBONACCI WITH MARKET STRUCTURE
In a clear H4 uptrend, an H1 pullback into a previously defended higher-low area may overlap a 50% Fibonacci line. That convergence can create a meaningful observation zone. But if price breaks the significant H4 higher low and closes well beneath previous demand, the bullish thesis may be weak even though the 61.8% line remains on screen. Treat swing structure as real historical price behavior; treat Fibonacci as its proportional annotation.
SUPPLY, DEMAND AND ORDER BLOCKS
A Fibonacci percentage becomes more relevant for some strategies when it aligns with independently marked H1 Demand, Supply, or an Order Block origin that preceded displacement. Draw these zones before checking whether Fibonacci lands there to reduce confirmation bias. If you move the Demand band after applying Fibonacci, the apparent confluence may be artificially created. A genuine setup needs independently testable definitions.
ENTRY CONFIRMATION AFTER PRICE ARRIVES
A practical bullish model might require H4 uptrend, completed H1 swing, pullback into a predefined 50%–61.8% region overlapping Demand, and then a completed M5 bullish engulfing or bullish CHoCH. If price drops into the region without any reaction, the entry condition has not occurred. For bearish setups use equivalent lower highs, Supply, and bearish confirmation. A limit order on the first touch is a different strategy with different risks.
STOP LOSS VS THE FIBONACCI LEVEL
Placing Stop Loss exactly one pip beyond 61.8% is arbitrary unless the level corresponds to genuine structural invalidation under a tested method. A technical stop may belong beneath the meaningful swing low or below the confirmed rejection extreme. That distance determines how much volume can be traded for a given account-risk budget. If the stop needs forty pips and the target is only twenty, the setup may be unattractive despite ideal numerical confluence.
FIBONACCI EXTENSION VS RETRACEMENT
Retracement levels measure pullbacks within a previous impulse. Extension or projection tools estimate price objectives beyond a reference swing using particular ratios. Extensions can help visualize scenarios but do not guarantee targets. If the next opposing H4 Supply comes before a projected 161.8% extension, a trader should not ignore the actual historical barrier merely because the extension line is farther away.
COMMON ANCHORING ERRORS
Frequent mistakes include drawing on an unfinished swing, shifting anchors after price reacts, mixing M1 and H4 extremes indiscriminately, assuming the 50% is a mathematically pure Fibonacci ratio, and trading every 61.8% touch. Another problem is drawing so many retracements that nearly every price falls on some line. A reproducible process uses a small number of justified major swings and clearly defined conditions.
HOW TO DRAW FIBONACCI WITHOUT HINDSIGHT
One helpful exercise is to hide all candles after a chosen date, identify the latest confirmed H1 swing high and swing low, and draw the retracement before revealing later price action. Save the screenshot with anchors visible. Then advance the chart and record whether a trade according to your confirmation rules occurred. This prevents the temptation to pick whichever small wick makes a 61.8% line touch the eventual turning point. If the swing was not actually confirmed at the observation time, classify it separately rather than treating the perfectly selected anchor as obvious.
A WIDE RETRACEMENT ZONE VS A SINGLE LINE
A 100-pip EUR/USD advance from 1.1000 to 1.1100 creates a 50% retracement at 1.1050 and 61.8% near 1.10382. These levels form a band about 11.8 pips wide. If a trader also marks H1 Demand at 1.1040–1.1055, the zone overlaps part of that band. A first-touch entry at 1.1050 and a confirmed M5 entry after a bounce at 1.1060 are different positions with different stops and reward distances. Specify whether the strategy requires overlap with the full Fibonacci band or any single chosen line.
FIBONACCI IN A SIDEWAYS MARKET
When H1 has no clear directional impulse and price oscillates between similar highs and lows, selecting a single trend leg can be arbitrary. Every correction within the range generates another set of Fibonacci lines. A trader may find numerous false impressions of confluence simply because enough ratios are drawn. Some systems therefore require a confirmed BOS or displacement before drawing the retracement. If structure is unclear, it can be better to mark the actual range boundaries and stand aside from a trend-continuation Fibonacci model.
MULTI-TIMEFRAME CONFLUENCE
Suppose H4 confirms a larger bullish trend while H1 displays a recent upward impulse. A trader might draw H1 Fibonacci on the completed H1 leg and separately mark the H4 Demand area. If the 50% H1 retracement overlaps H4 support and M5 produces a completed bullish structure shift, that creates a coherent location, trigger and higher-timeframe backdrop. But H4 and H1 Fibonacci lines themselves are price-derived measurements, not independent institutional confirmations. The plan should state which chart determines the main swing and which one only refines entry.
FIBONACCI INVALIDATION AND A FAILED SETUP
Suppose price approaches the 61.8% retracement in a bullish H1 scenario. M5 fails to produce bullish confirmation, and an H1 candle closes below the previous significant swing low. The structure supporting the continuation idea may now be invalid. Keeping the Buy Limit active merely because the Fibonacci line exists ignores fresh price information. Cancel stale pending orders, reassess the market regime and avoid moving stop orders to preserve an old thesis. A failed setup is normal and does not mean Fibonacci mathematics malfunctioned.
MEASURING A FIBONACCI STRATEGY
In your journal record the anchor timeframe and exact prices, retracement band, trend condition, independent demand/supply, order type, confirmation candle, stop distance, target and net R multiple. Count every valid setup even when the market misses the level or the trigger never confirms. Compare a 50%–61.8% system with an ordinary Demand-Zone model using similar rules. If the extra Fibonacci condition only reduces opportunities without improving risk-adjusted net results, additional complexity may not be worth keeping.
PIPSEPAISA FREE COURSES
Learn price action, market structure, support/resistance and technical tools with Sir Sajid Khan Ghori in the Free Forex Technical Analysis Course. Build understanding of the economic conditions driving Gold and Forex with Sir Ghulam Abbas in the Free Forex Fundamental Analysis Course. Check enrollment through the Courses tab at www.pipsepaisa.com.
CONCLUSION AND DISCLAIMER
Fibonacci lines are proportional references for a past swing, not automatic institutional buying or selling locations. Select meaningful anchors, check market structure and independent zones, wait for completed price confirmation and calculate risk from structural invalidation. No Confirmation = No Trade. This guide is for education and is not individual financial advice. Leveraged markets can cause losses.
Read in Roman Urdu
INTRODUCTION — FIBONACCI RETRACEMENT KYA HAI?
Fibonacci Retracement ek Chart Tool hai jo previous directional Price Swing ke andar Pullback kitne percent hua, ye visually show karta hai. Common Levels 23.6%, 38.2%, 50%, 61.8% aur 78.6% hain. Chart par ye lines exact mathematical measurement hoti hain, lekin Market mein automatic Support/Resistance Walls nahi. Actual Question hai: kaunsa Swing select hua? H4 Trend kya hai? H1 Demand/Supply kahan hai? Kya M5 Confirmation mili? Stop Loss aur Reward Space sensible hain ya nahi?
FIBONACCI RATIOS KAHAN SE AATE HAIN?
Fibonacci Number Sequence ke consecutive numbers ki Relationships se kuch famous Ratios derive hotay hain. Golden Ratio ka inverse roughly 61.8% hota hai. 38.2% aur 23.6% related mathematical ratios hain. Common 50% Retracement ek Halfway Price Level hai, strictly Fibonacci Sequence se direct ratio nahi. Phir bhi traders isay use karte hain kyun ke half of previous price movement ek intuitive reference hai. Ye historical mathematical percentages hain, future reversal ki guarantee nahi.
MEANINGFUL SWING SELECT KAREIN
EUR/USD H1 par pehle confirmed Swing Low se significant Swing High tak strong bullish leg banaye. Fibonacci ko us meaningful complete leg par draw karein, random M1 Wicks ko mix na karein. Different Timeframes aur Anchor Points se different Levels banenge. Jab price bounce ho chuki ho to Anchors shift karke perfect 61.8% Reaction show karna Hindsight Bias hai. Journal mein Start Price, End Price, Timeframe aur Swing Selection ka rule likhein.
BULLISH FIBONACCI KAISE DRAW KAREIN?
Uptrend Retracement mein commonly selected Swing Low se Swing High tak tool drag karte hain. Uske baad Price High se kitni Distance wapas neeche aayi, Levels dikhate hain. 38.2% Pullback ka matlab previous upward swing ka 38.2% portion retrace ho gaya. TradingView/MT5 tool mein Zero aur One Label Orientation setting ke mutabiq opposite nazar aa sakti hai. Actual Price Difference ka mathematical logic samajhna zaroori hai.
BEARISH FIBONACCI KA TAREEQA
Downtrend mein relevant Swing High se confirmed Swing Low tak Fibonacci draw karein. Price low se upar recover kare to 50% ya 61.8% upward retracement evaluate ki ja sakti hai. Agar ye H1 Supply ya previous Lower High ke qareeb ho to Selling Reaction observe karne ka possible area hai. Lekin rally strong ho aur Supply decisively reclaim kar le to Bearish Idea weak ho sakti hai. Fibonacci line alone guaranteed Sell trigger nahi.
EUR/USD BULLISH CALCULATION
Maan lein EUR/USD 1.1000 se 1.1100 tak rise karti hai, Total Move 100 Pips. High se 38.2% Retracement calculate karein: 1.10618. 50% Retracement: 1.1050. 61.8% Retracement: 1.10382. Ye price areas measurement references hain, guaranteed exact Buying Points nahi. Spread, Broker Digits aur market movement ki wajah se perfect numerical tick par order fill hona zaroori nahi.
GBP/USD BEARISH CALCULATION
GBP/USD 1.2800 se 1.2700 tak fall kare to 100 Pips bearish impulse. Low se 38.2% retracement 1.27382, 50% 1.2750 aur 61.8% 1.27618 ho sakta hai. Agar H1 Supply 1.2750–1.2770 mein hai to Fib 50 aur 61.8 us band ke saath overlap kar rahe hain. Ye possible Bearish Confluence hai, automatically Sell Order place karne ka reason nahi. M5 Candle Close aur SL plan required honge.
GOLDEN ZONE KI REALITY
Kuch traders 50%–61.8% ko Golden Zone kehte hain, kuch 61.8 ke around narrow band aur kuch 78.6% bhi include karte hain. Definitions different ho sakti hain. Fibonacci Maths Gold, EUR/USD ya Bitcoin par guaranteed bounce create nahi karti. Agar Fib line H1 Support/Demand ke saath align nahi to isolated line ki relevance weak ho sakti hai. Apne Golden Zone Criteria clearly define kar ke test karein.
MARKET STRUCTURE KE SAATH FIBONACCI
H4 Uptrend mein H1 Pullback purane Higher Low ke area tak aaye aur Fib 50% se align ho, to possible Observation Zone hai. Lekin agar H4 Significant Higher Low decisively break ho jaye, to Bullish Scenario weaken ho sakti hai chahe 61.8% Line abhi chart par maujood ho. Real swing high/low Market Structure provide karte hain; Fibonacci unhi swings ka proportional measurement hai. Higher Timeframe Context ko priority dein.
SUPPLY DEMAND AUR ORDER BLOCKS
Fibonacci Level H1 Demand, Supply, Support/Resistance ya Order Block ke around ho to Confluence ka possibility create hota hai. Lekin pehle independent Zone mark karein, uske baad Fib check karein. Agar Fib ko match karne ke liye Zone boundaries move karte rahenge to artificial Confluence ban jayegi. Historical levels ka proper original screenshot rakhna useful hai. Multiple lines same place par milne ka matlab guaranteed institutional order nahi.
ENTRY CONFIRMATION METHOD
Bullish Strategy ka possible framework: H4 Uptrend → H1 Completed Swing → Fib 50–61.8 Pullback → Demand Zone Overlap → M5 Bullish Engulfing Close ya CHoCH → SL and Lot Calculation. Agar price Fib Level touch kare lekin bullish rejection na aaye to Entry Condition missing hai. Bearish Setup mein H4/H1 bearish, Supply overlap aur completed M5 lower high rule ho sakta hai. First Touch Limit Entry alag aggressive method hai.
STOP LOSS FIB LEVEL SE THODA SA DOOR?
Har trade mein 61.8 ke just 1 Pip beyond SL rakhna scientific solution nahi. Agar relevant Structural Swing Low aur Zone ka lower extreme us se door hai to Stop actual market behavior ke mutabiq determine karein. Position Size Dollar Risk aur Stop Distance se calculate karein. Agar 40-Pip SL required aur Nearest Resistance 20 Pips upar ho to RR unattractive ho sakti hai. Beautiful Fibonacci setup bhi No Trade ban sakta hai.
FIBONACCI EXTENSIONS VS RETRACEMENTS
Retracement pichhli swing ke andar Pullback Percentage show karti hai. Extension Tool original Swing se beyond possible target projection ratios, jaise 127.2% ya 161.8%, show kar sakta hai. Projection guaranteed TP nahi. Agar 161.8 se pehle H4 Supply significant hai to trader ko us Supply ka risk ignore nahi karna chahiye. Tools visual planning mein help karte hain, Market par control nahi.
COMMON FIBONACCI MISTAKES
Unfinished Candle Swing par Fib Draw karna, winning chart dekh kar anchor change, M1/H4 levels randomly mix, 50% ko pure Fibonacci Ratio kehna aur har 61.8 touch par Blind Buy/Sell common errors hain. Bohat saari Fibs draw karne se har Price ke qareeb koi na koi line mil jayegi. Few Major Swings aur fixed rule rakhein. Historical Chart par Before/After Screenshot compare karein.
HINDSIGHT KE BAGHAIR FIBONACCI DRAW KAREIN
Backtesting mein Chart ka future hidden rakh kar selected past Date tak candles show karein. Us waqt latest confirmed H1 Swing Low/High identify karein aur Fibonacci draw karein. Screenshot save karein. Phir candles aage move kar ke dekhein kya Price actual zone par aayi aur M5 confirmation hui. Agar aap full chart dekhne ke baad woh exact Wick choose karein jahan 61.8% perfect reverse hui, to historical result biased ho sakta hai. Real-Time par jo information available thi, wahi use karna honest testing hai.
ZONE AUR SINGLE LINE KA DIFFERENCE
EUR/USD 1.1000 se 1.1100 tak 100-Pip rise kare to 50% Fib 1.1050 aur 61.8% about 1.10382 hai. Dono ke darmiyan 11.8 Pips ka band hai. H1 Demand 1.1040–1.1055 mark ho to Fib Band ka kuch portion Demand se overlap karta hai. 1.1050 par Blind Limit Entry aur M5 Confirmation ke baad 1.1060 par Buy alag trading setups hain. SL/TP distance aur Win Rate different ho sakti hai. Apne rules likhein Full Band Overlap compulsory hai ya Single Line Touch enough.
SIDEWAYS MARKET MEIN FIB ERRORS
Agar H1 market Range mein hai aur clear Higher High/Higher Low trend nahi to directional swing select karna subjective ho sakta hai. Har chhoti move par nayi Fibonacci draw karenge to eventually har Price Level kisi na kisi 50% ya 61.8% ke qareeb aa jayega. Ye artificial Confluence hai. Kuch traders Fib Draw karne ke liye pehle meaningful BOS/Displacement require karte hain. Agar trend leg clear nahi to plain H1 Support/Resistance Range mark karna aur Fib strategy skip karna better ho sakta hai.
H4 H1 M5 CONFLUENCE
H4 Bullish Trend confirm hai aur H1 par complete upward swing bani. Trader H1 Fibonacci draw kare, saath H4 Demand ya Previous Support independently mark kare. Agar H1 50% Level H4 Support se overlap aur M5 completed bullish CHoCH de to setup ka higher-timeframe location aur lower-timeframe trigger clear hai. Lekin H4 Fibonacci aur H1 Fibonacci dono same underlying Market Prices ke calculations hain. Multiple lines ka agreement guaranteed institutional Buying proof nahi.
FAILED FIB SETUP KAB INVALID?
H1 Bullish Retracement ka 61.8% Level hit hua lekin M5 bullish confirmation nahi milti. Phir H1 Candle previous important Swing Low ke neeche strong close de. Is situation mein bullish continuation thesis weaken ho sakti hai. Sirf Fib Line abhi visible hai is liye old Buy Limit active rakhna risky hai. Stale Pending Order cancel karein, Market Structure dobara evaluate karein aur Loss avoid karne ke liye Stop Loss irrationally door na karein. Fibonacci ka level fail hona normal outcome hai.
FIB STRATEGY BACKTEST WORKSHEET
Swing Anchor Prices, Timeframe, 50/61.8 Level, H4 Direction, H1 Demand/Supply, Entry Type, M5 Close, SL/TP, Spread aur Net R Multiple record karein. Jo setups Fib Level tak nahi aaye ya Confirmation missing thi unhein bhi Not Triggered note karein. Fib Zone Model ko same H1 Demand Model se compare karein. Agar extra Ratio Filter Opportunities reduce kare lekin Net Expectancy improve na ho, to added Complexity useful nahi ho sakti. Past winning results future guarantee nahi.
PIPSEPAISA FREE COURSES
Sir Sajid Khan Ghori ka Free Forex Technical Analysis Course Market Structure, Support/Resistance aur Technical Tools ko step-by-step seekhne ka option hai. Sir Ghulam Abbas ka Free Forex Fundamental Analysis Course Gold/Forex ke Economic Drivers ko samajhne ke liye hai. www.pipsepaisa.com ke Courses Tab se enrollment instructions check karein.
CONCLUSION AUR RISK DISCLAIMER
Fibonacci previous Price Move ke Ratios ka measuring tool hai. H4 Trend, H1 Independent Demand/Supply, M5 Completed Confirmation aur Structural SL ke bina Fib Touch ko guaranteed Entry mat samjhein. No Confirmation = No Trade. Ye content educational hai, Personal Financial Advice nahi. Forex aur Gold leveraged products mein loss ka risk hai.
Educational content only. Trading involves risk. Always use independent analysis and appropriate risk management.