
Footprint Charts and Order Flow Delta: Bid/Ask Volume, CVD and Forex Trading
PipSePaisa • Forex Education & Research
WHAT IS A FOOTPRINT CHART?
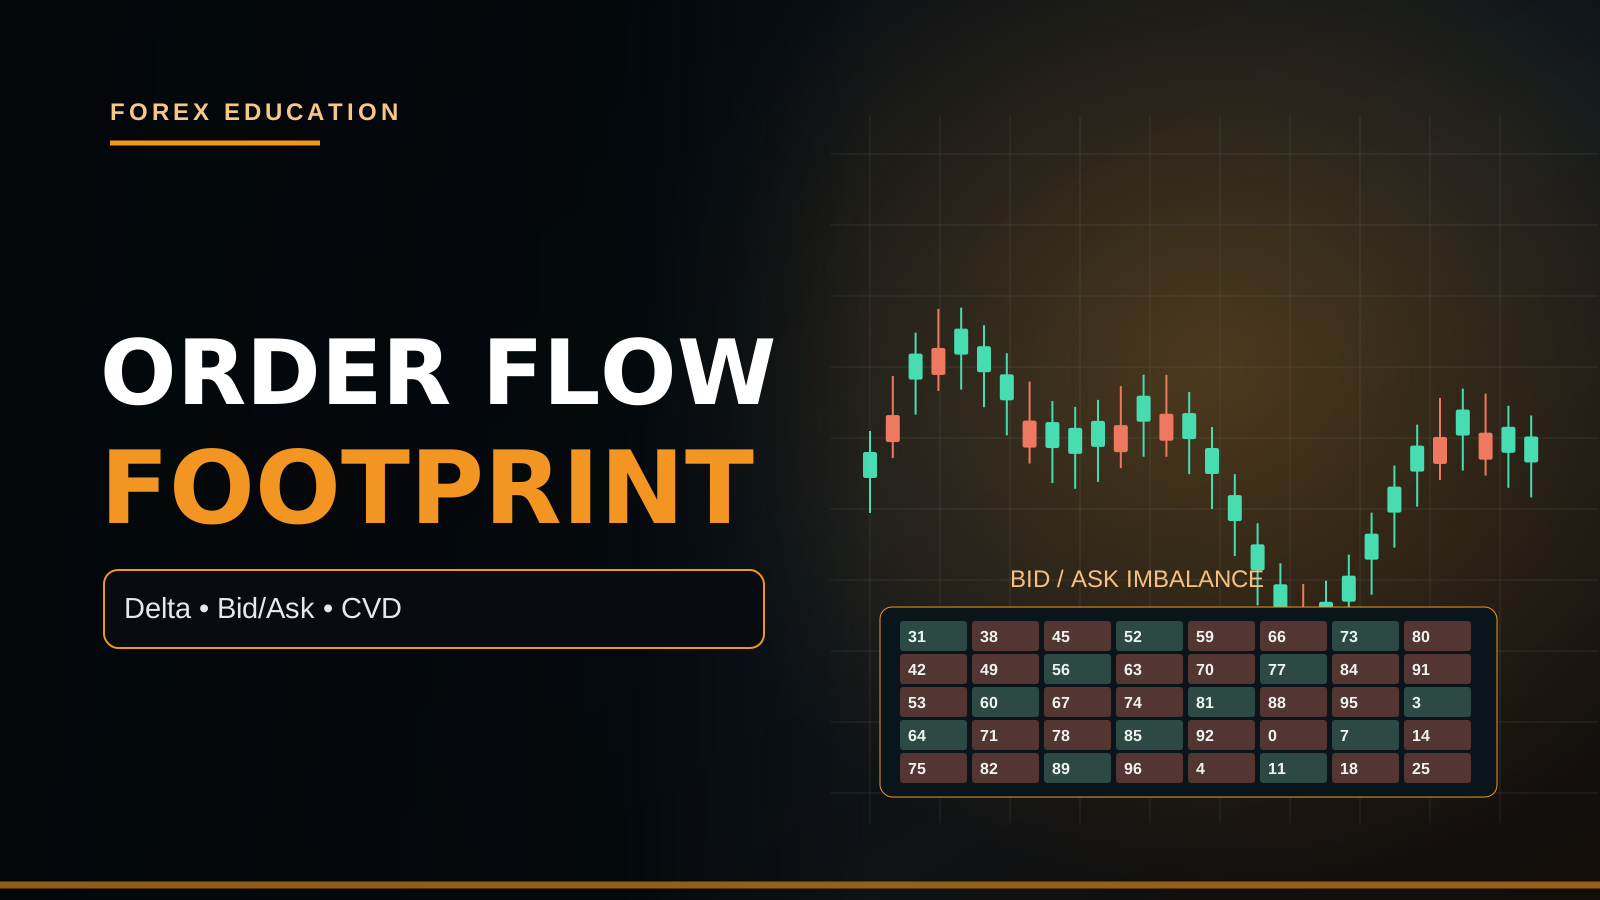
A Footprint chart is a form of market-data visualization that displays executed trading activity inside individual price bars, often broken down by price level and aggressor side. Unlike a regular candlestick, which summarizes open, high, low and close, a Footprint may show the quantity of contracts executed at the bid and ask, price-level imbalances, total bar volume and Delta. Traders use it to study how aggressive orders interacted with available liquidity. A Footprint is not a crystal ball and cannot by itself reveal every hidden institutional position.
THE DIFFERENCE BETWEEN PRICE ACTION AND ORDER FLOW
Price Action focuses on historical price movement, including swing highs/lows, candle bodies, Support/Demand and structural breaks. Order Flow uses trade-level or aggregated execution information to observe activity behind price changes, where suitable data is available. A green H1 candle demonstrates a higher close than open; it does not specify the number of contracts purchased aggressively at each price. A Footprint can add detail when sourced from an exchange, but it does not replace the overall market context. Both forms of analysis have limitations.
WHAT ARE THE BID AND ASK?
In a conventional quoted market, the bid is a price at which buyers are willing to purchase and the ask is the price at which sellers are willing to sell, for a particular available quote. The spread is the difference. Trades that execute against displayed ask liquidity are commonly classified as buyer-initiated, while trades hitting the bid are often classified as seller-initiated. Real feeds, venues and classification algorithms vary. A trade recorded at the ask is not a guarantee that the buyer will subsequently profit.
AGGRESSIVE BUYERS AND SELLERS
A marketable Buy order crosses to the available offer rather than waiting passively at a lower price; a marketable Sell order crosses to bid liquidity. Footprint interpretations often call those aggressive buyers and sellers. Yet every executed trade has a counterparty. An aggressive buyer might transact with a passive sell limit resting at the ask. Thus high aggressive buying can coincide with limited upward price movement if supply is available. The labels refer to how trades were initiated, not to a global imbalance in the mathematical number of buyers and sellers.
HOW A FOOTPRINT CELL WORKS
A Footprint cell may display two numbers at a single price level, such as 120 × 185, representing executed bid-side and ask-side volume under a platform convention. Some tools place bid on the left and ask on the right; others use different styling or calculations. Suppose 120 contracts traded at the bid and 185 at the ask: the simple ask-minus-bid Delta for that cell is +65. Before interpreting the display, verify the instrument's tick size, venue, data subscription and which column represents which side.
DELTA FORMULA
A common Delta calculation is Aggressive Buy Volume − Aggressive Sell Volume. If a bar contains 3,500 ask-side contracts and 2,800 bid-side contracts, its Delta would be +700 contracts under that convention. Positive Delta means the recorded trade classifications favored aggressive buying by that net amount during the selected bar. It does not ensure the candle closed bullish or the next candle will rise. Execution classification, hidden order handling and market microstructure can make interpretation more complex.
NEGATIVE DELTA
If buyer-initiated executions total 1,400 and seller-initiated executions 2,200, bar Delta is -800. That can be consistent with aggressive selling during the interval. However, price may still hold an H1 Demand zone if passive counterparties absorb that selling. A strongly negative Delta at a low can be the start of further breakdown or part of a failed sell-side sweep. A trader should compare Delta with actual price progress and subsequent market structure rather than treating every red value as an instant Sell.
CUMULATIVE VOLUME DELTA
Cumulative Volume Delta, or CVD, accumulates consecutive bar Delta readings over a selected period. If three bars show +200, -350 and +600 Delta, the cumulative change from a zero base is +450. The level depends on where accumulation begins, including session reset conventions. Different exchanges, contracts and trading hours can produce different curves. A CVD rise may show that classified aggressive buying dominated over the sample, but it is not a count of all long positions being opened.
DELTA DIVERGENCE
Some traders observe price making a new high while CVD fails to reach a comparable new high. They may describe this as a potential divergence in aggressive activity. But price can continue higher despite such divergence, perhaps because liquidity is thin, quotes shift or a different participant group drives movement. The precise swing points and measurement window matter. Do not draw a CVD divergence after the profitable trade is known and claim it would have guaranteed an early short. Test the observation under fixed rules.
FOOTPRINT IMBALANCES
An imbalance may be defined when ask-side executed volume at one price greatly exceeds an opposing bid-side measure, often using a diagonal comparison between adjacent prices. The exact ratio and method are platform-specific. An illustrative three-to-one ratio is a filter some traders use, not an exchange-certified institutional Buy level. Stacked imbalances refer to multiple adjacent price levels meeting the selected condition. They can accompany strong directional activity, but a breakout can still fail.
ABSORPTION: EFFORT VERSUS PRICE PROGRESS
Absorption is a common order-flow hypothesis when heavy marketable buying or selling encounters enough opposing liquidity to limit price progress. For example, large aggressive Buy volume near H1 Resistance with little upward advance might suggest passive sellers are absorbing it. Yet a Footprint alone does not identify the counterparty or prove that a specific hedge fund is building a short. The next completed candles and any later breakout or rejection determine whether the area held. Treat absorption as a scenario to test.
EXHAUSTION AT EXTREMES
Order-flow commentators sometimes label declining traded activity or small Delta near an extreme as exhaustion. But low volume at a high can also occur before another breakout if supply is thin. A market can trend strongly on relatively modest volume when available liquidity is sparse. High volume is not required for every valid move, and absence of aggression is not proof of a reversal. Combine a potential exhaustion interpretation with meaningful H1 Supply/Demand and completed price-action confirmation.
THE POC INSIDE A BAR
A Footprint or volume-at-price chart may identify the price level with the greatest executed volume in a single bar or selected session, called a Point of Control under the specific tool's method. That is a historical concentration, not a guaranteed pending-order pool. An important H1 Supply zone can align with a bar's POC, but such coincidence does not prove the level will hold again. Define the volume profile interval and data source, because POC values can change with segmentation.
TIME AND SALES
Time and Sales, sometimes called the tape, lists reported executions with available details such as timestamp, price and size. On centralized venues it can provide a clearer view of actual exchange prints. However, very rapid sequences can be difficult to interpret manually, and several reporting conventions exist. A large print is not automatically an aggressive institutional Buy; it may be a crossing trade, a hedge or part of a broader execution strategy. Understanding the feed is more important than visually dramatic numbers.
DEPTH OF MARKET VERSUS EXECUTED VOLUME
Depth of Market, or DOM, shows available displayed bids and offers under a venue or broker's book at a moment. A Footprint emphasizes executed transactions. Displayed liquidity can change or be canceled before execution, while executed trades have already occurred. A large visible resting order may not be fully executed, and hidden liquidity may not appear in the displayed book. Traders should not describe a heatmap, DOM and Footprint as three identical forms of data. Each answers different questions.
SPOT FOREX DATA LIMITATIONS
Global Spot Forex is decentralized. A retail MT5 Broker may provide its own quotes and tick volume but does not necessarily offer centrally consolidated executions for every EUR/USD transaction in the world. Some 'Forex Footprint' indicators infer buy/sell pressure from candle ticks rather than real exchange bid/ask execution classifications. Such proxies can be educational, but calling them genuine global traded Delta is inaccurate. Ask whether the tool uses exchange futures data, a broker venue feed or a synthetic approximation.
FUTURES DATA FOR FOREX TRADERS
Currency futures traded on a centralized exchange can provide transaction prints, prices and volume under a defined contract. EUR/USD Spot traders may study related Euro FX futures Order Flow, recognizing that futures and Spot prices, session times and contract conventions differ. A Footprint at a futures price level is not automatically the same exact Stop Loss level on a CFD broker chart. Contract rollovers, exchange holidays, basis differences and fees should be considered. Map reference data and actual execution instruments separately.
GOLD FUTURES VERSUS XAUUSD CFD
COMEX Gold futures have exchange-reported traded volumes, while retail XAUUSD CFDs use broker-specific price quotations and execution. A Footprint derived from COMEX cannot prove that the entire worldwide physical Gold market is buying at the same number. Futures price may differ from Spot/CFD for financing, contract expiration and basis reasons. When showing Gold Footprint examples, name the reference contract and distinguish contract ticks from a retail platform's points or pips. Correct contract specifications are essential to risk calculations.
A GOLD SELL CASE STUDY
Suppose Gold rallies into a predefined H4 Supply Zone. A centrally sourced futures Footprint shows substantial aggressive buying at the high but price fails to sustain progress, and a completed M15 candle closes below the zone. A trader may hypothesize absorption and wait for an M5 bearish CHoCH before considering a Sell on retail XAUUSD. Stop Loss should sit beyond meaningful structural invalidation on the actual traded instrument. The Footprint is contextual evidence, not proof the next move must fall.
A GOLD BUY CASE STUDY
Gold tests H1 Demand during the New York session and briefly dips beneath equal lows. Futures Delta is strongly negative near the lower extreme but price later reclaims the range, suggesting a possible failed breakdown or opposing passive demand. A confirmed M5 bullish engulfing plus Higher Low may be used as the strategy's trigger. But a fresh rise in US real yields after CPI could still drive Gold lower. An order-flow interpretation is not immunity from fundamental repricing or Stop Loss.
AN EUR/USD CONTINUATION EXAMPLE
EUR/USD H4 is bullish, H1 retraces toward a previously broken Resistance area and M15 forms a small range. An exchange-traded Euro FX futures Footprint shows repeated positive Delta during a completed upside breakout, while price holds above the former range high. A trader could evaluate a continuation model if the Spot EUR/USD level and futures reference are correctly mapped. An M5 completed retest might provide a price-based trigger. No reasonable Target Space or an oversized structural Stop means no trade.
WHEN THE DELTA AND CANDLE DISAGREE
An M5 bullish candle can have negative Delta under some conditions, and a bearish candle can contain positive Delta. This can occur when the price movement depends on the changing availability of resting liquidity rather than only the net count of aggressive trades. It may also arise from feed and classification differences. The disagreement is a question for analysis, not an automatic reversal flag. Inspect the bar's location, data quality and subsequent completed structure before assigning a trading implication.
FOOTPRINT AND NEWS RELEASES
During NFP, CPI and FOMC events, exchanges can see rapid bursts of execution and shifts in liquidity. A Footprint may display large Delta and stacked imbalances after price has already moved a substantial distance. Chasing the strongest cluster risks late entry, wide Stop Loss, larger spreads and slippage. An indicator signal does not neutralize the uncertainty of the next economic headline. If the trading model excludes release minutes, follow the rule even when the footprint looks exceptional.
CHOOSING A PLATFORM AND FEED
Check whether Footprint data comes from an exchange and whether the required market-data subscription is current. Confirm the contract, bid/ask classification method, aggregation type, Delta reset, tick size and trading session. Different platforms may group price levels or classify trades differently. A free indicator that merely colors candle volume may be useful as a visualization but should not be marketed as a verified centralized Order Flow feed. Documentation and data provenance are part of professional analysis.
BACKTESTING ORDER FLOW FAIRLY
Specify the exact exchange contract, historical depth of data, Footprint settings, aggregation, entry condition and whether data was genuinely available at the decision time. Historical bar plots can conceal how intrabar numbers changed during live formation. Fix H4/H1 zones, M5 completed signal, structural Stop and TP. Compare performance with a simpler price-action setup without Footprint. Record net R, drawdown, spread and slippage. Avoid selecting only screenshots where positive Delta preceded a profitable breakout.
RISK MANAGEMENT AND EXECUTION
Order Flow can inform location and participation but cannot choose a position size on its own. Calculate money-at-risk from actual entry-to-stop distance and broker contract value. For Gold, verify Tick Value and Contract Size; for EUR/USD, use the appropriate Pip Value. Multiple correlated USD trades still increase portfolio exposure. Do not expand volume because a Footprint displays green imbalances. If your written model requires M5 engulfing/close and no such confirmation occurs, stay flat.
COMMON FOOTPRINT MISTAKES
Common mistakes are treating positive Delta as guaranteed Buy, calling a broker tick-volume proxy real exchange Delta, assuming visible DOM orders must execute, ignoring futures/CFD price differences, and believing one large order proves institutional intent. Some traders also enter from unfinished live Footprint bars based on historical completed-bar examples. Interpret the actual data carefully. A technical education article should explain how a signal can fail rather than implying that access to Order Flow eliminates losses.
ORDER FLOW FAQ
Is positive Delta always followed by a higher price? No. Does a Footprint show every worldwide Spot Forex order? No. Are DOM displayed orders the same as executed trades? No. Is CVD a complete inventory of long contracts? No. Can price rise on negative Delta? Yes. Can an absorption hypothesis fail? Yes. Use the workflow: H4/H1 Context → Verified Data Source → Order-Flow Observation → Completed M5 Confirmation → Structural Stop → Correct Lot and Target. No Confirmation = No Trade.
PIPSEPAISA FREE COURSES
For trading structure and execution, explore the Free Forex Technical Analysis Course by Sir Sajid Khan Ghori. For economic and central bank analysis, explore the Free Forex Fundamental Analysis Course by Sir Ghulam Abbas. Details at www.pipsepaisa.com under Courses. Education only; leveraged trading can cause losses.
Read in Roman Urdu
FOOTPRINT CHART KYA HAI?
Footprint Chart regular Candlestick se zyada execution detail show karne wali Volume-at-Price Visualization hai. Ek H1/M5 Candle ke andar different Price Levels par executed Buy/Sell Activity display ho sakti hai. Platform Bid/Ask Volumes, Delta, Price-Level Imbalances aur Total Volume show kar sakta hai. Lekin Footprint Next Candle certain forecast nahi. Genuine Exchange Data aur Broker Tick-based synthetic representation alag cheezein hain. Pehle Data Source verify karein, phir Trading Decision.
PRICE ACTION VS ORDER FLOW
Price Action H4 HH/HL, LH/LL, Candlesticks, Supply/Demand aur BOS/CHoCH study karti hai. Order Flow transactions ki available detail se aggressive buying/selling Activity observe karti hai. H1 Green Candle sirf Close > Open show karti hai; har Price Level par exact executed contracts nahi. Genuine Futures Footprint extra information de sakti hai. Lekin Larger Market Structure aur Fundamental News still important. Dono Methods guaranteed winning signal nahi deti.
BID AUR ASK KYA HAIN?
Bid market mein available buyer quotation aur Ask seller offer quotation ka context hai. Ask Bid se higher ho to difference Spread. Aggressive Buy generally available Ask par execution karti hai, aggressive Sell available Bid hit karti hai. Platform Execution Classification aur Venue Rules differ kar sakte hain. Ask par executed Buy profitable guaranteed nahi. Every Completed Trade ke liye Counterparty bhi hota hai. Bid/Ask Numbers Total Bank Positions ka complete record nahi.
AGGRESSIVE BUYER SELLER
Marketable Buy current Offers ke against transact kar sakti hai aur Marketable Sell Bids ke against. Footprint inhe Aggressive Buyers/Sellers kehti hai. Lekin Aggressive Buyer ke against Passive Limit Seller trade fill karta hai. Isliye bohat Aggressive Buying aane ke bawajood Resistance price hold kar sakti hai, agar opposing Available Supply sufficient ho. Buy Volume ka simple comparison long-term price direction guarantee nahi. Classification order initiation describe karti hai.
FOOTPRINT CELL NUMERICAL EXAMPLE
Ek Footprint Price Cell 120 × 185 show kare, jahan platform convention left Bid Executions aur right Ask Executions ho. To Ask-minus-Bid Delta = 185−120 = +65. Lekin har platform Bid Left/Ask Right same style necessarily nahi; Settings verify karein. Volume Real Futures Contracts hai ya Broker Approximation? Price Tick Size kitna? Is information ke baghair Green Cell ka interpretation misleading ho sakta hai. Actual trade-time data confirm karein.
DELTA FORMULA
Common Delta = Aggressive Buy Volume minus Aggressive Sell Volume. M5 Bar Ask-side 3,500 Contracts aur Bid-side 2,800 ho to Delta +700. Ye selected interval mein Aggressive Buys net greater show karti hai. Lekin Next Candle Bullish guaranteed nahi. Passive Sellers available hon to Price progress limited. Custom Delta Indicators tick movement se proxy estimate kar sakte hain. Formula ke Data Input aur Venue bhi important hain.
NEGATIVE DELTA EXAMPLE
Agar Buyer Initiated Activity 1,400 aur Seller Initiated 2,200 ho to Delta -800. Ye more Aggressive Selling clue hai. Lekin H1 Demand strong hold kare to Price Downside Progress fail ho sakti hai. Negative Delta Sell-Side Sweep ya further genuine Breakdown dono ke saath appear ho sakti hai. M5 Engulfing/CHoCH aur H1 Zone Confirmation ke baghair automatic Buy/Sell nahi. Price Result vs Trading Effort compare karein.
CVD CUMULATIVE VOLUME DELTA
CVD consecutive Bar Delta accumulate karti hai. Three Bars +200, -350 aur +600 ho to Starting Zero se Final CVD +450. Lekin Session Reset kahan se hota hai, indicator line ka Absolute Number depend karta hai. Different Futures Contracts aur Timezones mein Values differ. Rising CVD selected feed mein Aggressive Buying net dominance show karti hai, new long positions ki verified global inventory nahi. CVD Trading Signal ko context ke saath test karein.
CVD DIVERGENCE
Price new High banaye magar CVD previous High confirm na kare to Traders possible Divergence discuss karte hain. Lekin Price liquidity thin hone ya other factors ki wajah se Higher continue bhi kar sakti hai. Divergence Swing Anchors aur Measurement Window predefine karein. Trade win hone ke baad conveniently CVD Peaks change karna Hindsight Bias. H1 Supply, Actual Price Rejection aur M5 Bearish CHoCH trigger zyada important. Divergence guaranteed reversal nahi.
FOOTPRINT IMBALANCE
Imbalance kuch Price Levels par Ask Executed Volume ka Bid comparison se large ratio show karti hai. Some Platforms diagonal comparison aur 3:1 ratio jaisa threshold use karti hain. Ye chosen indicator configuration hai, exchange certified Bank Buying Level nahi. Stacked Imbalances multiple adjacent cells meet karti hain. Strong Upward Trading Activity ka clue ho sakta hai, lekin Price False Breakout de sakti hai. Same Settings use kar ke strategy test karein.
ABSORPTION KYA HOTI HAI?
Absorption hypothesis tab discuss hoti hai jab Strong Aggressive Buy/Sell Volume aane par Price comparatively less progress kare. H1 Resistance par Large Buy Aggression aur Price Upper Close fail ho to Passive Sellers possible. Lekin specific Hedge Fund ke exact Sell Orders Footprint se identify nahi ho sakte. Subsequent M15/H1 Rejection aur M5 Structure Shift observe karein. Absorption Label guaranteed reversal nahi. Market next Candle Resistance Break bhi kar sakti hai.
EXHAUSTION SIGNAL
Kuch Order Flow Traders High/Low extreme par Declining Trade Activity ko Exhaustion describe karte hain. Lekin Low Volume ke saath bhi Strong Trend continue ho sakti hai, especially Liquidity sparse ho. High Volume hamesha necessary nahi. One small Delta Cell Reversal confirm nahi karti. H4 Bias aur H1 Price Location dekhein. Agar M5 CHoCH incomplete hai to No Trade. Abstract Exhaustion Theory risk-free Entry nahi.
POINT OF CONTROL POC
Footprint Bar/Session ka Highest Executed Volume Price Level POC ke naam se mark ho sakta hai. Ye Historical Activity Concentration hai, outstanding institutional Limit Orders guarantee nahi. H1 Supply POC ke qareeb ho to potential monitoring area, but future revisit par hold compulsory nahi. Chosen Profile Session, Price Bin Size aur Data Source se POC Level change ho sakta hai. Chart par POC ko single exact magic price na samjhein.
TIME AND SALES TAPE
Time and Sales Execution Prints show karta hai: Timestamp, Price, Size aur other Details available ho sakti hain. Exchange Futures Market mein Actual Venue Executed Transactions mil sakti hain. Lekin Large Print necessarily aggressive Bank Buy nahi; Hedge, Cross, Liquidity Execution ya multiple strategies possible. Very fast Tape manually interpret karna difficult hai. Feed Source aur Report Conventions ke baghair speculative Intent claims avoid karein.
DOM VS FOOTPRINT
Depth of Market DOM available displayed Bid/Ask Resting Orders show kar sakta hai. Footprint already Executed Transactions ka distribution focus karti hai. DOM Visible Order cancel/modify ho sakta hai before fill, jabke executed trade complete ho chuka. Hidden Orders display nahi hote. Heatmap, DOM aur Footprint same exact Data Type nahi. Order Flow Trading mein Available Liquidity vs Executed Volume ka difference samjhein.
SPOT FOREX DATA ISSUE
Global Spot Forex decentralized hai, MT5 Broker ke paas entire worldwide EUR/USD Trade Prints consolidated necessarily nahi. Broker Tick Volume Quote Activity ka proxy ho sakta hai. Kuch 'Forex Footprint' Tools Tick Direction se synthetic Buy/Sell Delta estimate karti hain, real exchange aggressive bid/ask fills nahi. Educational Indicator visualization useful ho sakti hai, lekin ise all banks ka real Order Flow kehna misleading. Data Source ko clearly label karein.
CURRENCY FUTURES FOOTPRINT
Centralized Currency Futures Exchange executed Trade Price aur Contracts Volume provide kar sakti hai. Euro FX Futures Footprint ko Spot EUR/USD trader Broad Context ke liye dekh sakta hai. Lekin Contract Pricing, Session, Futures Basis aur Rollover Spot Broker se differ. Futures Level ko directly Retail CFD MT5 Entry/SL mein copy karna inaccurate ho sakta hai. Reference Contract aur Actual Execution Symbol clearly identify karein. Broker Contract Specifications separate hoti hain.
GOLD FUTURES VS XAUUSD
COMEX Gold Futures par Exchange Volume available hoti hai, Retail XAUUSD CFD Broker Quote/Trade Data alag. COMEX Footprint global Physical Gold Central Banks ke all transactions show nahi karti. Futures Price Expiration, Carry aur Basis se Spot Gold Level se differ ho sakti hai. Gold price $20 Move ka Monetary Impact Broker Contract Size par depend. Footprint Cell Numbers ko XAUUSD tick/pip convention ke saath confuse na karein.
GOLD SELL EXAMPLE
Gold H4 Supply par Rally karti hai. Genuine Gold Futures Footprint High ke qareeb high Aggressive Buy Volume show karti hai, lekin M15 Candle Resistance ke upar hold nahi karti. Possible Absorption Hypothesis. M5 Lower High + Bearish CHoCH complete ho to XAUUSD Sell Candidate under tested Model. SL Retail Broker actual Rejection High ke beyond. Target H1 Demand aur Risk/Reward. Indicator 'Smart Money Sell Guaranteed' nahi.
GOLD BUY EXAMPLE
Gold H1 Demand par Price previous Equal Lows sweep karti hai. Futures Delta strong Negative ho sakti hai, lekin Candle Range mein reclaim aur M5 Bullish Engulfing complete ho. Possible Failed Breakdown with Aggressive Selling absorbed Thesis. Lekin US CPI Real Yields increase kare to Gold further decline bhi possible. SL Sweep Low ke beyond, Lot Budget ke according. Negative Delta = guaranteed Buy nahi; Actual Confirmation necessary hai.
EUR/USD CONTINUATION
EUR/USD H4 Bullish hai. H1 previous Resistance Retest Support ka scenario aur M15 tight Range. Euro FX Futures Footprint genuine Positive Delta and Price Range Upper Break hold show karti hai. M5 completed Retest/Higher Low Buy Trigger possible. Lekin Futures vs Spot Level map karein, H1 Opposing Supply target room calculate karein. Huge Candle ke baad SL wide ho to No Trade. Cumulative Positive Delta profits guarantee nahi.
CANDLE DELTA DISAGREEMENT
M5 Green Candle par Negative Delta aur Red Candle par Positive Delta possible hai, depending Liquidity Availability aur Execution Classifications. Market Price impact linear with Net Aggressive Contracts nahi. Ye Divergence Interpretation ka possible question hai, direct contrarian Entry nahi. Exchange Contract, Spread, Tick Data aur Follow-Through check karein. M5 Open Bar Numbers final historical bar se different ho sakte hain. Completed price structure priority rakhna sensible.
NFP CPI EVENT ORDER FLOW
NFP, CPI aur FOMC par very high Futures Executions Delta Stacked Imbalances show ho sakti hain, lekin Price already big move complete kar chuki hoti hai. Late Buy/Sell Stop Distance aur Slippage increased. Wide Spread aur Fast Counter-Move risk high. Agar Tested Plan News Avoid karti hai to strong Footprint Signal ke naam par exception na karein. News Report Actual/Forecast/Revisions aur Bond Yield Response separately relevant hain.
PLATFORM DATA VERIFICATION
Footprint Platform choose karte waqt Exchange Data Subscription, Specific Futures Contract, Bid/Ask Classification, Aggregation Type, Delta Reset, Tick Size aur Session Settings verify karein. Free Indicator jo Candlestick Volume Green/Red color karti hai, necessarily True Exchange Order Flow nahi. Data Provenance Professional Education ka part hai. Two Platforms compare karte waqt identical Contract/Feed/Timeframe use karein.
FOOTPRINT BACKTEST
Historical Tick Data available tha ya only finished-bar approximation? Contract, Timeframe, Data Feed, Imbalance Threshold, Delta Formula, H4 Trend, H1 Zone, M5 Entry Trigger, SL/TP, News Filter fix karein. Every Qualifying Trade, including failures, count karein. Price-Only H1 Demand + M5 Engulfing model se Footprint Filter ke Net R compare karein. Spread, Commission aur Slippage include. Winning Screenshots edge prove nahi karti.
RISK MANAGEMENT
Footprint Lot Size directly determine nahi karti. Actual traded instrument Entry-to-SL distance, Pip/Tick Value aur Equity Risk Budget se Volume choose karein. Gold Contract aur EUR/USD Pip Value different. Correlated USD Trades Total Account Risk barha sakti hain. Delta +2000 dekh kar Lot double karna sensible nahi. Nearest Target Room insufficient ho to Trade Skip. Full M5 Candle Close required ho to Open Bar par Early Entry avoid karein.
COMMON ORDER FLOW ERRORS
Positive Delta = Always Buy, Negative Delta = Always Sell. Broker Tick Proxy ko Global Institutional Delta label karna. DOM Visible Orders ko confirmed executed Trades samajhna. Futures/CFD Prices exact same assume. One Large Print se known Bank Intent claim karna. M5 candle incomplete aur historical finalized Footprint compare karna. Data Quality, Structure, News aur actual SL/TP se independent confidence claim na karein.
FAQ
Positive Delta next candle always up? Nahi. Footprint worldwide Spot Forex Orders? Nahi. DOM Orders same as Executed Volume? Nahi. CVD entire Long Positions? Nahi. Negative Delta ke saath Price rise? Haan. Absorption fail? Haan. Correct Workflow H4/H1 Context → Verified Footprint Feed → Delta/Imbalance Observation → M5 Full Close → Structural SL/Lot/TP. No Confirmation = No Trade.
PIPSEPAISA FREE COURSES
Sir Sajid Khan Ghori ka Free Forex Technical Analysis Course aur Sir Ghulam Abbas ka Free Forex Fundamental Analysis Course ki current enrollment details www.pipsepaisa.com ke Courses section mein check karein. Forex/Futures/Gold Trading mein Risk aur Financial Loss possible hai. Ye sirf educational content hai.
Educational content only. Trading involves risk. Always use independent analysis and appropriate risk management.