
ADX and DMI Explained: Measuring Forex Trend Strength with +DI and -DI
PipSePaisa • Forex Education & Research
INTRODUCTION
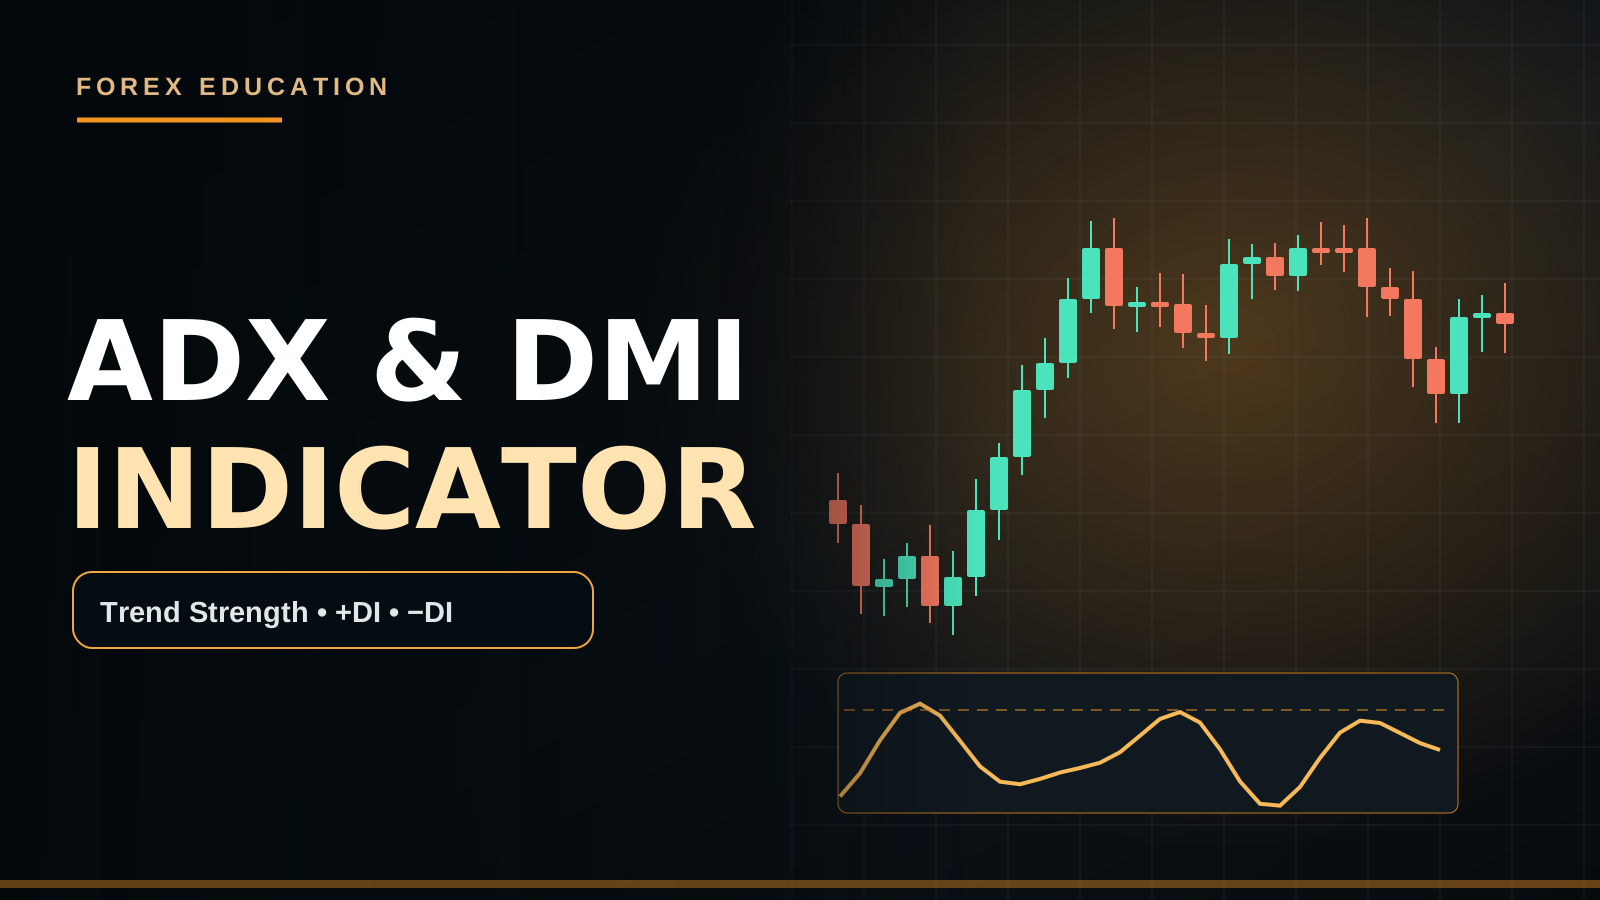
The Average Directional Index, ADX, estimates trend strength without identifying direction on its own. Directional indicators +DI and -DI describe relative upward and downward movement under Wilder's method.
PRACTICAL MARKET EXAMPLE
An ADX rise during falling GBP/USD may reflect strengthening bearish movement. If +DI is below -DI, that may align with the current downtrend, but a nearby H4 demand zone could still limit downside.
IMPORTANT LIMITATIONS
ADX above a popular threshold such as twenty-five is not proof that continuation will win; it can rise late in a trend.
ADX IS NOT DIRECTION
Average Directional Index is a trend-strength measure based on smoothed directional-movement calculations. It can increase while price falls or while price rises. A rising ADX line should therefore not be described as a Buy signal by itself. Directional indicators +DI and -DI are intended to provide relative upward/downward movement context. A higher +DI than -DI is commonly interpreted as bullish directional pressure, while the opposite can align with bearish conditions. Neither condition predicts an exact next candle or guarantees that the trend will continue.
UNDERSTANDING DIRECTIONAL MOVEMENT
Wilder's directional-movement framework compares how much the current high exceeds the prior high with how much the prior low exceeds the current low. Only the dominant qualifying direction is counted under its standard conditions. The resulting positive and negative directional movement values are smoothed and normalized against True Range. This design attempts to evaluate directional progress relative to overall volatility. Traders should avoid describing +DI and -DI as direct worldwide totals of institutional Buy and Sell contracts: they are calculated from historical price bars.
HOW ADX IS CALCULATED
A simplified explanation is that +DI and -DI values are derived from smoothed directional movement divided by smoothed True Range. A directional index DX is then commonly calculated from the absolute difference between +DI and -DI divided by their sum, multiplied by one hundred. ADX smooths DX over the chosen period, often fourteen. This is why ADX can remain elevated briefly after trend momentum begins weakening: smoothing reacts to observations over time rather than detecting future turning points.
ADX THRESHOLDS AND CONTEXT
Levels around twenty or twenty-five are often used as informal references for weak versus stronger trends, but thresholds are not universal constants. An ADX value of thirty-five on M5 during a volatile data release is not necessarily comparable to thirty-five on H4 during an established multi-day trend. Examine the slope of ADX, price swing hierarchy and whether the actual market is trending or ranging. A high value after many large candles may describe an extended move rather than attractive new entry timing.
A RISING ADX IN A BEAR MARKET
Suppose GBP/USD H1 forms lower highs and lower lows while -DI remains above +DI and ADX climbs from twenty to thirty. That combination is consistent with strengthening bearish directional movement in the sample. However, if price is approaching a previously tested H4 Demand Zone, the available downside target may be limited. A trader who sells immediately from a late lower low because ADX is high could receive poor risk-to-reward. Trend strength and good trade location are separate decisions.
A RISING ADX IN AN UPTREND
EUR/USD H4 confirms higher highs and higher lows. +DI is above -DI and ADX trends upward. This may provide supporting evidence for bullish context. A possible strategy waits for an H1 pullback into Demand and an M5 completed bullish engulfing or local bullish CHoCH. Stop Loss belongs beyond a meaningful rejection low, while the next H1 Supply determines potential target room. The indicator describes trend conditions but does not solve execution, Stop placement or position sizing automatically.
A FALLING ADX DOES NOT MEAN REVERSAL
After a strong uptrend, ADX may begin falling while price still forms higher highs. Falling ADX suggests trend strength, as measured by its calculation, is no longer increasing at the same rate. It does not imply sellers must take control next. Price may continue trending at a more moderate pace or enter consolidation. Some traders mistakenly open immediate short positions when ADX turns down. Without a bearish structure break or rejection at Supply, this is an unconfirmed reversal thesis.
DI CROSSOVERS AND CHOP
A +DI crossover above -DI can occur during a bullish movement, but choppy markets can produce repeated crossovers. If ADX is low and price sits in the center of an H1 Range, a signal may have little contextual value. Even when ADX is rising, a crossover can follow an extended candle. Define whether the system requires both a DI crossover and a separate price-action trigger, and how long the crossover remains valid. Avoid selecting whichever crossover looks best after the outcome is known.
AN EXAMPLE WITH THREE NUMBERS
Suppose +DI equals thirty-five and -DI equals fifteen. Under the simplified DX formula, DX is 100 × |35−15|/(35+15) = forty. This is a directional-strength intermediate value, not the ADX itself unless a smoothing history happens to produce that reading. A trader must not interpret DX forty as a forty-percent chance of winning. ADX depends on additional smoothing and previous candles, so one calculation does not represent the full indicator series.
USING ADX TO CLASSIFY MARKET REGIME
Some traders use ADX as a filter for trend-following strategies. For example, they may require price to show H4 directional structure and ADX above a specified threshold before considering pullback entries. Others avoid trading a crossover in a low-ADX range and instead wait for range breakout confirmation. But threshold selection can easily be overfitted. A high-ADX approach may enter late, while a low-ADX avoidance rule can miss the early breakout. Compare actual net results rather than assuming filters improve a strategy.
ADX PLUS MOVING AVERAGES
A rising EMA 50 may provide directional context and ADX may describe trend strength. But both indicators depend on historical price data and are not independent institutional order-flow sources. A trendline, horizontal support, market structure and a completed M5 close each answer different questions. If an indicator is only duplicating a known condition, it may add complexity without improving performance. Document the role of each tool and whether it changes the actual entry decision.
ATR AND VOLATILITY LINK
ADX calculations incorporate True Range normalization, while ATR directly reports smoothed True Range magnitudes. A trend can have increasing ADX even though its average candle range is not especially large in absolute price units. Likewise, very volatile sideways movement may raise ATR without establishing consistent directional progress. Learning these distinctions helps traders avoid treating every movement indicator as interchangeable. ADX, ATR and RSI measure different properties of historical prices.
NEWS AND SESSION RESTRICTIONS
During NFP, CPI and FOMC releases, price can move strongly, DI values may shift and ADX may eventually respond to the new move. But a strong indicator reading does not remove uncertainty from spreads, slippage or revised policy expectations. A London open breakout can also produce a temporary trend-strength rise before reverting. Record the session and release proximity. If your strategy excludes news windows, follow the same restriction even when the ADX appears favorable.
RISK AND ORDER MANAGEMENT
First define a real setup at H1 Supply or Demand. Next determine the Stop Loss where the price thesis fails, then use instrument pip/tick value and allowed account loss to derive lot size. The indicator can be a condition for taking a trade, but it cannot replace the need for structural invalidation. If a stop is too wide to fit your risk budget or nearest opposing level is too close, skip. Do not double the lot after a high-ADX signal fails.
TESTING A STRATEGY WITHOUT BIAS
Specify ADX Period 14 or the selected period, threshold, requirement for ADX slope, +DI/-DI order, H4 trend definition, H1 zone and M5 trigger. Include all qualifying historical trades and distinguish 'no entry' from losses. Measure average net R, worst drawdown, transaction costs and performance in range versus trend. Test the filter against a simpler baseline that uses Market Structure alone. A useful indicator has to improve decisions under realistic assumptions.
FREQUENT QUESTIONS
Can ADX rise in a falling market? Yes. Does ADX thirty guarantee trend continuation? No. Is +DI identical to global Buy order volume? No. Does a falling ADX guarantee a reverse signal? No. Can DI cross several times in a range? Yes. Should traders enter without a confirmed candle because ADX is rising? Only if a separately tested strategy explicitly permits that; do not break a close-confirmation model.
ADX IS BEST USED AS A QUESTION, NOT AN ORDER
When ADX rises, ask which price swings are actually progressing and where they are relative to the prior day's high and low. If the answer is that a bullish swing is approaching major Supply, the correct action may be to secure an existing position or simply observe. If the market is trending strongly but the stop would exceed your account's acceptable risk, position size must shrink. A strong directional condition does not cancel prudent execution. Use a checklist rather than trying to guess an exact win probability from the ADX number.
AN OUT-OF-SAMPLE TESTING EXERCISE
One approach is to define a training sample of H1 EUR/USD charts and a later unseen sample. In the training period, fix whether you require ADX above twenty-five, +DI over -DI and a completed M5 bullish candle at Demand. Apply those exact rules to the later sample without changing the threshold whenever a loss appears. Compare the net result against a simple H4 trend/H1 Demand strategy without ADX. This measures whether the added indicator changes decisions constructively. Record missed setups and the cost of wider stops during volatile sessions.
PIPSEPAISA FREE COURSES
For structured technical analysis education, explore the Free Forex Technical Analysis Course with Sir Sajid Khan Ghori. To understand the economic context behind Forex and Gold, explore the Free Forex Fundamental Analysis Course with Sir Ghulam Abbas. Visit www.pipsepaisa.com and select Courses for enrollment instructions. Courses and trading content cannot guarantee profit.
RISK DISCLAIMER
This is for education only. No indicator, chart pattern or economic release guarantees a trading outcome. Always calculate potential account loss, consider spreads and slippage, and wait for completed confirmation before trading.
Read in Roman Urdu
INTRODUCTION
ADX Trend Strength estimate karta hai, lekin ADX alone Buy/Sell Direction nahi batata. +DI aur -DI Wilder directional calculations ke mutabiq Upward/Downward pressure ka context dete hain.
PRACTICAL EXAMPLE
GBP/USD fall ho aur ADX rise kare to Bearish Trend Strength barh sakti hai. -DI above +DI bearish pressure show kare, lekin H4 Demand neeche ho to target limited ho sakta hai.
LIMITATIONS
ADX 25 se upar hona trade guarantee nahi. Trend late phase mein bhi ADX high ho sakta hai.
ADX DIRECTION NAHI, TREND STRENGTH
Average Directional Index historical Price Movement se Trend Strength estimate karta hai. ADX rising ho sakta hai jab Market Bullish ho aur tab bhi jab Market Bearish ho. Sirf ADX up ja raha hai is liye Buy button press karna logical nahi. +DI aur -DI Upward/Downward Directional Movement ka relative context dete hain. +DI > -DI bullish pressure align kar sakta hai, -DI > +DI bearish pressure. Lekin ye future Candle ka certain forecast ya actual Bank Order Volume nahi.
DIRECTIONAL MOVEMENT FORMULA KA IDEA
Wilder Framework Current High ko Previous High aur Current Low ko Previous Low se compare karta hai. Jab upward movement dominant aur qualifying ho to Positive Directional Movement record ho sakti hai; opposite conditions mein Negative. Is data ko Smooth aur True Range ke relation mein Normalize kiya jata hai. Isliye +DI aur -DI World-Wide Buyers/Sellers ki Count nahi. Indicators historical High, Low aur volatility movement ke mathematical relationships hain. Institutional Order Book directly show nahi hoti.
ADX CALCULATION KAISE BANTI HAI?
Simplified method mein +DI aur -DI smoothed directional changes divided by smoothed True Range se derived hotay hain. DX = 100 × Absolute(+DI−-DI)/(+DI+-DI), jab denominator valid ho. Phir ADX selected Period, commonly 14, ke mutabiq DX ki smoothed average hoti hai. Isi wajah se Price Momentum slow hone ke baad bhi ADX kuch waqt elevated reh sakti hai. Lagging smoothing future reversal timing guarantee nahi. Indicator formula aur actual Price Pattern dono samjhein.
ADX 20 AUR 25 THRESHOLDS
Trading Community ADX 20 ya 25 ko Trend Strength reference ke taur par use karti hai. Lekin ye universal magic border nahi. M5 par CPI Release ke waqt ADX 35 aur H4 Established Trend par ADX 35 ka context different ho sakta hai. ADX ka Level, Slope, H4 Higher High/Higher Low ya Lower High/Lower Low aur Market Range condition ko combine karein. Very High ADX late trend phase bhi show kar sakta hai jab best Entry pehle miss ho chuki.
BEARISH GBP/USD CASE
GBP/USD H1 Lower Highs aur Lower Lows bana rahi hai. -DI, +DI se above hai aur ADX 20 se 30 rise karti hai. Ye Bearish Directional Strength ka possible clue hai. Lekin agar Price H4 Demand ke bilkul qareeb aa gayi hai to aur Sell Entry ki Target Space limited ho sakti hai. Strong Downtrend show hona aur is Price par New Trade Financially sensible hona alag decisions hain. Structural SL aur Opposing Demand ke darmiyan RR evaluate karein.
EUR/USD BULLISH CASE
EUR/USD H4 par confirmed Uptrend hai. +DI, -DI se upar aur ADX rising hai. Bullish Trend Context supportive ho sakta hai. Lekin Trend Direction samajhne ke baad H1 Demand Pullback ka wait karein. M5 par completed Bullish Engulfing ya CHoCH aaye to Trade Evaluate karein. SL meaningful rejection Swing Low ke beyond aur TP Nearest H1 Supply ke mutabiq ho. Indicator khud Entry Price, Stop Distance aur Lot Size calculate nahi karta.
FALLING ADX = BEARISH REVERSAL?
Nahi. Strong Uptrend mein ADX decline kar sakta hai jab bullish trend ki measurable acceleration slow ho, lekin Price abhi bhi Higher Highs bana rahi ho. Ye weakening Momentum ka clue ho sakta hai, guaranteed Sell Signal nahi. Market gradual upward continue ya Sideways Consolidate bhi kar sakti hai. M5 Bearish CHoCH ya H1 important Higher Low Break ke baghair Downtrend assume karna early ho sakta hai. Falling ADX Directional Label nahi.
DI CROSSOVERS AUR RANGE
+DI, -DI ko upar cross kare to Bullish Directional Shift possible. Lekin H1 Sideways Range mein lines repeated cross kar sakti hain. Agar ADX Low aur Price Range Midpoint par hai to Strategy Filter fail ho sakta hai. Strong News Candle ke baad DI Cross late bhi aa sakti hai. Pehle decide karein Crossover ke baad kitni candles tak Trigger valid, kya H4 Bias compulsory, aur kya M5 Full Close chahiye. Historical Winners dekh kar Rules change na karein.
NUMERICAL DX EXAMPLE
Agar hypothetical +DI 35 aur -DI 15 hai to DX = 100 × (35−15)/(35+15) = 40. Lekin DX 40 automatically ADX 40 nahi, kyun ke ADX DX ki historical smoothing include karta hai. Aur DX 40 ka matlab 40% chance of winning trade bhi nahi. Ye Mathematical Strength Indicator hai, Probability Calculator nahi. Original Formula aur Signal Line Interpretation clear karein. Different Platform Display Precision se values slightly vary kar sakti hain.
MARKET REGIME FILTER
Kuch Trend-Following Strategies ADX selected threshold ke upar aur H4 aligned Swing Structure compulsory rakhti hain. Kuch Low ADX Range mein New Trend Entries avoid karti hain. Lekin High Threshold Signals Late kar sakta hai, jabke Low-ADX Filter early genuine breakout miss kara sakta hai. Apni Strategy ke Trend vs Range historical outcomes compare karein. Sirf popular ADX 25 number ko har Forex Pair par blindly apply na karein. Filter Net Expectancy improve karta hai ya nahi, test karein.
ADX + EMA 50
EMA 50 Rising ho aur ADX Rising ho to Bullish Trend Context align ho sakta hai. Lekin dono Indicators past Price Data se derived hain, do independent institutional confirmations nahi. H1 Demand, H4 Structure aur M5 Completed Candle alag role play karte hain. Har Tool ke liye clear purpose rakhein: EMA Direction Context, ADX Strength, H1 Zone Location, M5 Trigger. Agar extra Indicator actually Decision Change nahi karti to Chart unnecessarily complex karne ki zaroorat nahi.
ADX VS ATR
ADX Directional Trend Strength estimate karta hai. ATR selected Period ki price-range volatility measure karta hai. Sideways Market mein ATR high ho sakta hai due to two-sided large candles, jabke clear one-direction trend absent ho. ADX increase ho sakta hai bina exceptionally large Dollar Price Range ke. Dono Indicator Terms interchangeable nahi. RSI bhi separate formula se Gains/Losses ki relationship describe karta hai. Multiple Indicators ko correct purpose ke saath combine karein.
NEWS AUR ADX
NFP, CPI aur Fed Data par Price sudden reprice hoti hai. DI Values aur ADX readings bhi subsequent Candles ke saath update hoti hain. Lekin ADX High Reading News Slippage, Wide Spread ya contradictory Macro Signals ko prevent nahi karti. London Open ki sharp move bhi temporary ho sakti hai. Economic Calendar aur Session log karein. Agar News Avoid Plan hai to Indicator favorable hone ke bawajood event window skip karein.
RISK MANAGEMENT
Entry se pehle H1 Zone aur clear Setup Condition likhein. Actual Structural SL define karein aur Equity Risk se Lot Calculate karein. Nearest Opposing Support/Supply tak Target Space dekhein. Agar SL wide aur Profit Target close ho to ADX 40 par bhi Trade Skip ho sakti hai. High ADX ka matlab 2% ya 5% extra Risk justify nahi. Stop Loss guarantee fill price nahi, aur Market Conditions rapidly change ho sakti hain.
ADX BACKTEST
Period, Threshold, ADX Rising/Falling Rule, +DI/-DI Order, H4 Bias, H1 Setup aur M5 Entry Confirmation fix karein. Har Valid Historical Signal record karein. Winning/Losing Trades, Total Costs, Average Net R aur Maximum Drawdown assess karein. Low-ADX Ranges aur Strong Trends mein Results separately dekhein. ADX Filter ke saath aur bina ADX Filter same Setup compare karein. Agar Tool Net Outcome improve nahi karta to simpler rules acceptable hain.
FAQ
ADX Falling Market mein increase ho sakta? Haan. ADX 30 guaranteed continuation? Nahi. +DI real Buyer Lots? Nahi. Falling ADX immediate reversal? Nahi. Range mein DI repeated Cross? Haan. Confirmation Candle incomplete ho aur ADX rising? Written Close Rule hai to No Trade.
ADX KO QUESTION KE TOR PAR USE KAREIN
ADX rise kare to sawal karein Market ke actual H1 Swing Highs/Lows kis direction progress kar rahe hain? Kya Price Previous Day High ke qareeb H4 Supply par pohanch gayi? Agar haan to New Buy Entry automatically sensible nahi, chahe ADX strong ho. Existing position ka planned Management ya Flat Rehna valid ho sakta hai. Agar Structural Stop Equity Budget se large hai to Lot reduce karein. Trend Strong hona responsible Risk Management cancel nahi karta. ADX Value ko 70% Winning Probability samajhna mathematical error hai.
OUT-OF-SAMPLE BACKTEST EXERCISE
Pehle EUR/USD H1 Historical Training Period select karein. Fixed Rules likhein: ADX above 25, +DI > -DI, H4 Bullish Structure, H1 Demand aur M5 completed Bullish Candle. Phir Later Unseen Period par same rules apply karein. Har Losing Example par ADX Threshold 24 ya 27 kar ke change na karein. ADX Filter wali Strategy aur without ADX plain H4/H1 Setup ka Net R, Drawdown aur Costs compare karein. Kya ADX weak trades eliminate karti hai ya winners bhi miss? Is analysis se additional indicator ki real usefulness samajh aayegi.
PIPSEPAISA FREE COURSES
Sir Sajid Khan Ghori ke Free Forex Technical Analysis Course mein Price Action, Market Structure aur Confirmation seekhein. Sir Ghulam Abbas ke Free Forex Fundamental Analysis Course mein Gold aur Forex ke Economic Data ka concept samjhein. www.pipsepaisa.com par Courses Tab se Enrollment Instructions check karein. Course Profit ki guarantee nahi.
DISCLAIMER
Ye sirf educational content hai. Koi Indicator, Pattern ya News guaranteed signal nahi. Structural Stop Loss, Account Risk, Spread aur Completed M5 Confirmation ka wait karein. No Confirmation = No Trade.
Educational content only. Trading involves risk. Always use independent analysis and appropriate risk management.