
Stochastic Oscillator in Forex: %K, %D, Overbought/Oversold and Crossovers
PipSePaisa • Forex Education & Research
INTRODUCTION
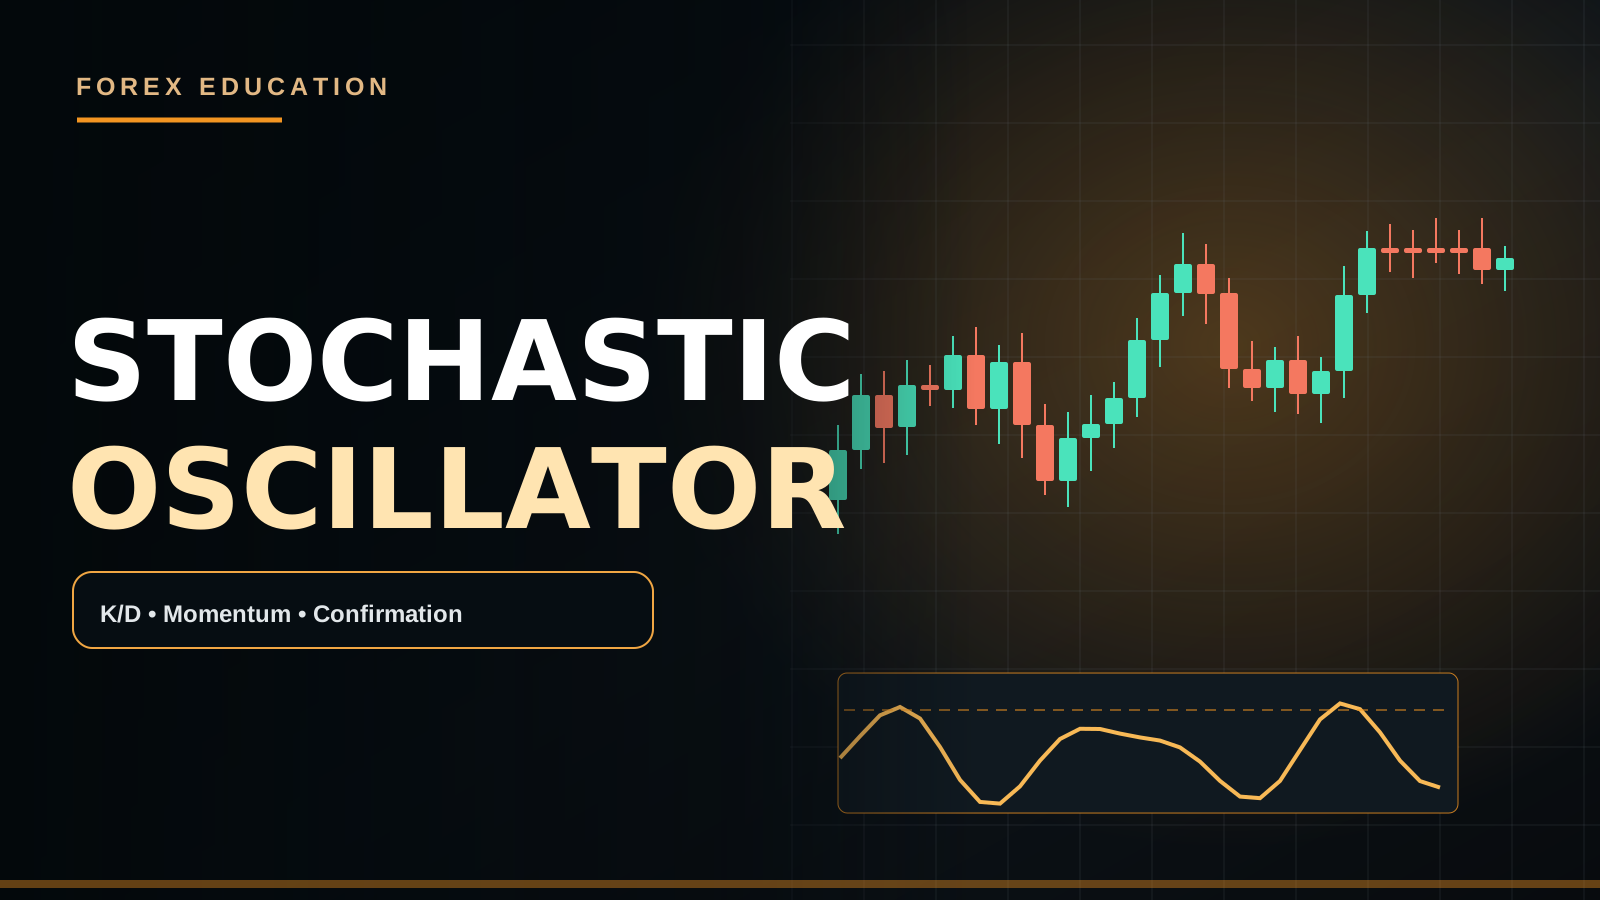
The Stochastic oscillator compares a current close with a recent high-low range. Common settings such as 5,3,3 or 14,3,3 smooth %K and %D lines, and readings near twenty or eighty describe location within a range.
PRACTICAL MARKET EXAMPLE
In a strong Gold downtrend, both lines can remain below twenty through several additional lower lows. A crossover alone can fail; the trader may need H1 demand plus a completed bullish structure shift.
IMPORTANT LIMITATIONS
Crossovers drawn from an unclosed candle can disappear. The fast stochastic oscillator is particularly sensitive to noise.
THE STOCHASTIC RANGE FORMULA
The fast stochastic %K is commonly calculated as (Close − Lowest Low) / (Highest High − Lowest Low) × 100 for a selected lookback window. If the closing price is near the highest observed price in the window, the reading approaches one hundred; if near the lowest, it approaches zero. The signal %D is usually a moving average of %K, and settings may apply additional slowing. It is a price-location oscillator, not a measurement of total institutional Buy or Sell volume.
SETTINGS 5,3,3 VERSUS 14,3,3
A 5,3,3 Stochastic uses a shorter core lookback than a 14,3,3 configuration and can respond quickly to changes in recent price location. Fast responses can produce more signal frequency and more whipsaws. Longer lookbacks tend to smooth some fluctuations but may appear later. The three parameters should be documented precisely because %K period, slowing and %D smoothing affect the indicator differently. A common setting is not a guarantee of edge.
WHAT ABOVE EIGHTY ACTUALLY MEANS
A Stochastic reading above eighty generally means price has closed toward the upper portion of its recent observed high-low range. It does not establish that an asset is intrinsically overpriced. In a strong EUR/USD uptrend, closing near recent highs is exactly what advancing prices often do, so the oscillator can remain Overbought for numerous candles. Blindly selling every reading above eighty can conflict with prevailing structure and produce repeated losses.
WHAT BELOW TWENTY MEANS
Below twenty means the close lies toward the lower portion of the lookback range under the calculation. That is a momentum-location observation, not a guaranteed Buy Zone. During a major USD-strengthening event, Gold can make repeated new lows and remain oversold as each new decline refreshes the observation window. Trading against that movement without H1 Demand and price confirmation is not inherently safer because the oscillator displays a low number.
%K AND %D CROSSOVERS
Some trading approaches call a %K cross above %D bullish and a cross below bearish. The position of the crossover—below twenty, near fifty or above eighty—can affect context. However, the lines can cross repeatedly within a trend or a narrow range. A bullish crossover that occurs under H1 resistance and within an H4 downtrend is not equivalent to a bullish crossover after a sell-side sweep at major Demand. Define the setup's required location.
AN EUR/USD BUY EXAMPLE
Suppose H4 has a confirmed uptrend while H1 pulls back into a Support/Demand band. M15 Stochastic drops below twenty. A small bullish %K/%D crossover appears, but the trader waits until M5 actually closes above a minor Lower High with a bullish engulfing candle. That additional step converts an oscillator observation into a more specific price-action trigger. Stop Loss can be placed beyond the meaningful rejection swing and the volume calculated from monetary risk. If the nearest opposing Supply is close, standing aside can still be correct.
A GBP/USD SELL EXAMPLE
GBP/USD remains in a bearish H4 structure and makes an H1 rally into previously broken Support now acting as Resistance. Stochastic on M15 reaches above eighty, then %K crosses below %D. A conservative trader may require a completed bearish M5 CHoCH and a Lower High rather than selling at the first crossover. A new Bank of England report could drive GBP higher regardless of the oscillator reading, so invalidate the bearish thesis if price decisively reclaims the zone.
STOCHASTIC IN SIDEWAYS MARKETS
Stochastic can provide intuitive high-low positioning during a clear price range, especially when it moves from one extreme toward the other. But the middle of the range can create noisy alternating crosses with little reward. Define horizontal Support/Resistance before examining oscillator extremes. A range-reversion strategy may take different exits from a trend-continuation strategy, so data for each model should be separated. If the market begins a breakout, the original range model may stop being suitable.
STOCHASTIC IN STRONG TRENDS
During a strong advance, repeated readings above eighty may accompany continuing higher highs. Some traders use oscillator pullbacks as opportunities to rejoin the trend when H1 structure is bullish, rather than treating high readings as reasons to short. During persistent declines, a bounce toward middle readings can still be a correction within a downtrend. The same numerical Stochastic reading can therefore support very different hypotheses depending on the larger market regime.
DIVERGENCE AND ITS LIMITATIONS
If price forms a lower low while Stochastic forms a higher low, traders may identify bullish divergence. If price creates a higher high with lower oscillator high, bearish divergence may appear. These are signs that the relative closing location within the recent range has changed, not proof of imminent reversal. Oscillator saturation, different swing selections and trend continuation can all generate misleading divergence signals. Require completed bars and pre-defined swing anchors when testing.
STOCHASTIC VERSUS RSI
RSI compares smoothed gains and losses, whereas Stochastic compares the close with a selected high-low range. Their readings can diverge because the formulas respond to different price properties. But both derive from the same underlying price history, making them correlated tools rather than two independent measurements of institutions. Decide whether each indicator adds distinct value to the setup. Overcrowded charts can confuse a simple H1 zone and M5 confirmation process.
NEWS AND OVEREXTENDED READINGS
Before CPI, NFP or a major central-bank rate announcement, an Overbought Stochastic reading may be temporarily irrelevant to the next catalyst. New information can cause price to shift so quickly that a crossing signal becomes a reflection of the first large news candle. Spreads may widen and Stops may slip. If your method excludes event windows, do not break that rule because the oscillator suddenly reached the other extreme.
STOCHASTIC ON COMPLETED CANDLES
On a forming M5 candle, the current Close in the Stochastic formula is not yet final. As the price moves during the five-minute interval, %K and %D values can change and earlier crosses may disappear. Use a close-only signal if your backtest uses completed historical candles. Never compare early live alerts with perfected historical signals without accounting for the mismatch. Waiting until close can reduce false early impressions but may worsen entry price; both effects matter.
RISK MANAGEMENT AND POSITION SIZING
A Stop Loss belongs beyond the relevant price level that would contradict the thesis, not at the Stochastic twenty or eighty line. If the technical Stop is thirty pips away and the acceptable loss is $6, volume must make pip value approximately $0.20 before costs. Broker specifications can affect that estimate. A Take Profit should consider the next Support/Supply, not just a stochastic return to the opposite extreme. Avoid multiplying lot sizes after a losing cross.
A STOCHASTIC BACKTEST CHECKLIST
Fix the %K period, slowing, %D period, price calculation, timeframe, threshold zones, direction filter, zone location and required candle-close trigger. Is a cross valid only inside twenty/eighty areas or at any level? Is H4 alignment compulsory? Is a retest required? Does news invalidate the setup? Document all outcomes and net costs. Do not change settings to erase losses in historical charts. A visually perfect oscillator curve can still produce a negative expectancy trading strategy.
FREQUENTLY ASKED QUESTIONS
Is Stochastic eighty always Sell? No. Does twenty mean buyers must appear? No. Can %K cross several times in one range? Yes. Will a 5,3,3 configuration always beat 14,3,3? No. Can an H4 downtrend include a bullish Stochastic crossover? Yes, during pullbacks. Should completed M5 confirmation be skipped when Stochastic crosses? Not if the trading plan requires it.
A NUMERICAL STOCHASTIC EXAMPLE
Suppose the highest EUR/USD price over the selected lookback is 1.1100, the lowest 1.1000, and the latest completed close 1.1080. The raw %K reading is (1.1080−1.1000)/(1.1100−1.1000)×100 = 80. This describes the close being eighty percent of the way from the low to the high of that window, not an eighty-percent probability of a Sell. A different smoothing setting will change the plotted line, while a new high or low alters the range being measured.
DIVISION BY ZERO AND DATA QUALITY
If the selected period's Highest High equals its Lowest Low, the denominator in the raw formula becomes zero. Platforms handle such edge cases according to their code, for example by carrying or substituting a value. Data feeds with tiny price ranges or abnormal ticks may behave differently. For realistic interpretation, compare completed candle values and test the specific MT5/TradingView implementation rather than assuming every oscillator version must match perfectly.
WHEN THE INDICATOR ADDS LITTLE VALUE
If H1 Support/Demand is clearly marked and a completed M5 bullish market-structure shift has already occurred, adding Stochastic should be evaluated by whether it filters weaker trades or merely repeats recent price information. A crossover might appear late, after the attractive entry has passed. Compare actual outcomes with and without the oscillator. A useful indicator earns its place by improving measurable decisions, not by generating an attractive second green confirmation.
PIPSEPAISA FREE COURSES
For structured technical analysis education, explore the Free Forex Technical Analysis Course with Sir Sajid Khan Ghori. To understand the economic context behind Forex and Gold, explore the Free Forex Fundamental Analysis Course with Sir Ghulam Abbas. Visit www.pipsepaisa.com and select Courses for enrollment instructions. Courses and trading content cannot guarantee profit.
RISK DISCLAIMER
This is for education only. No indicator, chart pattern or economic release guarantees a trading outcome. Always calculate potential account loss, consider spreads and slippage, and wait for completed confirmation before trading.
Read in Roman Urdu
INTRODUCTION
Stochastic Oscillator current Close ko selected recent High/Low Range ke saath compare karta hai. Settings 5,3,3 ya 14,3,3 common hain. %K/%D aur 20/80 Zones price position show karte hain, certain reversal nahi.
PRACTICAL EXAMPLE
Gold Strong Downtrend mein Stochastic 20 ke neeche multiple Candles reh sakta hai. Sirf Bullish Cross par Buy ke bajaye H1 Demand aur completed M5 Bullish Shift evaluate karein.
LIMITATIONS
Open Candle ka Stochastic Cross closing se pehle disappear ho sakta hai. Fast Settings mein Noise zyada aa sakta hai.
STOCHASTIC OSCILLATOR FORMULA
Fast Stochastic %K generally (Current Close − Lowest Low)/(Highest High − Lowest Low) ×100 ke formula se calculate hoti hai. Agar Close recent High/Low Range ke upper portion par ho to %K near 100, lower portion par ho to near Zero. Signal %D usually %K ki Moving Average hoti hai aur Slowing Parameter extra smoothing apply kar sakta hai. Ye Price Location Oscillator hai, world-wide Bank Buy/Sell Orders ya real centralized Volume ka Indicator nahi.
STOCHASTIC 5,3,3 AUR 14,3,3
5,3,3 ki initial High/Low Lookback chhoti hoti hai, is liye recent Price Changes par relatively faster react kar sakti hai. 14,3,3 longer lookback use karta hai aur kuch noise smooth kar sakta hai. Lekin Fast Settings mein zyada Crossovers aur False Signals possible hain. Teen Values %K Period, Slowing aur %D Smoothing specify karti hain. Different Settings par same Chart mein Signals different ho sakte hain. Common Preset hona profitability ki guarantee nahi.
80 OVERBOUGHT KA MEANING
Stochastic 80 se upar ho to Price apne recent Observation Range ke upper part ke qareeb close ho rahi hai. Iska matlab Asset objectively expensive ya guaranteed downward reversal nahi. EUR/USD Strong Uptrend mein multiple Candles recent Highs ke paas close kar sakti hain, Stochastic 80 ke upar reh sakti hai aur Price aur Higher High bana sakti hai. Sirf 80 par Sell karna H4 Bullish Structure ke against repeatedly fail ho sakta hai.
20 OVERSOLD KA MEANING
Stochastic 20 se neeche ka matlab recent Close selected High/Low Range ke lower portion mein hai. Ye guaranteed Buying Zone nahi. USD unexpectedly strong ho aur Gold decline kare to consecutive Candles New Lows bana sakti hain aur Indicator Oversold remain kar sakta hai. H1 Demand, Selling Slowdown aur M5 Bullish Confirmation ke baghair Oversold Reading par Blind Buy unnecessary risk hai. Range ka relative close position aur asset value alag concepts hain.
%K AUR %D CROSSOVER
%K %D ke upar cross kare to kuch strategies Bullish Cross aur neeche kare to Bearish Cross kehti hain. Lekin Cross kahan hua? Below 20? Near 50? Above 80? Aur H4 Trend kya hai? H1 Resistance ke neeche Bullish Cross different context hai, jabke Sell-Side Sweep ke baad H1 Demand par Bullish Cross different. Lines ek Range mein multiple baar cross kar sakti hain. Crossover ko full strategy na samjhein.
EUR/USD BUY CASE STUDY
EUR/USD H4 Uptrend mein Higher Highs/Higher Lows banati hai aur H1 Demand tak Pullback karti hai. M15 Stochastic 20 se neeche aati hai. %K %D ke upar Bullish Cross show kare. Lekin trader M5 Local Lower High ke upar completed Bullish Engulfing Close ka wait kare. Tab possible Buy Continuation consider ho sakti hai. Stop Loss meaningful rejection Swing Low ke beyond aur Lot Monetary Risk se calculate ho. Nearest Supply qareeb ho to trade Skip ho sakti hai.
GBP/USD SELL CASE STUDY
GBP/USD H4 Downtrend hai aur H1 Broken Support ka Retest Resistance ke taur par karti hai. M15 Stochastic 80 se upar move karti hai aur %K %D se neeche cross karti hai. Lekin direct Sell ke bajaye M5 Bearish CHoCH aur Lower High confirm karein. Agar Bank of England Unexpected News Pound strong kare aur H1 Supply ke upar Price hold kar le to original Sell Idea weak ho sakti hai. Oscillator surprise Economic News ko cancel nahi karti.
SIDEWAYS MARKET STOCHASTIC
H1 Sideways Range mein Price repeated Support/Resistance test karti hai aur Stochastic high/low extremities ke darmiyan oscillate kar sakti hai. Range Reversion Strategy horizontal Zone + Stochastic Extreme + M5 Rejection combine kar sakti hai. Lekin Range Middle mein alternating Crosses unnecessary trades de sakti hain. Range Breakout start ho to old Mean-Reversion Rules invalid ho sakte hain. Trend Continuation aur Range Reversion ke historical results separate rakhein.
STRONG TREND MEIN STOCHASTIC
Strong Bullish Trend mein Stochastic 80 se upar repeated readings de sakti hai jab Price Higher Highs banati hai. Kuch Trend Traders Oversold Cross ki jagah H1 Higher Low Pullback ke context mein Oscillator Recovery observe karte hain. Strong Bearish Trend mein 20 ke neeche readings continuation ke dauran rehti hain. Ek Stochastic Number different Market Regimes mein different interpretation carry karta hai. Indicator pehle nahi, Trend Context pehle analyze karein.
STOCHASTIC DIVERGENCE
Price Lower Low banaye aur Stochastic corresponding Higher Low to Bullish Divergence possible. Price Higher High aur Indicator Lower High ho to Bearish Divergence. Lekin ye relative Closing Position mein change hai, guaranteed Market Reversal nahi. Strong Trend Divergence ke bawajood continue kar sakti hai. Oscillator Saturation aur different Swing Point Selection False Signals de sakte hain. Completed Candles aur consistent Swing Rule use karein. Historical Chart outcome dekh kar Divergence Line shift na karein.
STOCHASTIC VS RSI
RSI Average Gains aur Average Losses compare karta hai, Stochastic Current Close ko recent High/Low Range ke andar measure karta hai. Dono formulas different hain, lekin same underlying Market Prices se derive hotay hain. Is liye RSI Oversold aur Stochastic Oversold ek saath ho to completely independent Institutional Buying Evidence nahi. H1 Demand, Swing Structure aur M5 Rejection ka separate analytical value ho sakta hai. Too Many Indicators decision ko confuse kar sakte hain.
NEWS AUR OVERBOUGHT OVERSOLD
CPI, NFP, Fed ya BoE Event ke waqt Stochastic 80/20 Reading Market Direction predict nahi kar sakti. New Economic Information Price ko sudden reprice kar sakti hai aur Indicator first big Candle ke baad adjust hoga. Spread aur Slippage Risk bhi increase ho sakta hai. Agar Strategy Major News Avoid karti hai to Stochastic Cross ke liye apna Event Filter break na karein. Risk Budget aur Broker Conditions verify karein.
M5 COMPLETED SIGNAL WAIT
Forming M5 Candle ka Close abhi final nahi. %K/%D Calculation Candle ki developing Price ke saath move karti hai. Pehle Bullish Cross show ho aur last minute mein disappear bhi ho sakti hai. Historical Backtest full Completed Candles use karta hai, is liye live early Signals ko direct same results mat samjhein. M5 Full Close ka wait conservative filter ho sakta hai, lekin Late Entry aur RR ki trade-off bhi evaluate karein.
STOP LOSS TP LOT SIZE
Stochastic 20 ya 80 par SL lagti nahi. Price-Based meaningful Swing High/Low aur Zone Invalidation Stop Reference banta hai. Agar Technical Stop 30 Pips aur Allowed Loss $6 ho to approximate Required Pip Value $0.20 hai, fees se pehle. Broker Pip/Tick Value confirm karein. TP nearest Opposing H1 Supply/Demand ya Tested RR method se set karein. Losing Cross ke baad Lot Double karna positive edge create nahi karta.
STOCHASTIC BACKTEST RULES
%K Period, Slowing, %D, Timeframe, 20/80 Levels, H4 Bias, H1 Zone aur M5 Candle Close ki exact conditions likhein. Cross sirf extremes mein valid? News Avoid? Retest mandatory? SL Structure? TP Range Midpoint? Har Matching Signal record karein, Winning aur Losing dono. Different Settings ko Historical Winners match karne ke liye change karte rehna Overfitting ho sakta hai. Commission/Spread se Net Expectancy calculate karein.
FAQ
80 = Guaranteed Sell? Nahi. 20 = Guaranteed Buy? Nahi. Kya ek Range mein multiple Cross possible? Haan. 5,3,3 Always Best? Nahi. H4 Downtrend mein Bullish Stochastic Cross? Haan, temporary pullback mein. M5 Confirmation na mile to entry? No Confirmation = No Trade.
STOCHASTIC NUMERICAL EXAMPLE
Maan lein selected EUR/USD Period ka Highest High 1.1100, Lowest Low 1.1000 aur latest Completed Close 1.1080 hai. Raw %K = (1.1080−1.1000)/(1.1100−1.1000)×100 = 80. Iska matlab Close High-Low Range mein Lower Boundary se 80% Distance par hai. Ye next Candle 80% chance se Sell hogi, aisa probability number nahi. Slowing aur %D Smoothing settings se displayed line different ho sakti hai. New High/Low se calculation window change hogi.
ZERO PRICE RANGE SPECIAL CASE
Agar selected Period mein Highest High aur Lowest Low exactly equal ho to Formula ka Denominator Zero ban sakta hai. Different Trading Platforms apne Code mein is exceptional situation ko different handle kar sakti hain, jaise previous value carry ya other fallback. Very small price ranges ya abnormal ticks Indicator ko affect kar sakte hain. MT5 aur TradingView par same symbol, Settings, Timeframe aur completed bar data compare karein. Har Custom Stochastic Indicator identical code use nahi karta.
INDICATOR KAB EXTRA HELP NAHI KARTA?
Agar H1 Demand Zone clear hai aur M5 completed Bullish Structure Shift mil chuki hai, to Stochastic add karne ka reason measurable hona chahiye. Kya Indicator Weak Trades filter kar rahi hai ya sirf same Recent Price Movement dobara Green signal bana rahi hai? Kya Cross itni Late aati hai ke Entry ka RR poor ho jata hai? With Stochastic aur Without Stochastic Data compare karein. Sirf two bullish indicators ka ek saath nazar aana automatic Profit Guarantee nahi.
PIPSEPAISA FREE COURSES
Sir Sajid Khan Ghori ke Free Forex Technical Analysis Course mein Price Action, Market Structure aur Confirmation seekhein. Sir Ghulam Abbas ke Free Forex Fundamental Analysis Course mein Gold aur Forex ke Economic Data ka concept samjhein. www.pipsepaisa.com par Courses Tab se Enrollment Instructions check karein. Course Profit ki guarantee nahi.
DISCLAIMER
Ye sirf educational content hai. Koi Indicator, Pattern ya News guaranteed signal nahi. Structural Stop Loss, Account Risk, Spread aur Completed M5 Confirmation ka wait karein. No Confirmation = No Trade.
Educational content only. Trading involves risk. Always use independent analysis and appropriate risk management.