
Triangle Chart Patterns: Ascending, Descending and Symmetrical Forex Breakouts
PipSePaisa • Forex Education & Research
INTRODUCTION
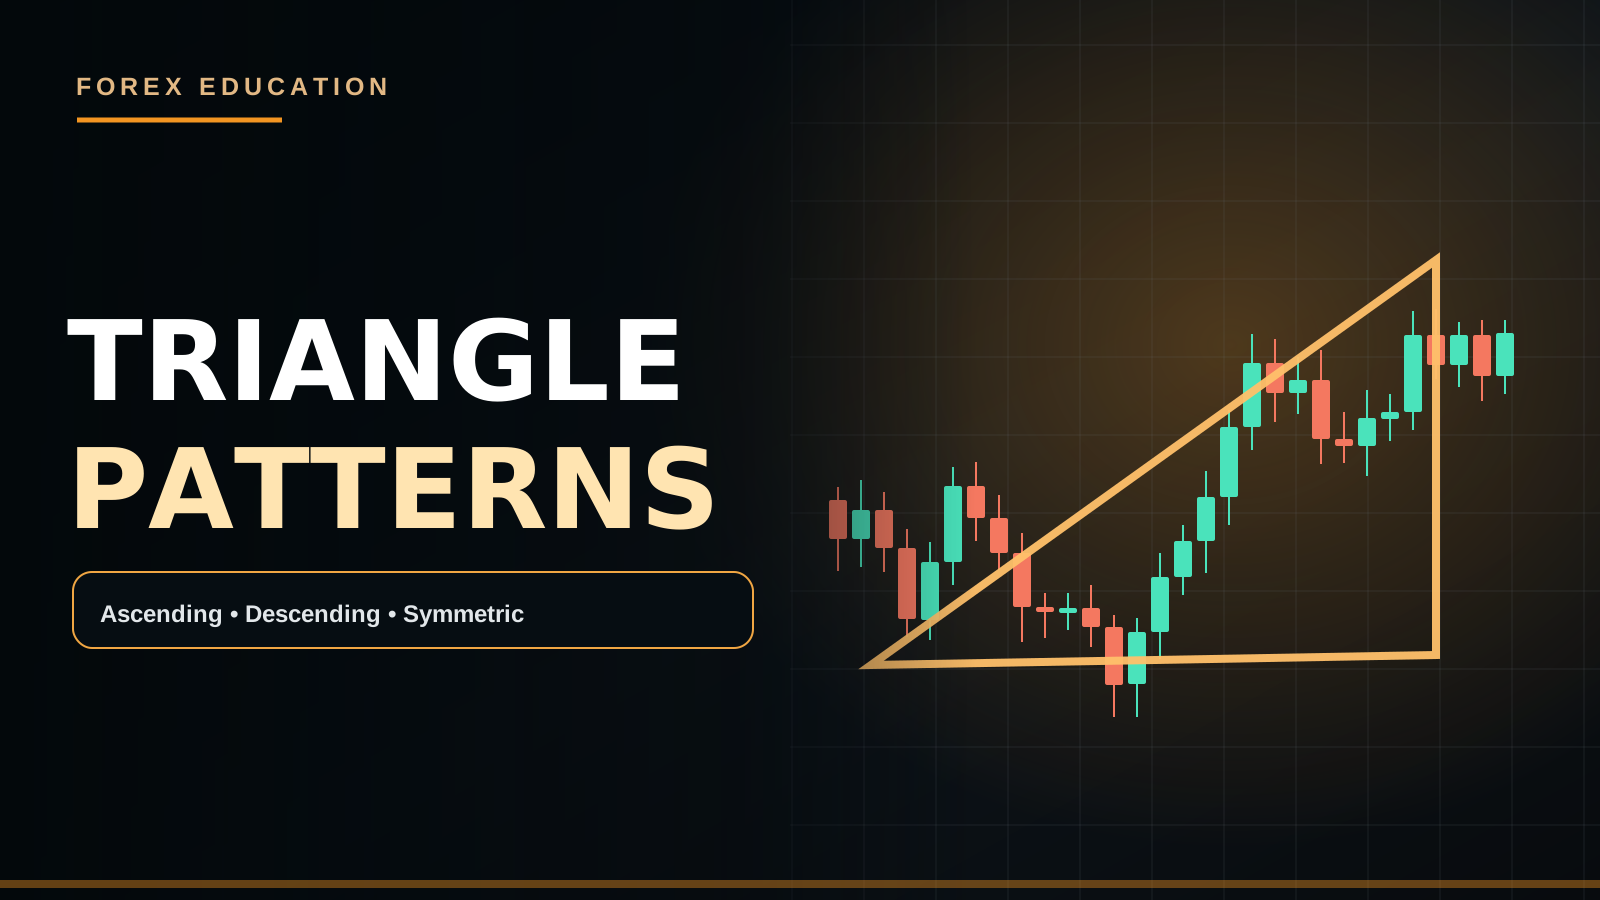
A triangle is a narrowing price structure with converging boundaries. Ascending triangles often show relatively flat highs and rising lows; descending triangles the inverse; symmetrical triangles feature converging descending highs and ascending lows.
PRACTICAL MARKET EXAMPLE
A triangle near EUR/USD H1 resistance may eventually break upward or downward. Breakout candle close, follow-through and retest are more informative than simply assuming ascending means bullish.
IMPORTANT LIMITATIONS
Late-stage triangles can lose momentum, and false breaks can be common around scheduled releases.
WHAT A TRIANGLE REPRESENTS
A Triangle is a contracting chart structure where recent highs, lows or both converge toward a smaller price interval. It is widely studied by price-action traders, but it is a geometric description of historical swings rather than a machine that predicts an exact breakout direction. Some triangles resolve with momentum continuation, some fail on the first break, and others expand into a larger sideways range. Identify the formation before the breakout; drawing converging lines after a successful move can create hindsight bias.
ASCENDING TRIANGLE GEOMETRY
An Ascending Triangle often has relatively similar swing highs at an upper horizontal Resistance area and progressively higher swing lows beneath. The rising lower boundary suggests buyers have been accepting higher pullback prices, but this does not prove they must overcome the Resistance. A seller might also defend the upper zone repeatedly. The eventual break can occur upward or downward. Some analysts prefer confirmation above the flat upper edge, while others examine a breakdown beneath the rising lower trendline.
DESCENDING TRIANGLE GEOMETRY
A Descending Triangle commonly exhibits relatively flat lows near Support and lower highs compressing toward that boundary. The bearish-looking series of lower highs may be consistent with repeated selling pressure, but major demand could still produce a strong upside reversal. A confirmed close below the flat lower zone gives different information from a wick beneath it that is quickly reclaimed. Classify the pattern as a conditional hypothesis, not a rule that descending geometry guarantees a bearish outcome.
SYMMETRICAL TRIANGLE GEOMETRY
A Symmetrical Triangle has lower swing highs and higher swing lows, producing two converging diagonal lines. This reflects price compression without a clear horizontal boundary. Some trend-continuation methods follow the direction of the impulse preceding the triangle, but the breakout can oppose that impulse. The number of valid touches, magnitude of swing reduction and remaining target room can influence how a strategy ranks a setup. These factors should be defined before the price breaks the pattern.
THE IMPORTANCE OF SWING POINTS
Two highs can be connected to form an upper trendline, and two lows an opposing lower line. That alone does not guarantee that market participants consider the shape significant. On M1, hundreds of tiny formations may exist inside a single H1 consolidation candle. A strategy should specify the chart timeframe, minimum swing separation, acceptable overlap, how far price can pierce a trendline and whether the structure still counts after several false breaks. Consistency matters more than attractive drawings.
HOW BREAKOUT CONFIRMATION WORKS
A completed M15/H1 candle close outside a pre-marked Triangle boundary can indicate that price has moved beyond the observed contraction. But there are no guarantees about continuation. The next candles might hold outside, retest the broken trendline or return into the old formation. A trader can require a completed retest and an M5 higher low after an upside break. This provides a clearer trigger than reacting to an unfinished wick during a fast session.
ASCENDING EUR/USD EXAMPLE
Suppose EUR/USD H1 repeatedly tests Resistance near 1.1050 while successive lows form around 1.0990, 1.1010 and 1.1030. The rising lows and stable highs resemble an Ascending Triangle. A completed H1 close above 1.1050 and later pullback that holds the boundary may offer a possible continuation setup. Stop Loss belongs beyond the meaningful retest structure, and the next H1 Supply determines target room. If price instead breaks 1.1030 downward and lower support fails, the bullish thesis weakens.
DESCENDING GBP/USD EXAMPLE
GBP/USD H1 tests Support near 1.2700 while rebound highs decrease from 1.2780 to 1.2750 and 1.2730. A completed H1 close beneath 1.2700 followed by an unsuccessful retest may be consistent with bearish continuation. A confirmed M5 Lower High can be a trigger under some systems. But Bank of England policy news could drive the pound sharply upward and invalidate the pattern. The Triangle provides a scenario to monitor, not immunity from macroeconomic surprises.
SYMMETRICAL GOLD EXAMPLE
Gold rallies, then forms lower highs and higher lows on M15. If the H4 trend remains bullish, a trader might prefer an upside breakout with full close, retest and M5 confirmation. Yet price can break downward, especially if real yields suddenly rise. A trader should not enter a Buy simply because the pattern occurred after a rally. The measured movement of the earlier impulse, nearby H1 Demand and Resistance, and economic calendar all matter for realistic planning.
MEASURED-MOVE TARGETS
Some Triangle systems measure the widest vertical height of the formation and project it beyond the breakout point. This is a geometric reference, not a guaranteed target. If the measured height is seventy pips, a projected seventy-pip move might be interrupted by historical H1 Supply after thirty pips. A trader can compare the projection with real structural obstacles. If the Stop Loss required for the trade is larger than available plausible reward, skip even when the Triangle breaks cleanly.
FALSE BREAKOUTS AND LIQUIDITY
Price can trade briefly above the upper boundary, activate Buy Stops, then close back inside the Triangle. A downside sweep can behave similarly. Sometimes the market later breaks the same side again with real follow-through. The chart does not prove a specific participant deliberately hunted retail orders. A confirmation rule such as 'M15 body close outside and successful retest' may filter some fakeouts while missing fast genuine moves. Measure both consequences in a historical sample.
VOLUME INTERPRETATION
Futures volume may be reported centrally for its exchange, while retail Spot Forex tick volume is usually a broker-specific activity proxy. Some traders look for higher volume during Triangle breakouts, but a spike alone cannot establish that future continuation is guaranteed. Distinguish the volume source and whether an unusually large candle was triggered by scheduled data. If volume is used as a filter, define its calculation and use the same feed in live observation and backtesting.
H4 H1 M5 WORKFLOW
Begin with H4 directional structure and major Supply/Demand zones. On H1, identify a Triangle whose boundaries are fixed before breakout. Use M15 to observe the completed crossing or rejection. On M5, wait for the specified Engulfing/CHoCH/Retest confirmation. Then calculate the Stop Loss against meaningful price structure and check target space. If H4 is bearish and the Triangle breaks upward, label it as a possible countertrend setup under a separate model rather than quietly reclassifying the main bias.
STOP LOSS AND LOT SIZE
Placing Stop Loss exactly two pips inside a Triangle just to improve a printed R:R may expose the trade to normal fluctuations. A structural stop can sit beyond the retest swing or another pre-defined invalidation. Lot Size must be calculated using account equity, acceptable loss and the actual pip or tick value. Multiple Triangle trades in correlated USD pairs may increase combined exposure. Risk Management is independent of how convincing the pattern looks.
TIMEFRAME, NEWS AND SESSIONS
A Triangle that forms over many H4 candles has different significance from one that lasts fifteen minutes on M1. London and New York session changes can produce accelerated movement and false initial breaks. CPI, NFP and FOMC can cause a strong two-sided move across both boundaries. If the strategy avoids major releases, remain flat during the event rather than making an exception for a textbook Triangle. A completed candle reduces some uncertainty, not all.
BACKTESTING TRIANGLE SETUPS
Define chart timeframe, allowable trendline anchors, minimum number of swing touches, maximum pattern duration, breakout close rule, retest requirements, trend filter, Stop Loss and target. Include formations that never break, that break the unexpected side and that fail after confirmation. Analyze net R and drawdown after costs by session and market regime. A strategy that only displays perfect historical breakouts is not evidence of a dependable trading edge.
TRIANGLE FAQ
Does Ascending always break upward? No. Does Descending always break lower? No. Can a Symmetrical Triangle move against the prior trend? Yes. Are lines exact price barriers? No. Is wick penetration equivalent to a completed breakout? Only if your rules say so. Does a measured move guarantee TP? No. If no confirmed signal appears, do not force a trade.
A TIMEFRAME AND PATTERN-AGE TEST
A Triangle that has been narrowing for dozens of H1 candles may represent a very different consolidation from a five-minute arrangement formed during one news spike. The strategy should record how long the structure has existed and whether its most important swing boundaries were valid before the breakout. Also assess whether price is breaking close to the narrow apex or earlier in the formation. These conditions may affect available stop placement and room to target; they should be tested rather than labeled universally bullish or bearish.
PIPSEPAISA FREE COURSES
For structured technical analysis education, explore the Free Forex Technical Analysis Course with Sir Sajid Khan Ghori. To understand the economic context behind Forex and Gold, explore the Free Forex Fundamental Analysis Course with Sir Ghulam Abbas. Visit www.pipsepaisa.com and select Courses for enrollment instructions. Courses and trading content cannot guarantee profit.
RISK DISCLAIMER
This is for education only. No indicator, chart pattern or economic release guarantees a trading outcome. Always calculate potential account loss, consider spreads and slippage, and wait for completed confirmation before trading.
Read in Roman Urdu
INTRODUCTION
Triangle Price Compression ka Pattern hai. Ascending mein approximately Flat Highs aur Rising Lows, Descending mein Flat Lows aur Lower Highs, Symmetrical mein Converging Trendlines hoti hain.
PRACTICAL EXAMPLE
EUR/USD H1 Triangle ka breakout dono directions mein possible hai. Sirf Ascending Label se guaranteed Buy nahi; Full Candle Close aur Retest analyze karein.
LIMITATIONS
Triangle ke final narrow phase mein False Breaks aur CPI/NFP whipsaw risk hota hai.
TRIANGLE PATTERN KYA HAI?
Triangle Price Chart ka Compression Structure hai jahan Swing Highs/Lows ya dono gradually converge karte hain. Ye Historical Chart Geometry hai, future direction ki guaranteed prediction nahi. Triangle Bullish Breakout, Bearish Breakdown ya Sideways Extension mein resolve ho sakti hai. Drawing pehle complete karein, Outcome ke baad perfect Trendlines adjust kar ke historical profit claim mat karein. Trading Plan mein H4 Bias, H1 Location, M5 Confirmation aur Risk ko combine karna zaroori hai.
ASCENDING TRIANGLE
Ascending Triangle mein Upper Swing Highs almost same Resistance Zone par aur Lower Swing Lows progressively higher hote hain. Higher Lows possible Buying Pressure show karte hain, lekin Resistance automatically break nahi hoti. Sellers repeated defense bhi kar sakte hain. Market upside Breakout ya lower Trendline Breakdown dono de sakti hai. Kuch Traders Upper Horizontal Line ke upar Full Candle Close wait karte hain, doosre Rising Support break ko bearish trigger consider karte hain. Fixed rules rakhein.
DESCENDING TRIANGLE
Descending Triangle mein Lower Boundary near Flat Support aur Upper Swing Highs progressively lower hote hain. Lower Highs bearish pressure ka clue ho sakte hain, lekin H4 Demand par Upside Reversal bhi possible. Lower Support ke neeche short Wick aur Candle wapas Support ke upar close ho to close-based model mein confirmed Breakdown nahi. Downside Acceptance, H1 Candle Close aur Retest context dekhna hoga. Descending Triangle always Sell, inaccurate oversimplification hai.
SYMMETRICAL TRIANGLE
Symmetrical Triangle mein Lower Highs aur Higher Lows dono converge karte hain. Dono Trendlines diagonal hoti hain. Pattern market compression dikhata hai, directional commitment nahi. Kuch Models previous Trend ki direction follow karna prefer karti hain, lekin price opposite breakout bhi de sakti hai. Touches ka count, Swing Separation aur Nearby Supply/Demand important hain. Har small M1 Shape ko H1 Major Triangle na samjhein.
SWING POINTS CONSISTENT RAKHEIN
Upper Trendline do confirmed Highs aur Lower Trendline do confirmed Lows se draw ho sakti hai. Lekin Line visually fit hone ka matlab Market guaranteed respect karegi nahi. M1 mein hundreds minor Triangles possible hain. Strategy Chart Timeframe, Minimum Swing Separation, Wick Tolerance aur Validity Window define karein. Price boundary ko bar-bar pierce kare to Pattern classification change ho sakti hai. Historical winners ke according anchors shift na karein.
BREAKOUT CONFIRMATION
M15/H1 Candle Triangle ke beyond full Close kare to Compression Area se Price exit ka clue milta hai. Lekin next candles wapas Triangle mein return bhi kar sakti hain. Conservative Entry Model boundary Retest, M5 Higher Low aur Completed Bullish Engulfing require kar sakta hai. Direct Wick Break par Order different aggressive strategy hai. Waiting Method fewer entries de sakti hai lekin Fast Genuine Moves miss bhi kar sakti hai. Backtest comparison zaroori hai.
EUR/USD ASCENDING EXAMPLE
EUR/USD H1 Resistance near 1.1050 multiple times test kare. Swing Lows 1.0990, 1.1010 aur 1.1030 progressively higher bante hain. Ye possible Ascending Triangle hai. H1 Candle 1.1050 ke upar complete close, phir Retest hold aur M5 confirmation de to Bullish Continuation Buy evaluate ho sakti hai. SL meaningful Retest Swing ke beyond, TP next Supply ke mutabiq. Agar Lower Trendline break aur 1.1030 support fail ho to Bullish Idea weak ho sakti hai.
GBP/USD DESCENDING EXAMPLE
GBP/USD H1 Support near 1.2700 repeated hold kar rahi hai, lekin Recovery Highs 1.2780, 1.2750 aur 1.2730 lower ban rahe hain. H1 completed close below 1.2700 aur failed Retest ke baad M5 Lower High possible Sell Continuation Model. Lekin BoE unexpected Hawkish News Pound suddenly strong kar sakti hai. Triangle geometry macroeconomic information control nahi karti. Stop Loss structural invalidation aur allowed Equity Risk ke mutabiq.
GOLD SYMMETRICAL EXAMPLE
Gold pehle strong Rally kare, phir M15 Lower Highs aur Higher Lows bana kar Symmetrical Triangle form kare. H4 Bullish ho to trader upside breakout prefer kar sakta hai under Trend-Continuation Model. Lekin Real Yields unexpectedly rise hon to downside Breakdown possible. Sirf preceding Rally ki wajah se automatic Buy Limit nahi. H1 Supply/Demand, Breakout Candle Close, Retest aur RR evaluate karein.
MEASURED MOVE TARGET
Triangle ka widest Height 70 Pips ho to traditional projection Breakout se similar 70-Pip Distance ka Target show kar sakti hai. Lekin next H1 Supply sirf 30 Pips upar ho to wahan reaction possible. Projected TP Market Obligation nahi. Stop Distance aur Target Space compare karein. Agar logical SL 40 Pips aur near Target 20 Pips ho to 1:3 Target line artificially door laga kar reality ignore na karein.
FALSE BREAKOUTS AUR LIQUIDITY
Price Triangle Upper Line cross kare, Buy Stops trigger ho sakte hain, phir Candle Range mein return kar sakti hai. Same downside Sweeps possible. Lekin har Sweep kisi known Bank ki intentional manipulation prove nahi karti. M15 Close Beyond + Retest ek possible Confirmation Filter hai. Ye kuch False Breaks avoid kar sakta hai, magar Non-Retest Genuine Moves miss bhi honge. Both Tradeoffs ko Historical Data mein measure karein.
VOLUME DATA LIMITATION
Exchange-Traded Futures Volume actual venue Transactions report karti hai. Spot Forex Tick Volume Broker Feed activity ka proxy ho sakta hai. Triangle Breakout ke waqt High Volume zyada activity indicate kar sakti hai, lekin guaranteed continuation nahi. Volume Filter use karein to Calculation, Data Source aur Timeframe consistent rakhein. CPI/NFP Candle par sudden Tick Spike ko normal market breakout ke exactly equal mat samjhein.
H4 H1 M5 WORKFLOW
H4 Trend aur Major Supply/Demand pehle mark karein. H1 Triangle Boundaries Price Break se pehle fix karein. M15 par Completed Breakout/Rejection observe karein. M5 par CHoCH, Engulfing ya Retest Confirmation wait karein. SL relevant Swing Beyond, Lot Dollar Risk se aur TP nearest Opposing Zone ke mutabiq. H4 Bearish aur Triangle Upside Break ho to Countertrend Setup separate rules demand karti hai.
STOP LOSS AUR LOT
Triangle ke andar arbitrary 2-Pip SL rakh kar better RR show karna misleading ho sakta hai. Stop actual Retest High/Low ke beyond define karein. Equity Percent Risk, Pip/Tick Value aur Stop Distance se Lot calculate karein. Multiple USD-correlated Pairs mein Triangle Breakouts par same direction trades lena combined exposure increase kar sakta hai. Risk Management Pattern ki perfection par depend nahi karna chahiye.
NEWS TIMEFRAME AUR SESSIONS
M1 Triangle aur H4 Triangle different market significance rakhte hain. London/Open aur New York activity False Initial Breaks create kar sakti hai. CPI/NFP/FOMC par Price both boundaries quickly cross kar sakti hai. Agar News Avoid Filter hai to textbook Triangle hone ke bawajood trade skip karein. Full Candle Close uncertainty reduce kar sakti hai, eliminate nahi. DST/timezone bhi session analysis mein check karein.
TRIANGLE BACKTEST
Timeframe, Swing Definition, Minimum Touches, Convergence Rule, Breakout Close, Retest, Trend Filter, SL, TP, News aur Costs record karein. Har Candidate Pattern include karein, including jo break hi nahi hui aur jo Wrong Side break hui. Net R, Win Rate, Drawdown aur Sample Size dekhein. Successful Historical Screenshots se Guaranteed Edge establish nahi hoti.
FAQ
Ascending always Up? Nahi. Descending always Down? Nahi. Symmetrical Opposite Break possible? Haan. Trendlines exact Walls? Nahi. Wick Break = full confirmation? Sirf agar Rule aisa ho. Measured Move guaranteed TP? Nahi. No Confirmation = No Trade.
TRIANGLE KA APEX AUR PATTERN AGE
Triangle Lines converge karte karte narrow Apex ke qareeb aati hain. Agar Price bohat late Apex ke qareeb tiny movement de to Breakout Stop/Target economics different ho sakti hain compared with earlier strong Break. H1 Triangle jo dozens Candles mein form hui aur M5 Triangle jo only 15 Minutes bani, same market context nahi. Pattern Duration, Swing Sizes, Boundary Touches aur Breakout Timing record karein. 'Apex ke paas guaranteed explosion' jaisa universal claim reliable nahi.
CORRELATED BREAKOUT RISK
Agar EUR/USD, GBP/USD aur XAUUSD teenon par USD weakness ke related setups mil rahe hain, to teeno Trades ek hi macro risk carry kar sakti hain. Har Triangle independent nahi. Dollar unexpectedly Strong ho to multiple Stop Losses same waqt hit ho sakti hain. Position-by-Position Dollar Risk ke ilawa total combined Exposure calculate karein. H4 Direction, News Calendar aur Max Concurrent Positions ka rule set karein. Multiple clean patterns ke bawajood account ka Risk Budget fixed rehna chahiye.
MISSED TRADE VS WRONG TRADE
Triangle Upper Boundary breakout ke baad Price without Retest strongly rise kar sakti hai. Conservative Retest Trader entry miss karega, lekin iska matlab Strategy Error nahi. Agar aapke plan mein Retest compulsory hai to late Market Buy chase karna different setup ho sakta hai. Missing a 100-Pip Rally Real Account Loss nahi. Risk/Reward calculated na ho to No Trade. Patience ek measurable process rule hai, profit ki guarantee nahi.
PRACTICE WORKSHEET
H1 par 20 consecutively observed Triangle Candidates mark karein. Ascending, Descending, Symmetrical type, H4 Trend, Candle Close Break Direction, Retest, M5 Confirmation, Stop Distance aur Outcome record karein. Jo Triangle expected side ke against break hui usay delete na karein. Daylight Saving Session Shift aur CPI/NFP News conditions note karein. Cost-adjusted Net R aur Drawdown compare karein. Same Rules har Chart par apply karein, Hindsight Adjustments avoid karein.
PIPSEPAISA FREE COURSES
Sir Sajid Khan Ghori ke Free Forex Technical Analysis Course mein Price Action, Market Structure aur Confirmation seekhein. Sir Ghulam Abbas ke Free Forex Fundamental Analysis Course mein Gold aur Forex ke Economic Data ka concept samjhein. www.pipsepaisa.com par Courses Tab se Enrollment Instructions check karein. Course Profit ki guarantee nahi.
DISCLAIMER
Ye sirf educational content hai. Koi Indicator, Pattern ya News guaranteed signal nahi. Structural Stop Loss, Account Risk, Spread aur Completed M5 Confirmation ka wait karein. No Confirmation = No Trade.
Educational content only. Trading involves risk. Always use independent analysis and appropriate risk management.