
Rising and Falling Wedges in Forex: Converging Trendlines and Confirmation
PipSePaisa • Forex Education & Research
INTRODUCTION
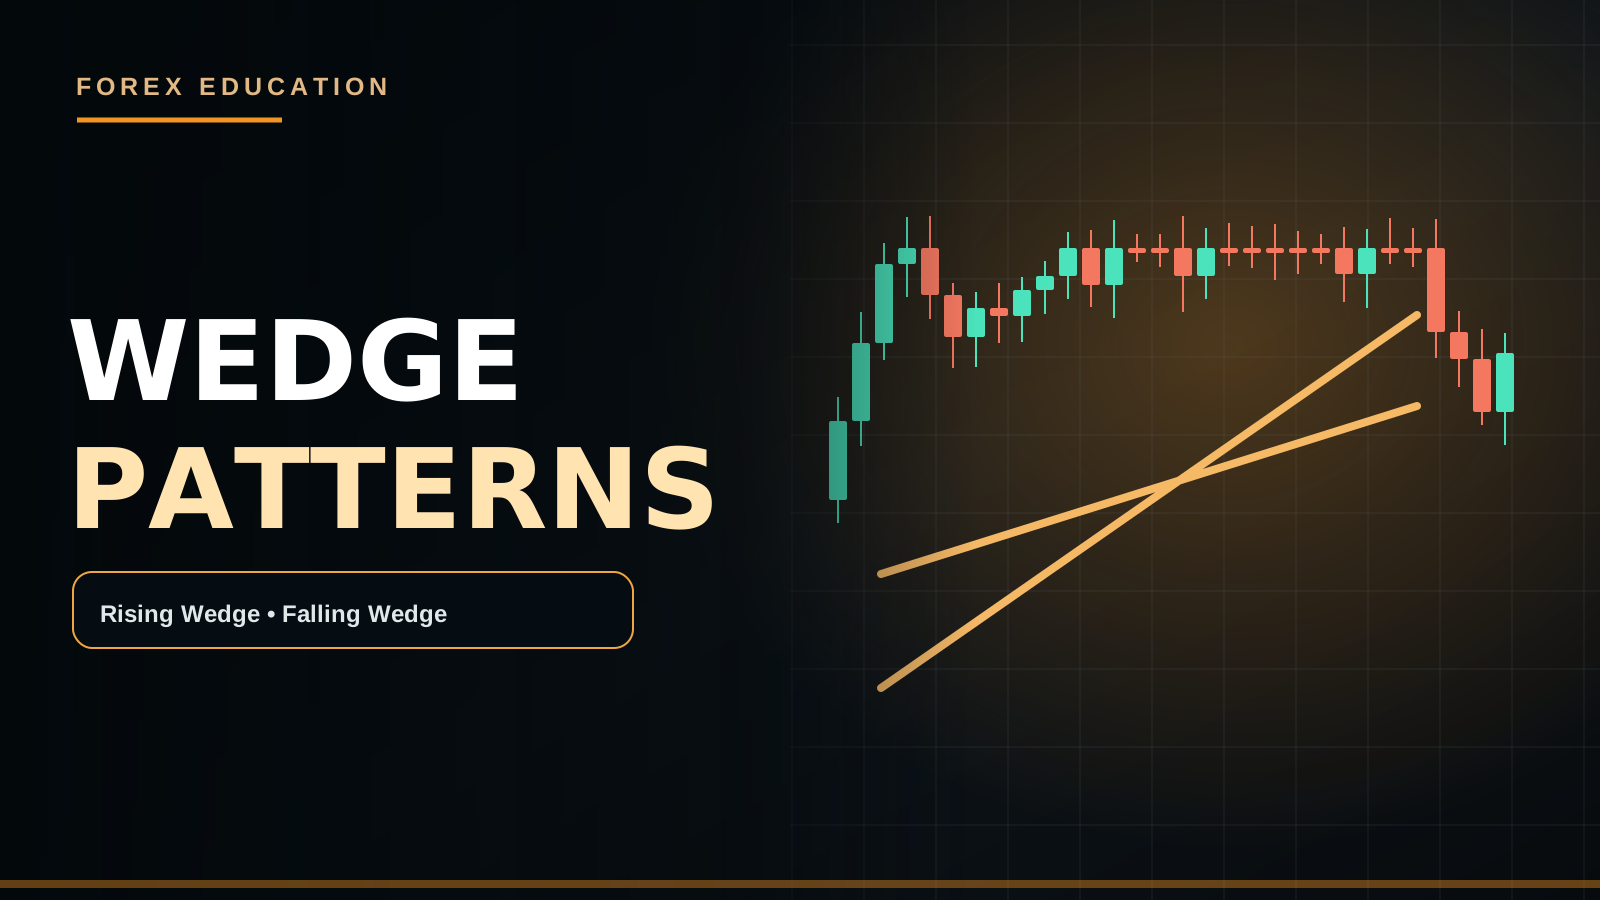
Wedges use two rising or falling boundaries that converge as swings compress. Rising wedges may be interpreted by some as bearish warnings and falling wedges as bullish warnings, but direction is not guaranteed by the drawing.
PRACTICAL MARKET EXAMPLE
A rising wedge appears during an H1 uptrend approaching H4 supply. A bearish close below the lower boundary and later retest may create a different opportunity than shorting solely because the structure narrows.
IMPORTANT LIMITATIONS
Traders can redraw the boundary after the breakout; a fixed swing-point rule prevents hindsight bias.
WHAT MAKES A WEDGE DIFFERENT
A Wedge is a price structure where two boundaries slope in the same general direction while gradually converging. Rising Wedges make progress upward but often with compressing swings, while Falling Wedges move downward with diminishing swing space. Analysts sometimes interpret a Rising Wedge as a bearish warning and a Falling Wedge as a bullish warning. However, the labels describe geometry and possible conditions, not a guaranteed reversal. The pattern can break in either direction or convert into a different type of consolidation.
RISING WEDGE GEOMETRY
A Rising Wedge often includes a series of higher highs and higher lows, but the pace of advance may appear less sustainable because the boundaries converge. A trader can connect significant upward swing lows for the lower boundary and highs for the upper boundary. If the lower boundary is broken with a completed close, a bearish interpretation may become plausible. Yet if price keeps climbing along the upper boundary, selling early because 'wedges are bearish' can produce multiple losses.
FALLING WEDGE GEOMETRY
A Falling Wedge shows declining highs and lows within converging downward-sloping lines. Some traders observe it as a potential exhaustion or bullish reversal setup, especially near H4 Demand. But a strong downtrend can continue through the wedge's lower boundary and invalidate a reversal expectation. The upper boundary break and successful retest are more direct observations than the abstract idea that sellers are 'running out of energy.' Momentum and structure need to confirm.
WEDGE VERSUS TRIANGLE
A Symmetrical Triangle has an upper boundary sloping downward and lower boundary sloping upward, whereas a Rising or Falling Wedge has both boundaries generally sloping the same way. Pattern geometry can appear ambiguous if swing points are not well defined. On a small timeframe, noise can make any four or five candles look like a converging formation. Fix the chart timeframe, valid anchors and minimum swing separation to avoid applying a famous label to arbitrary price movement.
PRIOR TREND AND MARKET LOCATION
A Rising Wedge after a prolonged H4 rally into major Supply can provide a different bearish context from the same wedge forming inside a young strong uptrend. A Falling Wedge inside H4 Demand may support observing bullish reversal attempts, whereas one in the middle of a decisive bearish trend can simply break down. The preceding market regime and nearby horizontal levels matter more than drawing the lines with perfect slopes. A pattern has to be evaluated as part of a larger market environment.
RISING WEDGE GBP/USD EXAMPLE
Suppose GBP/USD H1 forms ascending swings, but highs rise from 1.2740 to 1.2760 while lows rise from 1.2680 to 1.2735, compressing the available channel. If H4 Supply lies near 1.2770 and an H1 candle closes below the rising lower boundary, a bearish setup may deserve attention. M5 Lower High and Bearish Engulfing confirmation can refine execution. Stop Loss should reflect a meaningful rejection high. If the market instead breaks and holds above H4 Supply, the bearish wedge thesis may fail.
FALLING WEDGE EUR/USD EXAMPLE
EUR/USD H1 moves downward in a contracting formation while approaching previously marked H4 Demand. A completed bullish close above the falling upper boundary and a subsequent successful retest may suggest that downside structure is shifting. A trader could require an M5 bullish CHoCH before considering a Buy. But if US employment data unexpectedly strengthens USD, price may break lower again. A Falling Wedge is not insurance against new macroeconomic information.
WEDGE AS CONTINUATION, NOT ONLY REVERSAL
Some Wedges occur within larger trends and resolve in the same direction as those trends. A Rising Wedge in a strong bullish environment can break upward, and a Falling Wedge can fail downward. If a trader's plan assumes wedges only reverse, such cases should be documented as failures instead of ignored. A strategy can explicitly restrict itself to countertrend reversal setups at higher-timeframe zones, but it should not rewrite the pattern history to exclude inconvenient outcomes.
BREAK OF BOUNDARY VERSUS CHoCH
A lower Rising Wedge line breaking does not necessarily mean the most significant H1 Higher Low has been lost. The diagonal break may reflect slower momentum while external structure stays bullish. A more meaningful bearish CHoCH could involve a confirmed close below a significant swing low. Separate diagonal-line evidence from swing-structure evidence. Some conservative models require both before a reversal entry, but waiting longer can produce a less favorable entry price.
WICK, CANDLE CLOSE AND RETEST
A wedge boundary can be briefly penetrated by a wick and then recovered before the bar closes. A full body close beyond the line is a different observation. A retest of the broken line that fails to regain the old structure can add further confirmation under a defined method. Yet some genuine moves proceed without a retest. The strategy must specify whether wick-only breaks count and how long the retest may take, otherwise historical performance cannot be reproduced.
MEASURED-MOVE TARGETS
Some technicians project the widest section of a Wedge or a nearby swing range from the breakout, but these are only possible geometric objectives. The next horizontal Support or Demand may interrupt a bearish move sooner. For bullish wedges, nearby H1 Supply and Previous Day High can limit upside. A planned 1:3 ratio is meaningless if its target assumes price must travel through major opposing structure without evidence. Choose targets in accordance with the actual strategy.
FALSE BREAKOUTS NEAR NEWS
CPI, NFP, FOMC and central-bank decisions can push price across both wedge trendlines in quick succession. Fast movement, wider spreads and slippage complicate Stop execution. A steep wedge drawn just before an event may become irrelevant when new fundamental information reprices the instrument. A trading plan should state whether economic releases are excluded. A price pattern does not override macroeconomic catalysts or broker conditions.
CONFLUENCE WITH SUPPLY/DEMAND
An H1 Rising Wedge ending at H4 Supply can create a well-located potential bearish scenario. An H1 Falling Wedge ending at H4 Demand can similarly highlight a possible bullish reversal area. Still, both patterns are conditional. If price decisively breaks through the higher-timeframe zone, continuing to sell or buy only because the wedge was present is risky. Reassess the hypothesis whenever meaningful structural invalidation occurs.
H4 H1 M5 EXECUTION
Start with H4 Trend and major zones, draw H1 Wedge before any actual break, then monitor M15/H1 completed candle closes. If the selected strategy requires M5 CHoCH or Engulfing, wait for it. Place Stop Loss beyond an important price swing, not automatically just beyond the diagonal trendline. If the confirmation candle makes the Stop unusually wide relative to the next opposing level, reject the trade. A later signal does not require participation.
WEDGE BACKTESTING
Define the allowable slope, confirmed swing points, wedge duration, prior trend condition, whether H4 zone overlap is compulsory, close versus wick rule, retest, M5 confirmation and exit management. Include wedges that break in the unexpected direction. Measure net expectancy across sessions and compare with plain trendline breaks. If the wedge label does not improve risk-adjusted results, a simpler market-structure approach may be more useful.
WEDGE FAQ
Does a Rising Wedge always turn bearish? No. Is a Falling Wedge guaranteed Buy? No. Can a wedge break in the direction of the prior trend? Yes. Is a diagonal break identical to external BOS/CHoCH? No. Are slope measurements objective without fixed anchor rules? No. Should every wedge be traded? No. No Confirmation = No Trade.
A WEDGE INVALIDATION EXAMPLE
Suppose a rising wedge develops below a strong H4 resistance band. M15 breaks its lower boundary and a trader identifies a possible short. If price immediately reclaims the wedge, closes above the prior swing high and breaks H4 Supply, the earlier bearish model is no longer well supported. Holding the Sell because a textbook says rising wedges are bearish can be expensive. Set invalidation before entry, size the position for that loss and accept that patterns can fail. A disciplined Stop Loss is not a prediction error; it is part of the trading plan.
PIPSEPAISA FREE COURSES
For structured technical analysis education, explore the Free Forex Technical Analysis Course with Sir Sajid Khan Ghori. To understand the economic context behind Forex and Gold, explore the Free Forex Fundamental Analysis Course with Sir Ghulam Abbas. Visit www.pipsepaisa.com and select Courses for enrollment instructions. Courses and trading content cannot guarantee profit.
RISK DISCLAIMER
This is for education only. No indicator, chart pattern or economic release guarantees a trading outcome. Always calculate potential account loss, consider spreads and slippage, and wait for completed confirmation before trading.
Read in Roman Urdu
INTRODUCTION
Rising/Falling Wedge mein do Trendlines same general direction mein slope karti hain aur converge hoti hain. Rising Wedge possible Bearish Warning aur Falling Wedge possible Bullish Warning hoti hai, guarantee nahi.
PRACTICAL EXAMPLE
H1 Rising Wedge H4 Supply ke qareeb bane to Lower Boundary ke neeche completed Close aur Retest Bearish Setup ke liye clue de sakta hai.
LIMITATIONS
Wedge Line Break ke baad Anchors change karna Hindsight Bias hai; pehle Swings fix karein.
WEDGE PATTERN TRIANGLE SE DIFFERENT
Wedge mein two Trendline Boundaries generally same direction slope karti hain magar gradually converge hoti hain. Rising Wedge upward-moving shrinking Channel aur Falling Wedge downward-moving shrinking Channel ka concept hai. Rising ko some Traders Bearish Warning aur Falling ko Bullish Warning kehte hain. Lekin ye Geometric Chart Label hai, guaranteed Market Reversal nahi. Wedge opposite side break ya sideways consolidate bhi ho sakti hai. H4 Context aur Completed Candle Confirmation zaroori hai.
RISING WEDGE GEOMETRY
Rising Wedge mein Higher High/Higher Low ban sakte hain lekin upward Swings compress hoti hain. Lower Boundary Rising Swing Lows aur Upper Boundary Rising Highs connect karti hai. Agar completed Candle Lower Line ke neeche close kare to possible Bearish Breakdown idea hai. Lekin Price Upper Boundary ke saath upward continue kar sakti hai. 'Rising Wedge Always Sell' samajh kar Early Shorts strong Uptrend mein repeated loss de sakti hain.
FALLING WEDGE GEOMETRY
Falling Wedge mein Price declining Highs/Lows banati hai lekin dono Downward Lines converge karti hain. Kuch Reversal Strategies isay Selling Exhaustion warning consider karti hain, especially H4 Demand ke qareeb. Lekin Strong Downtrend Lower Boundary break kar ke continue bhi ho sakti hai. Upper Trendline ke upar completed Bullish Candle aur Retest stronger observable evidence ho sakti hai. Abstract Exhaustion Theory without M5 Confirmation enough nahi.
WEDGE VS SYMMETRICAL TRIANGLE
Symmetrical Triangle Upper Trendline downward aur Lower Trendline upward slope karti hai. Rising/Falling Wedge mein dono Lines same general direction mein slope karti hain. Agar Swing Selection clear na ho to Patterns confusing ho sakti hain. M1 par tiny Candles mein bohat shapes banengi jo H1 par meaningful nahi. Exact Swing Anchor, Minimum Bars Separation aur Timeframe rules fix karein. Winning historical chart pehle dekh kar Lines ko perfect fit karna proper test nahi.
PRIOR TREND AUR LOCATION
H4 strong rally ke baad H4 Supply mein Rising Wedge banay to possible bearish reversal observation hai. Same Rising Wedge early strong Uptrend mein ho to continuation bhi possible. Falling Wedge H4 Demand mein bane to Bullish Observation Area, lekin strong H4 Downtrend ke middle mein downside break possible. Chart Line Slopes ke saath Horizontal Structure aur Market Regime evaluate karein. Pattern Naam alone action signal nahi.
GBP/USD RISING WEDGE EXAMPLE
GBP/USD H1 Highs 1.2740 se 1.2760 tak aur Lows 1.2680 se 1.2735 tak compress hotay hain. H4 Supply 1.2770 par hai aur completed H1 Candle Rising Lower Line ke neeche close karti hai. M5 Lower High + Bearish Engulfing confirm ho to possible Sell Reversal. SL meaningful Upper Rejection High ke beyond, TP Next H1 Demand. Agar Price H4 Supply strongly reclaim kar le to Sell thesis invalid ho sakti hai.
EUR/USD FALLING WEDGE EXAMPLE
EUR/USD H1 Downward Converging Wedge banati hai aur H4 Demand ke qareeb aati hai. Completed Bullish Close Wedge Upper Line cross kare aur subsequent Retest hold ho to possible Bullish Structure Shift. M5 CHoCH ya Engulfing Full Close extra trigger ho sakta hai. Lekin strong USD-positive Employment Data price ko dobara Lower Break karwa sakti hai. Falling Wedge Future NFP Result predict nahi karti.
WEDGE CONTINUATION POSSIBLE
Wedges sirf Reversal Patterns nahi; Large Trend ke andar continuation bhi resolve kar sakti hain. Rising Wedge upside break aur Falling Wedge downside continuation de sakti hai. Agar aapki Strategy exclusively Opposite Trend Reversal trade karti hai to unexpected side breakthroughs ko Backtest Failure/No Entry categories mein record karein. Historical Performance improve dikhane ke liye losing examples remove na karein. Reversal Model aur Continuation Model separate rules demand karte hain.
TRENDLINE BREAK VS CHoCH
Rising Wedge Lower Diagonal Line break ho, lekin Important H1 Higher Low abhi intact ho. Ye Trend Momentum weaken hone ka clue hai, full H1 structural reversal nahi. Significant Higher Low ke neeche Completed Close Bearish CHoCH ka stronger clue ho sakti hai. Dono Events ko equal na samjhein. Kuch Conservative Models Diagonal Break + Structural Shift dono require karti hain, lekin Entry late bhi ho sakti hai. Target Distance dobara calculate karein.
WICK VS FULL CANDLE CLOSE
Price Wedge Line ke neeche Wick de aur same M15 Candle upar close ho to Completed Breakdown nahi under close-based model. Full Body Close beyond Line alag observation hai. Successful Retest extra Evidence ho sakti hai. Lekin Strong Breakouts retest ke baghair bhi continue kar sakti hain. Wick Accepted hai ya Body Close compulsory, ye advance mein fixed Rule rakhein. Har historical screenshot par flexible criteria misleading.
MEASURED TARGETS
Wedge widest section ya previous Swing Range ka measured target project kiya ja sakta hai. Lekin ye price ko next Support/Demand ke through guaranteed travel nahi karwata. Bearish Wedge ke neeche H1 Support close ho to early reaction possible. Bullish Wedge ke upar H4 Supply TP Room limit kar sakti hai. Paper par 1:3 TP line draw karna easy hai, lekin actual realistic RR important. Spread aur Slippage include karein.
NEWS AUR FALSE BREAKS
CPI, NFP, Fed aur BoE Announcements Price ko both Wedge Lines cross karwa sakti hain. Wide Spread aur Stop Slippage risk high ho sakta hai. Major News se pehle bana Wedge new economic information se irrelevant ho sakta hai. Agar Trading Plan News Avoid Rule rakhta hai to perfect Wedge par bhi entry skip karein. Data Surprise aur Bond Yields/DXY Reaction ko Technical Context ke saath assess karein.
H4 SUPPLY DEMAND CONFLUENCE
H1 Rising Wedge H4 Supply ke inside ho to potential bearish setup ke liye location useful hai. H1 Falling Wedge H4 Demand ke qareeb ho to Bullish Reversal Candidate. Lekin Price Important Zone decisively break kar de to old Wedge Narrative ke naam par Loss Hold na karein. Actual Market Structure, Zone Invalidation aur M5 Confirmation priority hain. Multiple Labels profit guarantee nahi.
H4 H1 M5 PROCESS
H4 Trend aur Major Zones mark. H1 Wedge before Breakout draw. M15/H1 Completed Boundary Close check. M5 CHoCH/Engulfing Confirmation wait if required. Stop Loss meaningful Swing ke beyond. Dollar Risk se Lot aur Opposing Zone tak Target. Agar Confirmation Candle huge ho to RR unattractive ho sakti hai. Skip karna valid hai. No Confirmation = No Trade.
WEDGE BACKTEST
Timeframe, Trendline Slope, Swing Points, Duration, Prior Trend, H4 Zone, Wick/Body Close, Retest, M5 Trigger, SL, TP aur News Filter define karein. Unexpected Side Breaks bhi include karein. Same Plain Trendline Break Strategy ke results se compare karein. Net Expectancy after Costs aur Drawdown meaningful metrics hain, not only winning screenshots.
FAQ
Rising Wedge always Bearish? Nahi. Falling guaranteed Bullish? Nahi. Trend Direction mein Break possible? Haan. Diagonal Break same as H1 CHoCH? Nahi. Anchor Rules zaroori? Haan. Har Wedge trade? Nahi. No Confirmation = No Trade.
WEDGE FAIL HO TO KYA?
Rising Wedge H4 Resistance ke neeche form hui. M15 Lower Line Break hui aur Trader ne Sell Idea consider kiya. Lekin Price immediately Line reclaim kar ke Prior Swing High aur H4 Supply ke upar strong close deti hai. Is se old Bearish Wedge Reversal Thesis weak ya invalid ho sakti hai. Sirf Textbook mein Rising Wedge Bearish likha hai is liye Losing Sell Hold na karein. Stop Loss pre-defined Structural Level par rakhein, Lot Dollar Risk se calculate karein. Failed Pattern normal market outcome hai.
WEDGE SLOPE KO OBJECTIVELY MEASURE KAREIN
Agar Trendline Bahut Steep hai ya different Zoom Level par same Swings consistently connect nahi hotay, to Wedge Drawing subjective ho sakti hai. Selected H1 Highs/Lows, Candle Times aur Boundary Coordinates note karein. Price Line Break ke waqt exactly kaunsa Meaningful Swing intact tha, mark karein. M5 Internal CHoCH ko H4 external Market Structure Break samajh kar premature major reversal claim mat karein.
EMA ATR AUR WEDGE
Kuch Traders Rising Wedge ke Lower Line Break ke saath Falling EMA aur ADX behavior observe karte hain. Lekin multiple Indicators same Price Move reflect kar sakte hain, guaranteed independent Selling Evidence nahi. ATR Current Volatility estimate karti hai, isliye tight Stop normal Market Noise mein hit ho sakti hai. Stop actual Structural High/Low aur Risk Budget ke mutabiq rakhein. Indicator Confluence analytical aid hai, Capital Protection ka replacement nahi.
WEDGE TESTING EXERCISE
Consecutive Chart History se Rising/Falling Wedges mark karein. Prior Trend, H4 Zone, Swing Selection, Line Slopes, M15 Full Close, Retest, M5 Confirmation, Stop Invalidation aur actual Return R record karein. Wrong Side Breakouts ko remove na karein. Trend vs Range conditions separately compare karein. High-impact News Days aur Slippage note karein. Successful Reversal Screenshot ke basis par entire Strategy profitable claim nahi.
PIPSEPAISA FREE COURSES
Sir Sajid Khan Ghori ke Free Forex Technical Analysis Course mein Price Action, Market Structure aur Confirmation seekhein. Sir Ghulam Abbas ke Free Forex Fundamental Analysis Course mein Gold aur Forex ke Economic Data ka concept samjhein. www.pipsepaisa.com par Courses Tab se Enrollment Instructions check karein. Course Profit ki guarantee nahi.
DISCLAIMER
Ye sirf educational content hai. Koi Indicator, Pattern ya News guaranteed signal nahi. Structural Stop Loss, Account Risk, Spread aur Completed M5 Confirmation ka wait karein. No Confirmation = No Trade.
Educational content only. Trading involves risk. Always use independent analysis and appropriate risk management.