
Wyckoff Method in Forex and Gold: Accumulation, Distribution, Springs and Upthrusts
PipSePaisa • Forex Education & Research
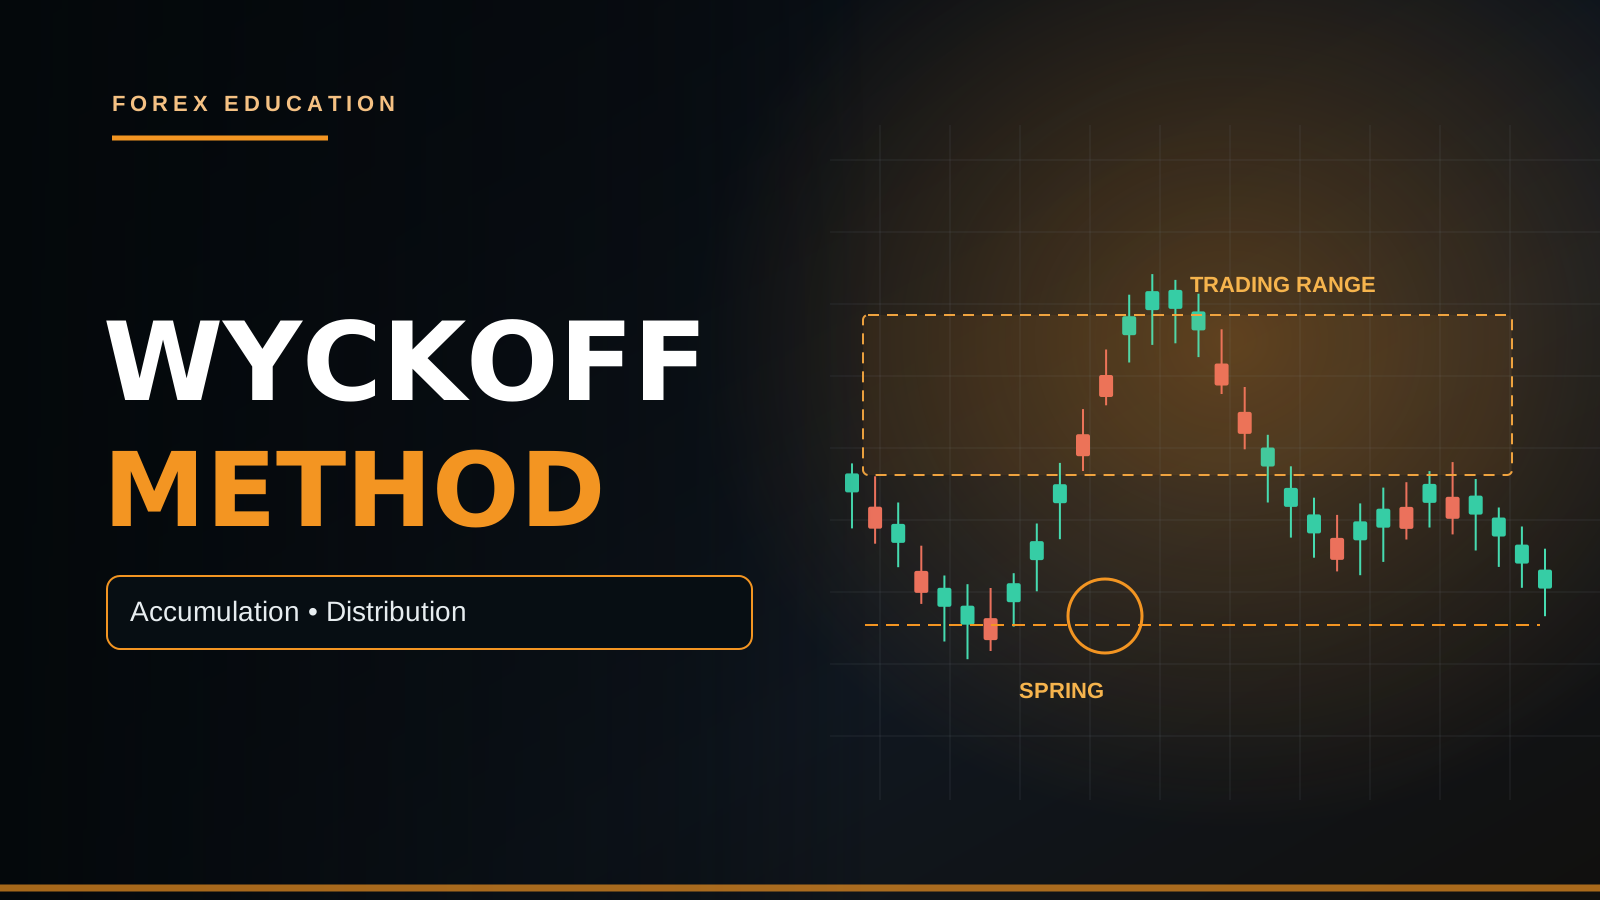
INTRODUCTION: WHAT IS THE WYCKOFF METHOD?
The Wyckoff Method is a framework for studying market behavior through price, trading ranges, trend development and the interaction of supply and demand. Originally associated with Richard D. Wyckoff and studies of actively traded securities, it is now discussed by Forex, Gold and crypto traders. Its best-known concepts include accumulation, distribution, springs, upthrusts and the Composite Man. The method is not a computer program that knows the next candle. It is a way of organizing observations and conditional hypotheses about how an auction may develop.
THE THREE WYCKOFF LAWS
Wyckoff education commonly introduces three organizing ideas: supply and demand, cause and effect, and effort versus result. Supply versus demand describes the balance of willingness to transact at available prices. Cause and effect asks whether a trading range can support a later directional move, though its projected target is not guaranteed. Effort versus result studies whether trading activity and price progress are consistent. These principles encourage analysis but do not prove an institution's hidden intentions from a retail candlestick chart.
SUPPLY AND DEMAND IN THE WYCKOFF CONTEXT
Wyckoff supply and demand should not be confused with drawing a single H1 Demand Rectangle and predicting that a Buy will succeed. A market can experience strong selling but still rebound if buying absorbs it; a visibly bullish candle can also fail when supply returns. Price is determined by transactions and expectations across venues. Spot Forex is decentralized, so a retail chart cannot capture every global order. Higher-timeframe structure, credible volume data where available, and the actual reaction of price help keep interpretations grounded.
CAUSE AND EFFECT IS NOT A GUARANTEE
In Wyckoff terminology, a sideways range can be interpreted as a possible cause preceding a trending effect. A longer consolidation might sometimes lead to a substantial move, but there is no rule requiring a fixed number of future pips for every bar spent in the range. The range could instead break briefly, reverse, or continue sideways. Price projections based on Point and Figure counting depend on chart parameters and method choices. They should be tested, not presented as an automatic earning formula.
EFFORT VERSUS RESULT
Effort refers to represented trading activity, often volume; result is the associated price movement. If a futures contract records unusually high traded volume while price makes little progress through resistance, an analyst might ask whether opposing supply is absorbing demand. But that explanation is a hypothesis, not direct proof of a specific bank's Sell orders. In retail Spot Forex, broker tick volume is not centralized worldwide traded volume. Always identify the source and definition of the volume displayed.
THE COMPOSITE MAN IDEA
Wyckoff's Composite Man is a teaching model for imagining large, informed market interests acting together. It should not be interpreted as one real entity secretly controlling all currencies or Gold prices. The modern Forex market includes banks, corporations, funds, governments, algorithms and individuals, often acting for different reasons. A schematic trading range cannot establish their coordinated intentions. The practical use of the concept is to avoid reacting impulsively to every candle and to study the whole market structure instead.
WHAT IS ACCUMULATION?
Accumulation is commonly used for a trading range where selling pressure appears to become less dominant and a potential upward trend may develop. A textbook schematic might show a Selling Climax, Automatic Rally, Secondary Tests, a Spring and signs of strength. Real charts rarely fit a perfect picture. A range cannot be confirmed as successful bullish accumulation merely because its lower boundary has been touched twice. Many apparent accumulation candidates break downward or remain in consolidation longer than expected.
THE SELLING CLIMAX
A Selling Climax, often abbreviated SC, describes a possible exhaustion-type event after notable downside movement. Price may sell sharply into a new low, activity can rise and a rebound may follow. However, a large red candle with high volume is not automatically a climax; it can be the start of a persistent new bearish leg. Confirmation requires the market's subsequent behavior. Is the next H1/H4 low held? Does a meaningful rebound form? Does selling continue despite an apparent reaction? Only the unfolding structure can answer.
AUTOMATIC RALLY AND SECONDARY TEST
After a hypothetical Selling Climax, an Automatic Rally may establish an upper trading-range boundary. A later Secondary Test can revisit the lower area and reveal whether aggressive supply remains strong. Some tests penetrate the prior low while others hold above it. These labels are useful for chart annotation, but traders should not rearrange them after the event just to force a famous schematic. A valid setup should define its swing anchors, timeframe and expected confirmation before analyzing historical results.
WHAT IS A WYCKOFF SPRING?
A Spring is a possible temporary breakdown beneath a recognized accumulation trading range followed by a return above its support boundary. It can resemble a sell-side liquidity sweep or failed breakdown. The important observation is not merely a wick below the range: look at whether the candle closes back inside, whether follow-through selling fails and whether later structure becomes bullish. A Spring can also fail and turn into a genuine breakdown. It is a conditional event, never an obligation for price to reverse.
TESTING A SPRING
Some Wyckoff interpretations look for a later test after the Spring. Price revisits the lower range but shows less downward progress, which may suggest that sellers are not achieving the same result as before. Yet a test can fail. A conservative Forex strategy might wait for an H1 Higher Low followed by a completed M5 bullish CHoCH before considering any Buy. The Stop Loss must reflect where the trade thesis fails. An incomplete M5 green candle should not be described as confirmed evidence.
SIGNS OF STRENGTH AND LAST POINT OF SUPPORT
A Sign of Strength, or SOS, commonly describes an upward move through meaningful internal range resistance or the upper part of a trading range. A Last Point of Support, LPS, may be identified where a subsequent pullback holds above prior resistance or an important higher low. These labels can help organize a possible transition from ranging to trending. But a one-candle breakout above a range can also be false. A completed close, retest and risk-to-reward check remain essential.
WHAT IS DISTRIBUTION?
Distribution is the conceptual opposite scenario: after a significant rise, price forms a range and may transition toward a bearish trend. Textbook models include Buying Climax, Automatic Reaction, Secondary Tests, Upthrusts and signs of weakness. It is often tempting to label every sideways range near a high as institutional distribution, but many such ranges are pauses within a continuing uptrend. The label should remain provisional until price behavior supports the bearish hypothesis. Highs, lows and confirmed structural changes matter.
BUYING CLIMAX AND AUTOMATIC REACTION
A Buying Climax may describe a sharp advance that attracts strong activity near an important high, after which price reverses. The ensuing Automatic Reaction can help define the lower boundary of a candidate distribution range. But large bullish candles also appear in healthy trends. Without subsequent loss of higher lows and resistance to further advances, a single upper wick is insufficient. Real market prices are influenced by macroeconomic information and liquidity as well as chart patterns.
UPTHRUSTS AND FAILED UPSIDE BREAKOUTS
An Upthrust is a move above a trading range's upper boundary followed by rejection or return inside. It can resemble a buy-side sweep of equal highs. A failed breakout above resistance may support a bearish hypothesis when confirmed by meaningful lower-timeframe structure. But an initial upthrust-looking candle can be followed by genuine upside acceptance and a new trend. Entering a Sell before the full candle closes is especially risky if the strategy requires a confirmed rejection.
UPTHRUST AFTER DISTRIBUTION
Some Wyckoff schematics describe an Upthrust After Distribution, or UTAD, as a late upside excursion before a possible decline. Real-time identification is difficult because the same breakout might become the beginning of a lasting bullish continuation. A robust plan should distinguish an observed rejection from a retrospective UTAD label. Define the trigger: an H1 return below the range high, a completed bearish M5 CHoCH, perhaps a failed retest. Structural invalidation belongs above the relevant rejection high.
SIGNS OF WEAKNESS AND LAST POINT OF SUPPLY
A Sign of Weakness, SOW, is often associated with declining price through important support during a proposed distribution sequence. A Last Point of Supply, LPSY, may be described as a later rally that fails beneath resistance. These labels are not requirements that each market follow a fixed sequence. A small M5 lower low while H4 structure remains bullish should not automatically be promoted to a major distribution confirmation. Align the event with the timeframe of the original range.
A PRACTICAL GOLD ACCUMULATION EXAMPLE
Imagine XAUUSD H4 has stopped falling and begins rotating between two previously marked price zones. A brief move below the lower boundary produces a completed H1 close back inside the range. M15 then forms a Higher Low and M5 closes above a local swing high. This is a possible Spring plus bullish structure-shift interpretation. A trader may consider a Buy only if the structural Stop beyond the sweep low and the next H1 Supply allow sufficient target room. No projected rally is guaranteed.
A PRACTICAL EUR/USD DISTRIBUTION EXAMPLE
Suppose EUR/USD H1 trades sideways beneath an H4 Supply area after an earlier rise. Price briefly penetrates the trading range high, then closes below it. A later M5 lower high and bearish engulfing could support an Upthrust-based Sell candidate. But if the next H1 candle breaks above both resistance and the supposed upthrust high, the bearish narrative weakens. Refusing to widen the Stop Loss preserves the risk plan. A Wyckoff label should not become a reason to deny fresh price evidence.
WYCKOFF PHASES A THROUGH E
Many Wyckoff educational resources describe schematic phases A, B, C, D and E. A may mark stopping action; B commonly shows construction of a trading range; C may contain a Spring or Upthrust; D often features stronger directional evidence; and E depicts movement away from the range. Actual markets can skip textbook features, create several tests or remain ambiguous. Never assume the letters are a countdown that guarantees a profitable entry in Phase D. Work from observed swings rather than predetermined drawings.
WYCKOFF AND TIMEFRAMES
A range drawn on H4 may span many trading days, while one drawn on M5 may contain only minutes of intraday activity. Both can be annotated with Wyckoff terminology, but their economic significance and risk characteristics differ. Use H4 to assess larger context, H1 for the main trading range, M15 for reactions and M5 for completed entry signals when those are the tested rules. Calling an M5 Spring a confirmed H4 accumulation event is a category error.
USING VOLUME RESPONSIBLY
Wyckoff analysis originated in environments where trading volume could be observed more directly. Currency futures offer centrally reported volume for their exchange, while most Spot Forex retail charts use broker tick volume or another proxy. Gold futures and retail XAUUSD CFD volume are not the same dataset. A trader who studies futures activity alongside a CFD entry should explain instrument differences, session boundaries and data quality. Effort-versus-result arguments weaken when volume measures are inconsistent or unreliable.
NEWS CAN BREAK A PERFECT SCHEMATIC
CPI, NFP, Federal Reserve decisions and unexpected geopolitical news can overwhelm a carefully drawn accumulation or distribution range. A high-impact release can move price through both boundaries and create temporary fakeouts. It can also generate a lasting repricing that invalidates every prior trading-range expectation. A responsible plan includes an economic-calendar filter and recognizes spread widening and slippage. If the trading rules exclude such events, no visually perfect Spring should be used to justify breaking them.
STOP LOSS AND POSITION SIZING
Wyckoff concepts identify possible areas and transitions; they do not tell the trader how many lots to buy. Determine the actual structural invalidation: for a Spring Buy, it may lie beneath the meaningful sweep low; for an Upthrust Sell, above the rejection high. Convert entry-to-stop distance into account-currency risk using the symbol's contract and pip/tick value. If the nearest opposing range boundary provides poor reward, skip. Do not multiply lot size merely because a range fits a famous schematic.
BACKTESTING WITHOUT HINDSIGHT
Mark the range boundaries on a historical chart while later candles are hidden. Identify where a Spring or Upthrust candidate becomes observable and which exact completed candle qualifies as a trigger. Advance the chart one bar at a time and record failures, ambiguous patterns, confirmations and skipped trades. Compare the Wyckoff-based model with simpler Support/Demand plus M5 CHoCH rules. Calculate net R, win/loss distribution, worst drawdown and trading costs. The method earns value only if it changes decisions constructively.
COMMON WYCKOFF MISTAKES
Common mistakes include calling every consolidation accumulation, every upper wick a distribution UTAD, treating every lower sweep as a Spring, drawing the range after the breakout, imagining the Composite Man is a real centralized market controller, and ignoring News or Volume Feed limitations. Another mistake is searching for all named schematic stages even when actual price is trending clearly. A useful education article should explain what would invalidate the analysis rather than promising that smart money must respect every textbook label.
FAQ AND FINAL TAKEAWAY
Does every Spring become a bullish rally? No. Is every Upthrust a major reversal? No. Does an H1 range prove institutional accumulation? No. Can an accumulation-looking range break downward? Yes. Are A–E phases compulsory on every chart? No. Can a strong Fed report invalidate the pattern? Yes. A practical sequence is: Higher-Timeframe Context → Defined Trading Range → Potential Spring or Upthrust → Completed Structure Confirmation → Structural SL and Correct Lot → Realistic Target. No Confirmation = No Trade.
PIPSEPAISA FREE COURSES
Grow your trading knowledge with Free Forex Technical Analysis by Sir Sajid Khan Ghori and Free Forex Fundamental Analysis by Sir Ghulam Abbas. Explore available courses and current enrollment instructions at www.pipsepaisa.com. Educational only, not financial advice. Forex and leveraged Gold products carry significant loss risk.
Read in Roman Urdu
WYCKOFF METHOD FOREX GOLD MEIN KYA HAI?
Wyckoff Method Price Action, Trading Ranges, Supply/Demand aur Trend Development ko study karne ka Framework hai. Ye concept Richard D. Wyckoff ke naam se related hai aur Stocks ke ilawa Forex/Gold Traders bhi discuss karte hain. Important concepts Accumulation, Distribution, Springs, Upthrusts aur Composite Man hain. Wyckoff koi Magic Indicator nahi jo Next Gold Candle accurately predict kare. Ye Market ko Conditional Scenarios mein samajhne ka tareeqa hai. H4 Structure aur M5 Confirmation ko saath dekhna important hai.
WYCKOFF KE THREE BASIC LAWS
Educational Wyckoff Framework mein Supply vs Demand, Cause vs Effect aur Effort vs Result ke ideas discuss hotay hain. Supply/Demand Market mein Buying/Selling Willingness ke balance ka context hai. Cause/Effect Theory sideways range ke baad possible Trending Move discuss karti hai, guaranteed pip forecast nahi. Effort/Result Activity vs Price Progress compare karti hai. In concepts se Trade Location aur Observation organize ho sakti hai, lekin institutional hidden Intent conclusively prove nahi hota. Har Chart independent confirmation demand karta hai.
SUPPLY DEMAND KA CONTEXT
Sirf H1 Demand rectangle draw karna Wyckoff Accumulation prove nahi karta. Kabhi Buyers selling pressure absorb kar sakte hain, kabhi apparent Bullish Candle next H1 session mein completely fail. Forex decentralized hai; Retail Broker ka chart worldwide pending bank Orders show nahi karta. Price actual Transactions, Economic Data aur Expectations se develop hoti hai. H4 Trend, H1 Zones aur completed M5 Candle structure se signal evaluate karein. A+ Label bina objective confirmation guaranteed result nahi.
CAUSE AND EFFECT MEANING
Sideways Range ko Wyckoff Theory mein possible Cause aur Later Trend ko possible Effect describe kiya ja sakta hai. Lekin Market 20 H1 Candles sideways rahi to next 200 Pips lazmi move karegi, aisa exact mathematical law nahi. Range False Breakout de kar opposite side bhi ja sakti hai. Point and Figure Projections chosen Box Size aur Calculation Rules par depend karti hain. Future Target guaranteed nahi. Price Action aur Risk-to-Reward ke saath plan banayein.
EFFORT VS RESULT
Effort usually Trading Activity ya Volume ka clue hai, Result actual Price Progress. Example Gold Futures mein Heavy Exchange Volume ke bawajood Price H1 Resistance cross na kar paye to Possible Opposing Supply/Absorption ka question uthta hai. Lekin aap chart se kisi particular Bank ka Sell Limit confirm nahi kar sakte. Retail Spot Forex Tick Volume true worldwide traded Notional nahi. Data Source identify karein. Weak Price Movement ke multiple possible reasons ho sakte hain; confident institutional story invent mat karein.
COMPOSITE MAN KYA HAI?
Wyckoff ki Composite Man Idea large market interests ke behavior ko teaching framework mein simplify karti hai. Iska matlab ek real person Forex aur Gold ki har candle control kar raha hai, nahi. Banks, Central Banks, Companies, Funds, Algorithms aur Retail Traders different goals ke saath participate karte hain. Composite Man ko Literal Hidden Operator samajh kar stop-hunting certainty claim karna misleading. Useful idea Market Structure ko broader context mein observe karna hai, har wick par impulsive trade nahi.
ACCUMULATION KYA HOTI HAI?
Wyckoff Accumulation ek potential Trading Range Scenario hai jahan Downtrend ke baad Selling Pressure weaker ho aur Market possible Uptrend transition kare. Textbook mein Selling Climax, Automatic Rally, Secondary Test, Spring aur Sign of Strength dikh sakte hain. Lekin Real Charts perfect schematic rarely follow karti hain. Sirf two Equal Lows ban gaye to institutional accumulation confirm nahi hoti. Market third lower low ya prolonged Sideways Range bhi bana sakti hai. Pattern provisional rakhein.
SELLING CLIMAX SC
Selling Climax often strong downside movement ke baad possible final heavy selling event describe karta hai. Price sharp lower wick, high observed activity aur subsequent Rally show kar sakti hai. Lekin High Volume Red Candle genuine new Bearish Trend ka start bhi ho sakti hai. Isliye SC label first Candle par guaranteed Bottom announcement nahi. Next H1/H4 Lows hold? Rebound meaningful? Further Selling follow-through aaya? In questions ke answers next completed price behavior se milte hain.
AUTOMATIC RALLY AR
Hypothetical Selling Climax ke baad Price rebound kare aur Range Upper Boundary set kare to usay Automatic Rally AR keh sakte hain. Subsequent Secondary Test ST lower range revisit kar sakta hai. Sometimes low ke neeche Wick, sometimes Higher Low. Ye chart labels trading knowledge organize karti hain, compulsory fixed sequence nahi. Har Historical Chart par result ke mutabiq SC/AR positions shift karna Hindsight Bias create karta hai. Swing Levels aur Dates consistent mark karein.
SECONDARY TEST ST
Secondary Test ka purpose dekhna hai ke lower area revisit par sellers kitna price progress kar pa rahe hain. Agar Price previous low ke qareeb aakar less downward movement aur stronger Recovery de to possible bullish context. Lekin Test new downtrend breakdown bhi create kar sakta hai. M15 rejection aur M5 Bullish CHoCH complete na ho to Buy force na karein. H1 Demand location aur Stop Distance evaluate karein. Multiple Tests market ko automatically bullish nahi banate.
WYCKOFF SPRING KYA HAI?
Spring potential Accumulation Range ke Lower Support ke neeche Temporary Breakdown aur phir Range ke andar return ka concept hai. Ye Sell-Side Liquidity Sweep jaisa lag sakta hai. Lekin Sirf Wick below support = guaranteed Spring Trade nahi. Full Candle Range ke andar Close karti hai? Price follow-through selling fail ho rahi? M5 local Lower High break karta hai? Ye actual price evidence important hai. Spring fail ho kar genuine bearish breakdown bhi ban sakti hai.
SPRING KA TEST
Kuch Wyckoff Models Spring ke baad test observe karti hain jab Price lower range revisit kare aur Selling Pressure earlier jaisi progress na de. Lekin repeat test Support break bhi kar sakta hai. Conservative Entry Model H1 Higher Low aur M5 completed Bullish CHoCH require kar sakta hai. SL Spring Sweep Low ke beyond meaningful invalidation par. Agar H1 Supply bohat qareeb ho to Buy RR poor ho sakti hai. No Confirmation = No Trade.
SIGN OF STRENGTH SOS
SOS ko possible Accumulation Range ke internal Resistance ya Upper Zone ke upar meaningful upward progress describe karte hain. LPS Last Point of Support baad mein Pullback Hold ka label ho sakta hai. Lekin ek Bullish H1 Candle Upper Range cross kare aur next Candle wapas below close de to False Breakout bhi ho sakti hai. H1 Completed Close, Retest Hold aur M5 Confirmation decide karein. SOS label guaranteed new Bull Market nahi.
DISTRIBUTION KYA HOTI HAI?
Distribution possible Trading Range hai jahan prior Uptrend ke baad Supply dominate karne ka hypothesis develop ho sakta hai. Textbook Events Buying Climax, Automatic Reaction, Secondary Test, Upthrust aur Sign of Weakness ho sakte hain. Lekin every high consolidation Distribution nahi. Strong H4 Uptrend mein Sideways pause ke baad Price aur higher rally kar sakti hai. Pattern ko provisional rakhein jab tak meaningful H1/H4 Lower Low/Lower High confirm nahi. Sirf Big Red Candle enough nahi.
BUYING CLIMAX BC
Buying Climax possible sharp upside event hai jahan Price High ke qareeb strong buying activity aur subsequent rejection show kare. Automatic Reaction lower Range Boundary define kar sakti hai. Lekin huge bullish candle normal Trend Continuation ka hissa bhi ho sakti hai. One Upper Wick se H4 Major Bearish Reversal confirm na karein. Price previous significant Higher Low lose kare ya H1 Resistance reject ho, aise objective conditions wait karein. Context higher timeframe ka hona chahiye.
UPTHRUST KYA HAI?
Upthrust Range ke Upper Resistance ke upar Temporary Break aur subsequent rejection/return ko describe karta hai. Ye Equal Highs ke Buy-Side Sweep jaisa appear ho sakta hai. Lekin Upper Wick ke baad genuine breakout bhi continue kar sakta hai. Agar Strategy Full H1 Close below Range + M5 Bearish CHoCH require karti hai to pehle Sell nahi. Upthrust naam protected profit nahi. Structural SL, nearest H1 Demand aur Lot Risk calculate karein.
UTAD KYA HAI?
Upthrust After Distribution yani UTAD late Distribution Scenario mein possible upside liquidity move ka label hai. Real-Time mein identify karna difficult hai because same price breakout new Bullish Trend ka start ho sakti hai. Sirf outcome ke baad wick mark kar ke 'Smart Money Sell' kehna biased. H1 Range High ke neeche Return, M5 completed Bearish Structure, Failed Retest aur Stop above meaningful High jaisi exact criteria predefine karein. Agar Price strong hold above Resistance de to bearish thesis invalidate.
SIGN OF WEAKNESS SOW
SOW possible Distribution Range Support ke neeche sustained downward progress show kar sakta hai. LPSY Last Point of Supply subsequent Rally par failed resistance/retest context ho sakta hai. Lekin every M5 Lower Low H4 Downtrend proof nahi. H4 Major Structure, H1 Range Boundaries aur Actual Candle Closes ki hierarchy maintain karein. Bina test ke SOW label institutional selling guaranteed nahi. Economic Report Gold ya EUR/USD trend completely change kar sakti hai.
GOLD ACCUMULATION EXAMPLE
Hypothetical Gold H4 Long Fall ke baad Sideways Range form karti hai. Price H1 Lower Boundary briefly sweep kar ke Range ke andar full Candle Close deti hai. M15 Higher Low aur M5 Bullish CHoCH develop ho to Spring + Bullish Structure Thesis possible. Buy SL Sweep Low ke beyond, TP next H1 Resistance/Upper Range. Agar Stop $20 Gold Price Distance aur Target sirf $10 hai to RR poor. Pattern impressive hone ke bawajood no entry.
EUR/USD DISTRIBUTION EXAMPLE
EUR/USD H1 H4 Supply ke neeche Range bana rahi hai. Price Upper Range High ke upar short move de, phir Candle Range ke andar Bearish Close karti hai. M5 Lower High aur Bearish Engulfing confirm ho to possible Upthrust Sell. Lekin next H1 Candle prior High reclaim kar le to original bearish narrative weak. Stop Loss ko permanently wide karna Risk Control violation hai. Price Evidence ko traditional schematic se zyada importance dein.
WYCKOFF PHASES A B C D E
Popular Wyckoff Charts mein Phase A Stopping Action, B Range Building, C possible Spring/Upthrust, D directional Strength/Weakness aur E Range Exit illustrate ho sakte hain. Lekin Real Market stages skip, repeat ya ambiguous ho sakte hain. A to E compulsory countdown nahi. Chart Outcome dekh kar Phase C exact Bottom label karna often Hindsight. Har Phase ka actual observable H1/H4 structure define karein. M5 Entry signals alag specific rules follow karein.
TIMEFRAME ALIGNMENT
H4 Accumulation Range weeks/days span kar sakti hai. M5 Trading Range sirf minutes. Dono mein Spring-type price behavior show ho sakta hai, magar risk aur significance same nahi. H4 Bias, H1 primary Range, M15 Reaction aur M5 completed Candle Trigger ek practical hierarchy hai. M5 Spring ko 'Confirmed H4 Institutional Accumulation' kehna wrong timescale. Support/Demand Zone ke beyond SL aur Money Risk separately calculate karein.
VOLUME DATA LIMITATIONS
Wyckoff Theory historically direct Volume Observation wale markets se develop hui. Currency Futures centralized Exchange traded Volume provide kar sakti hai, Retail Spot Forex Broker Tick Activity different. COMEX Gold Futures aur XAUUSD CFD Trading Volume identical nahi. Effort vs Result compare karte waqt Source aur Contract specify karein. Volume Spike ka size Data Provider aur Session Opening Times se different ho sakta hai. Broker-only data global Bank Positioning ka verified record nahi.
CPI NFP FOMC NEWS
High-Impact Data ek perfectly drawn Wyckoff Range ke dono Boundaries cross karwa sakta hai. CPI/NFP Release fast Wick/Spread Widen aur Stop Slippage create kar sakti hai. Fundamental Repricing H1 Accumulation Theory instantly invalidate kar sakti hai. Agar News Avoid Rule written hai to ideal Spring label ki wajah se Event Trade na lein. Full M5 Confirmation, Structural SL aur Post-News Liquidity Conditions ka wait karein. No Trade valid decision hai.
STOP LOSS LOT SIZE
Wyckoff Spring Buy ka SL meaningful Sweep Low ke beyond aur Upthrust Sell ka Stop relevant Rejection High ke beyond possible. Lekin exact Price Distance Entry se calculate karein. EUR/USD Pip Value aur Gold Contract/Tick Value different. Account Equity Risk Budget se Lot choose karein. A++ Wyckoff Label Large Lot justify nahi. Opposing H1 Zone tak Reward kam ho to Setup Skip. Complex Theory basic Capital Protection replace nahi.
BACKTEST WITHOUT HINDSIGHT
Historical Chart Future Candles hide kar ke H1 Trading Range mark karein. Spring/Upthrust Candidate kab observable hui, record karein. M5 Entry Trigger Full Candle Close par actually tha ya afterwards Pattern perfect dikhi? Winners/Losers, Failed Candidates aur No Trade sab journal karein. Wyckoff Model vs simple H1 Demand + M5 CHoCH Strategy Net R compare karein. Spread, Commission aur Slippage add. Extra Labels Performance improve karte hain ya noise, data se judge karein.
COMMON MISTAKES
Every Consolidation ko Accumulation, every Upper Wick ko UTAD aur every Lower Sweep ko Guaranteed Spring kehna. Pattern result ke baad Range Boundaries shift karna. Composite Man ko real all-powerful Market Operator samajhna. Broker Tick Volume ko global institutional lot count kehna. H4 Trend ignore kar ke M5 Reversal Buy/Sell. NFP ke waqt tight stop aur oversized lot. Correct education exact invalidation, uncertainty aur controlled Risk bhi explain karti hai.
WYCKOFF FAQ
Har Spring Bullish Rally? Nahi. Har Upthrust Major Sell? Nahi. H1 Range = confirmed institutions accumulating? Nahi. Accumulation-looking Range Lower break? Haan. A–E Phases every market? Nahi. Fed CPI News Pattern fail? Haan. H4 Context → Range → Spring/Upthrust → Completed M5 CHoCH → Structural SL/Lot → Realistic Target. No Confirmation = No Trade.
PIPSEPAISA FREE COURSES
Sir Sajid Khan Ghori ka Free Forex Technical Analysis Course aur Sir Ghulam Abbas ka Free Forex Fundamental Analysis Course PipSePaisa par explore karein. Enrollment aur current details ke liye www.pipsepaisa.com ke Courses section par jayein. Ye sirf educational content hai; Forex aur leveraged Gold Trading mein financial loss ka risk hota hai.
Educational content only. Trading involves risk. Always use independent analysis and appropriate risk management.