
Commodity Channel Index (CCI) Explained: Forex Momentum, +100/-100 Signals and Trend Confirmation
PipSePaisa • Forex Education & Research
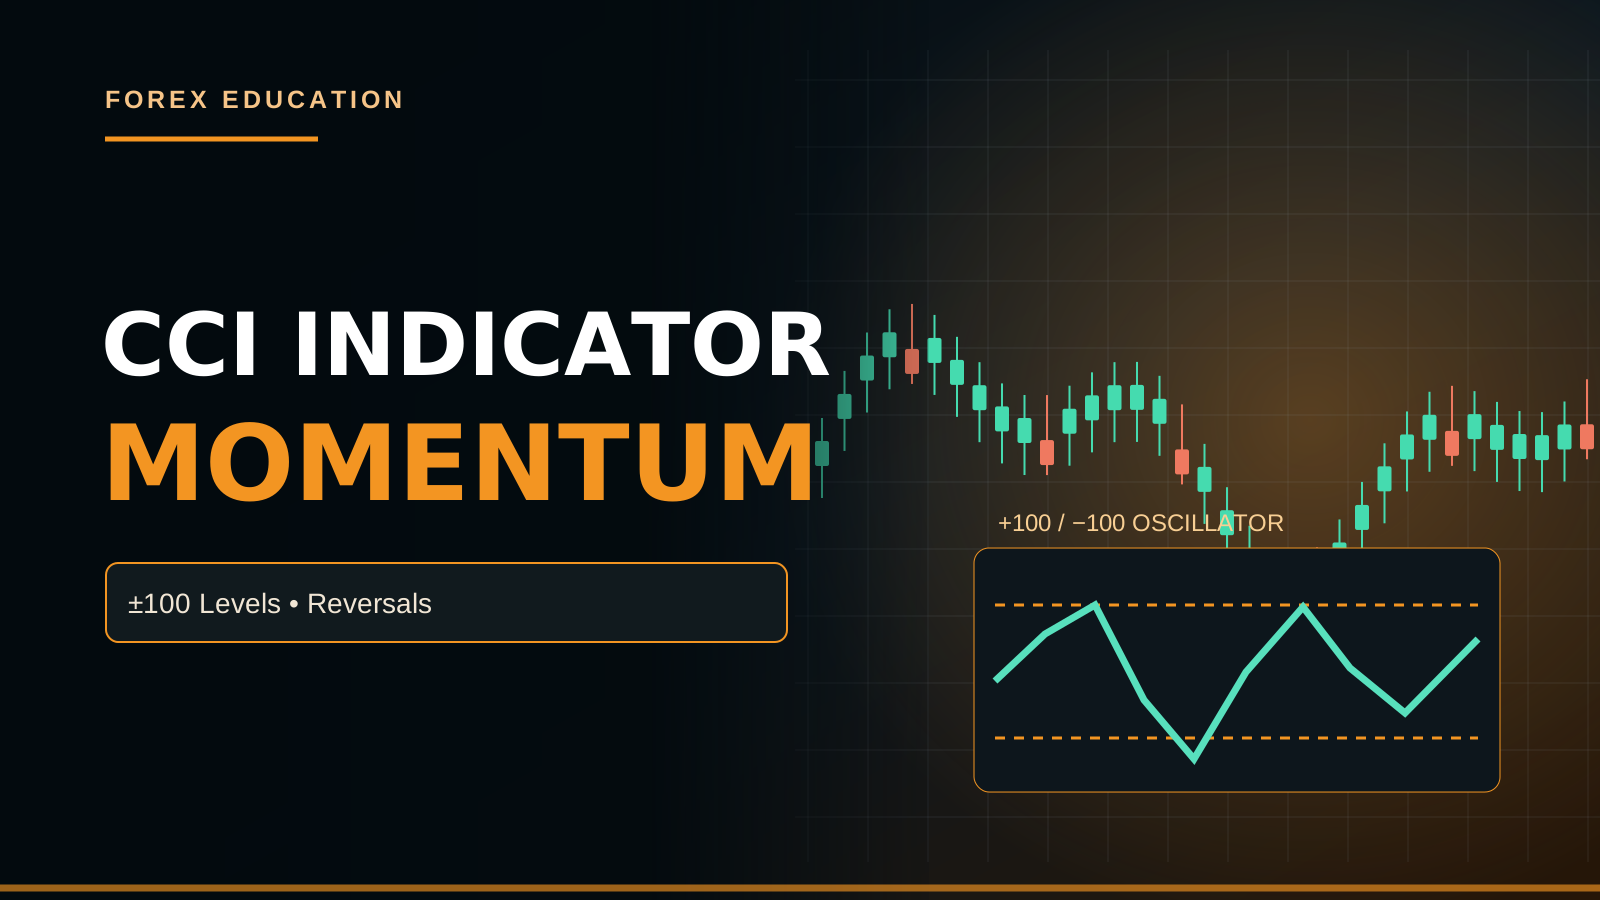
WHAT IS THE COMMODITY CHANNEL INDEX?
The Commodity Channel Index, or CCI, is a momentum-oriented oscillator introduced by Donald Lambert. Despite its commodity-related name, it can be applied to Forex, Gold and other instruments. It compares a measure of the current price level with its recent average, scaled by an estimate of normal deviation. The result fluctuates above and below zero and is not confined to a fixed range such as zero to one hundred. A high CCI reading reflects an extended relationship to recent mean price, not guaranteed future buying.
TYPICAL PRICE FORMULA
A common CCI calculation begins with Typical Price, defined as (High + Low + Close)/3 for the selected bar. It summarizes three price observations instead of using Close alone. For example, if a hypothetical candle has High 110, Low 98 and Close 104, Typical Price equals 104. The value may differ from the actual traded Close and is therefore not itself an executable market quote. If the broker supplies different OHLC data, the Typical Price and CCI can differ across platforms.
SIMPLE MOVING AVERAGE COMPONENT
CCI typically calculates a simple moving average of the Typical Price series over a chosen number of periods. This creates a local benchmark for how far the current Typical Price deviates from recent observations. A twenty-period window on H1 spans a different historical duration from twenty periods on M5. The average reacts as older bars leave and new bars enter the window. If an indicator appears slow on H4 and fast on M5, this may simply reflect different bar duration rather than software malfunction.
MEAN DEVIATION AND THE DENOMINATOR
The classic CCI formula uses the average absolute deviation of Typical Price from its simple moving average over the selected window. This positive quantity normalizes the current distance from the average. It is not the same as standard deviation, which squares differences before aggregation. Understanding the denominator helps explain why identical raw price moves can generate different CCI readings across volatile and quiet periods. If mean deviation is extremely small, software must handle numerical edge cases responsibly.
THE CLASSIC CCI FORMULA
A common definition is CCI = (Typical Price − moving average of Typical Price)/(0.015 × mean deviation). The constant 0.015 is a scaling convention associated with the original indicator rather than a fee or risk percentage. The calculation can produce values above +100 or below −100. It is wrong to assume the CCI result is a probability of winning a trade. A reading of +150 describes an oscillator relationship for the chosen instrument and period; it does not mean a 150-percent chance of price rising.
WHAT +100 AND -100 LEVELS MEAN
The +100 and −100 reference lines are widely discussed in CCI trading because they highlight relatively elevated or depressed oscillator readings under the conventional scaling. Their interpretation depends on strategy: a break above +100 could indicate strengthening upside momentum in a trend-following model, while some mean-reversion models might look for exhaustion. A fall beneath −100 can likewise mean strong downside momentum rather than an automatic Buy. Do not mix contradictory approaches on the same chart without written rules.
WHY CCI IS NOT BOUNDED AT 100
Unlike oscillators such as RSI that are commonly designed on a zero-to-one-hundred scale, CCI has no strict ±100 ceiling. During a powerful trend, readings can remain beyond +100 or below −100 for multiple bars and may reach larger magnitudes. Calling every +100 print an immediately overbought sell signal can therefore be dangerous. A trader must observe trend conditions and actual structure. A persistent high CCI may indicate sustained momentum rather than a near-term top.
CCI ABOVE ZERO VERSUS BELOW ZERO
The zero line describes whether the current Typical Price lies above or below its recent mean under the calculation. A positive CCI can coexist with ordinary price pullbacks, while a negative reading may appear during a bullish H4 market's short-term correction. Zero crossings can be used as optional trend context but tend to occur frequently in choppy conditions. They do not prove banks are opening or closing positions. Traders should interpret the line with the same timeframe and market regime as the intended trade.
CCI IN STRONG UPTRENDS
When price forms higher highs and higher lows, CCI may spend long stretches in positive territory and frequently test high reference levels. Some trend-following traders look for a pullback followed by renewed positive momentum, but the exact trigger should be defined with objective bars and closes. Buying immediately after an extreme reading far above H1 Demand may mean chasing an extended move. The location of the next H1 Supply often determines whether a new entry offers reasonable reward. A strong oscillator score cannot fix bad entry geometry.
CCI IN STRONG DOWNTRENDS
During bearish structure, CCI can remain negative for long intervals. A reading below −100 may reflect persistent selling pressure and not a reliable point for a countertrend Buy. For a trend-following Sell model, the trader may wait for price to retrace to H1 Supply and then observe CCI rolling negative with a completed M5 bearish structure break. Even then, the trade can fail. The structural Stop and available distance to opposing Demand matter more than the visual size of the CCI drop.
BULLISH CCI DIVERGENCE
A bullish divergence is sometimes described when price makes a lower low while CCI makes a higher low over roughly comparable swing points. This can suggest that downward momentum is weakening according to the oscillator. But divergence can persist while price keeps declining, especially in strong trends. Swing selection, timing and data source affect what appears on the chart. A meaningful H1 Demand Zone and completed M5 bullish CHoCH may provide separate confirmation, while the oscillator alone cannot establish that a reversal is underway.
BEARISH CCI DIVERGENCE
Bearish divergence may appear when price records a higher high but the oscillator's corresponding peak is lower. Some analysts treat this as a warning that upside momentum is not keeping pace with new prices. Yet the market may continue making higher highs, particularly after major positive economic news. A divergence should be defined using comparable confirmed swing points, not one arbitrary high from a different day. Wait for actual bearish price behavior near H1 Supply before considering a countertrend entry.
WHY DIVERGENCES CAN FAIL
CCI divergence does not directly identify where resting liquidity is located or how many traders will Buy or Sell. The price can change its momentum profile gradually while maintaining the same directional trend. Divergences may also look exceptionally accurate in hindsight when an analyst selects only those preceding visible reversals. A proper study must include failed signals, ongoing trends and periods when no comparable oscillator swing existed. Adding a divergence to a strategy is useful only if out-of-sample performance improves.
CCI VERSUS RSI
RSI is often computed using averaged gains and losses and is typically bounded between zero and one hundred. CCI instead compares Typical Price with its recent mean scaled by mean absolute deviation. Their overbought and oversold labels therefore arise from different formulas. A +100 CCI reading is not directly equivalent to RSI 70, even if both are highlighted on a chart. Indicator combinations should be tested for incremental value rather than treating similar colors or crossover patterns as independent confirmation.
CCI VERSUS STOCHASTIC
Stochastic compares the Close's location within a recent High-Low range according to its formula, while CCI compares Typical Price with a mean and deviation. These calculations respond differently to price moves. A Stochastic oversold reading and CCI below −100 can occur in a strong bearish trend without producing a Buy reversal. If a method uses both, specify which condition triggers a trade and which only provides context. A jumble of indicators without written rules is difficult to evaluate objectively.
CCI PARAMETER CHOICES
A twenty-period CCI is common in educational examples, but shorter or longer lookback choices change signal frequency and sensitivity. Shorter periods can produce faster swings and more noisy level crossings; longer periods can filter some noise but lag structural reversals. The appropriate settings depend on symbol, timeframe, volatility and the trading rules. Optimizing the lookback solely to maximize old Gold winners can create overfitting. Validate a chosen parameter on separate data and include realistic spreads, commissions and missed trades.
H4 H1 M5 CCI WORKFLOW
One possible technical workflow identifies H4 market structure, marks H1 Supply/Demand, then uses CCI as a supporting momentum filter while waiting for ordinary M5 candle confirmation. A bullish case might require H4 higher highs/lows, an H1 Demand reaction and a completed M5 bullish engulfing, with CCI recovering from negative territory. A bearish case mirrors those requirements. The signal should be tied to the completed price bar rather than a fluctuating oscillator on an unfinished candle. The indicator is optional context, not a trade guarantee.
EUR/USD EXAMPLE
Suppose EUR/USD H4 is bullish and price pulls back into H1 Demand. On M5, CCI recovers from below −100 toward the centerline while the chart completes a bullish engulfing candle and a higher low. This could be a conditional long setup under a tested approach. But if nearby H1 Supply limits reward or CPI is imminent, the trade might still be skipped. The oscillator recovering does not specify Stop Loss distance. Use actual entry-to-swing-low pips and broker pip value to set volume.
GOLD SELL EXAMPLE
Imagine XAUUSD reaches H4 Supply during a period of higher US real yields. CCI on M5 shows a lower high while Gold tests a price high, followed by a completed bearish structure break. A trader may consider a conditional Sell only if the Stop beyond the actual swing high and next H1 Demand allow sensible risk-to-reward. If the market continues above H4 Supply, the bearish divergence can fail. This is a hypothetical education example rather than a real-time Gold recommendation.
MT5 AND TRADINGVIEW IMPLEMENTATIONS
CCI indicators are available in many charting platforms, but price sources, smoothing conventions and historical feeds should be checked before matching their outputs. TradingView and MT5 may display different CCI levels if OHLC prices and session times are not identical. For automated trading, an EA needs to read completed indicator buffers and handle changes of timeframe and data readiness. Actual orders must be placed using executable market quotes, and the CCI line should not be mistaken for a Stop or target price.
CCI BACKTEST AND POSITION RISK
Evaluate a baseline H4 trend plus H1 zone and M5 confirmation model against a version that adds CCI thresholds or divergence. Keep stop placement, spread and position-risk budget consistent. Record both rejected winners and avoided losers. Track net R per trade, worst drawdown and trade frequency across trend and range conditions. If the strategy loses repeatedly during sideways markets, adding more oscillators might not solve a structural problem. A test using only successful screenshot examples cannot establish reliable performance.
CCI FAQ AND FINAL TAKEAWAY
Is CCI confined to −100 through +100? No. Does +100 guarantee the next candle is bullish? No. Is a reading below −100 always a Buy opportunity? No. Does a bullish CCI divergence always reverse a downtrend? No. Is CCI the same formula as RSI? No. Can it help visualize momentum relative to recent prices? Yes. Use CCI as a context indicator, define structure and completed M5 triggers, and protect the trading account with a realistic structural Stop and appropriately sized volume.
PIPSEPAISA FREE COURSES
Learn indicators, candlesticks and market structure in the Free Forex Technical Analysis Course by Sir Sajid Khan Ghori. Learn the economic data and market catalysts behind Forex and Gold in Sir Ghulam Abbas's Free Forex Fundamental Analysis Course. Check www.pipsepaisa.com Courses for current enrollment. Educational only; leveraged trading involves possible financial loss.
Read in Roman Urdu
CCI INDICATOR KYA HAI?
Commodity Channel Index CCI Donald Lambert ka momentum oscillator hai. Naam Commodity hai, lekin EUR/USD, XAUUSD Gold, Bitcoin ya Stocks charts par bhi calculate ho sakta. Ye current Typical Price ko past average aur Mean Deviation se compare karta hai. Values zero ke upar/niche aur ±100 se beyond move kar sakti hain. High CCI Reading automatic Buy ya future price guarantee nahi. H4/H1 Market Structure important. M5 Full Candle Confirmation ke baghair Entry nahi.
TYPICAL PRICE FORMULA
CCI Typical Price commonly (High + Low + Close) / 3. Hypothetical H=110, L=98, Close=104, Typical Price 104. Ye calculated price hai, actual Ask/Bid Broker Fill guarantee nahi. Some Indicator Implementations source price options provide kar sakti hain. If MT5 Broker Gold Candle High/Low TradingView Data different, CCI Numbers shift. Timeframe and price source consistent. Candle Calculation easy but Trade Direction independent.
CCI MOVING AVERAGE
CCI Typical Price observations ka N-Period Simple Moving Average calculate karta hai. N20 on H1 matlab selected 20 H1 Bars; N20 on M5 much shorter Trading Period. New Bars aane par Average update hota. H4 CCI Slow aur M5 CCI Rapid movement because Timeframe difference. Same Symbol and Period ka comparison correct. Price Action H1 Supply/Demand primary. CCI Calculated SMA actual financial return guarantee nahi.
CCI MEAN DEVIATION
Classic CCI denominator Typical Prices ki SMA se Absolute Deviations ka Average use karta hai. Ye Standard Deviation same nahi. Volatility/Ranges small hon to Price ki specific distance high CCI number create kar sakti hai; large Volatility par same Distance relatively less extreme. Indicator developer zero/small denominator edge cases handle kare. CCI high value fixed gold dollars Movement ya Pip Profit directly measure nahi. Price Normalization context.
CCI COMPLETE FORMULA
CCI = (Current Typical Price − N-Period SMA of Typical Price) / (0.015 × Mean Deviation), classic version. Number 0.015 Calculation Scaling Constant hai, Account Risk 1.5% nahi. CCI +150 ka matlab future Buy Success 150% Probability absolutely nahi. -120 Reading signal context, guaranteed downward Candle nahi. High/Lows aur Close based technical statistic. MT5 Gold Profit Lot/Contract Size separate.
CCI PLUS MINUS 100
CCI +100 aur -100 Popular Reference Levels. +100 Break Trend-Following system mein Bullish Momentum signal ho sakta, lekin Contrarian Strategy Overextended Reversal observe kare. -100 Break Strong Bearish Momentum ya possible oversold idea, depending Model. Dono interpretations opposite. Trader pehle decide kare Trend Continuation ya Mean Reversion. After Winning Result ke baad labels switch na karein. H1 Location and completed M5 Candle required.
CCI BOUNDLESS OSCILLATOR
RSI commonly 0–100 Scale, CCI strict +100/-100 Boundary par stop nahi hota. Gold Strong Trend mein CCI +200 ya higher, Downtrend -200 beyond possible. +100 immediately Sell aur -100 immediately Buy guaranteed rules wrong. H4 Trend strong ho to extreme Indicator multiple Bars persist. Supply/Demand Chart Context, M5 Structure and Risk/Reward matter. CCI Line crossing alone complete trading system nahi.
CCI ZERO LINE
CCI Zero above matlab current Typical Price recent average se above in calculation, zero below opposite. Positive CCI har Candlestick green guarantee nahi. H4 Uptrend mein M5 negative CCI temporary Pullback. Sideways Market mein Zero Line repeated Crosses fake signals. CCI Bank Order Flow directly show nahi karta. H4 Trend, H1 Zone and full M5 Confirmation needed. Select Timeframe properly.
CCI BULLISH TREND
H4 Higher High Higher Low Uptrend mein CCI often positive and +100 above for several Bars. H1 Demand Pullback ke baad Renewed Momentum conditional Buy context possible. Lekin CCI +200 after huge bullish candle par late Buy H4 Supply close ho to poor RR. M5 Bullish Engulfing complete and Swing Low SL calculate. Momentum Strength future Candle guarantee nahi. No Confirmation = No Trade.
CCI BEARISH TREND
H4 Lower High Lower Low aur CCI -100 below repeated ho sakta. -100 reading automatic Buy Oversold nahi; trend continue possible. Trend-Following Sell H1 Supply Pullback and M5 Bearish CHoCH Full Close, CCI negative Momentum Context. Structural SL Swing High ke beyond, nearest H1 Demand TP. Indicator steep drop huge Profit guarantee nahi. Spread and Lot matter.
CCI BULLISH DIVERGENCE
Price Lower Low banaye aur CCI comparable Swing mein Higher Low, possible Bullish Divergence. Downside Momentum Weakening clue but not guaranteed Reversal. H4 Bearish Trend continue aur multiple Divergences fail. H1 Demand location, Price Reclaim aur M5 Completed Bullish CHoCH confirm. Different Swing Times compare na karein. Repainting/After-Fact historical Pivot bias avoid. No Confirmation = No Trade.
CCI BEARISH DIVERGENCE
Price Higher High aur CCI corresponding Lower High display kare to possible Bearish Divergence. Strong H4 Uptrend mein Price further higher continue, divergence invalid-looking possible. Same Time Window Swings match karein. H1 Supply touch aur M5 Bearish Engulfing/CHoCH Full Close then conditional Sell. Divergence ek early warning observation, exact Bank Selling proof nahi. Account Dollar Risk same rakhein.
DIVERGENCE FAILURE
CCI Divergence global pending Bank Orders ka map nahi. Momentum Low improve ho to Downtrend still continue possible. Winning Chart ke baad perfect Two Swings select karna Hindsight Bias. All Failed Divergence, unconfirmed M5 setups aur sideways sessions record. Out-of-Sample compare CCI Filter vs basic H1 Zone/M5. Divergence Label A++ Probability mathematically prove nahi. Capital Protection important.
CCI VS RSI
RSI Average Gains/Losses based bounded 0–100 scale. CCI Typical Price difference/Mean Deviation based unbounded. CCI +100 and RSI 70 exact equivalent nahi. Dono Oscillators momentum/extension context de sakti, but combined signals independent Bank Votes nahi. H4/H1 Supply/Demand primary. Strategy Filter performance Test rather than Colors match. One Indicator enough ho to unnecessary complexity avoid.
CCI VS STOCHASTIC
Stochastic Current Close recent High/Low Range ke relative Position measure, CCI Recent Typical Price Average ka deviation. Both Oscillator yet same result guarantee nahi. Stochastic OS20 aur CCI -100 below Strong Downtrend mein repeated. Blind Buy against H4 down dangerous. M5 Full Bullish Price Confirmation H1 Demand par, then evaluate. Extra indicators exact Entry Rules clear hon. Journal net performance measure.
CCI PERIOD 20 VS 14
CCI Period 20 common example, some Traders 14/other use. Short Period Fast Signals more Noise, Longer Period smoother/late. EUR/USD M5 aur Gold H1 same period future Win Rate guarantee nahi. Selected Symbol and Broker Historical Data Backtest. Only Past Winning Days based perfect Settings choose Overfitting. Out-of-Sample Validation and Live Demo Testing. Original Lot/Stop discipline unchanged.
H4 H1 M5 CCI SETUP
Example H4 HH/HL, H1 P+ Demand, CCI negative se recovery and M5 Bullish Engulfing Full Close, conditional Buy. H4 LH/LL, H1 Supply, CCI down momentum and M5 Bearish CHoCH, conditional Sell. Har Rule objective. Forming M5 CCI intrabar change ho sakti, after Close check. CCI Filter missing ho to according system No Trade. Stop Swing beyond and target nearest Opposing Zone. No Confirmation = No Trade.
EUR/USD CCI BUY EXAMPLE
Hypothetical EUR/USD H4 Uptrend, H1 Demand Retest. M5 CCI -100 below se recover aur full Bullish Engulfing plus Higher Low. Conditional Buy SL meaningful Swing Low below, TP next H1 Supply. Agar TP just 8 Pips aur Stop 22 Pips, poor RR. CPI News qareeb ho to No Trade. CCI zero recovery sufficient Risk Plan nahi. EUR/USD Pip Value per Lot calculate.
GOLD CCI SELL EXAMPLE
Gold H4 Supply near aur US Real Yields higher hypothetical. M5 Gold New High but CCI Lower High possible divergence, then Bearish CHoCH Full Close. Conditional Sell SL actual swing above, TP H1 Demand. Gold H4 Supply above acceptance kare to Sell Thesis invalid. XAUUSD Contract Size and Broker Spread. Indicator Divergence not instant guaranteed reversal. Educational Example, real trade signal nahi.
MT5 TRADINGVIEW CCI
TradingView/MT5 CCI Values same hon to correct Data/Source and Period settings required. Broker OHLC differences se numbers shift. MT5 EA Indicator Handle/Buffer, completed bar index and TF refresh readiness. Signal on Forming Candle early trigger risk. Actual Broker Bid/Ask Orders and Contract Tick Value important. CCI line price quote nahi, SL/TP line automatically nahi. Backtest real Market Fill assumptions use.
CCI RISK BACKTEST
Basic H4/H1 Zone + M5 Confirmation vs Additional CCI Filter Data compare. Same Pair, Stops, TP, Spread, Lot Risk. Rejected Winners and Avoided Losers both journal. Net R, Max Drawdown aur Trend/Range Conditions. Sideways Market multiple Fake Divergence possible. More Oscillators add automatically profitable nahi. Minimum Lot risk exceed ho to skip. Historical Results future guarantee nahi. No Confirmation = No Trade.
CCI FAQ FINAL
CCI sirf -100 to +100? Nahi. +100 next Candle Green guarantee? Nahi. -100 automatic Buy? Nahi. Bullish CCI Divergence Downtrend Reverse guaranteed? Nahi. CCI RSI same Formula? Nahi. Momentum Context useful? Haan. Workflow H4 Structure → H1 Supply/Demand → CCI Optional Filter → M5 Full Engulfing/CHoCH Close → Structural SL/TP/Lot → Journal. No Confirmation = No Trade.
PIPSEPAISA FREE COURSES
Sir Sajid Khan Ghori ka Free Forex Technical Analysis Course aur Sir Ghulam Abbas ka Free Forex Fundamental Analysis Course ki current information www.pipsepaisa.com Courses tab mein check karein. Educational guide hai, personalized investment advice nahi. Gold/Forex leverage account loss risk.
CCI ALERT CHECKLIST
TradingView CCI Alert +100 Cross par set ho, lekin Candle Close se pehle oscillator value +100 upar ja kar below return possible. Isliye Once Per Bar Close condition evaluate karein if M5 Confirmation required. MT5 Expert Advisor CCI iCCI Buffer ka closed candle index correctly read kare. GBP/USD aur Gold ke spread/volatility difference ki wajah se same +100 Event same Dollar Profit/Loss imply nahi. Equity Risk-Based Lot size calculate karein. CPI/NFP/FOMC par oscillator extreme readings rapidly change. News Risk Filter aur H1 structural zone pehle.
CCI PRICE STRUCTURE VALIDATION
H4 Bullish Trend mein H1 Demand Zone touch aur CCI -100 se recover, but M5 Engulfing incomplete ho to no entry. Likewise Gold H4 Supply near CCI Divergence show kare magar Price Higher High continue aur CHoCH absent, Sell Skip. Post-Trade Journal mein CCI reading, signal Time, Actual Stop Price, Spread, Win/Loss R and mistakes record. Select only winning screenshots nahi.
Educational content only. Trading involves risk. Always use independent analysis and appropriate risk management.