
Liquidity Sweeps in Forex: Equal Highs, Equal Lows and Failed Breakouts
PipSePaisa • Forex Education & Research
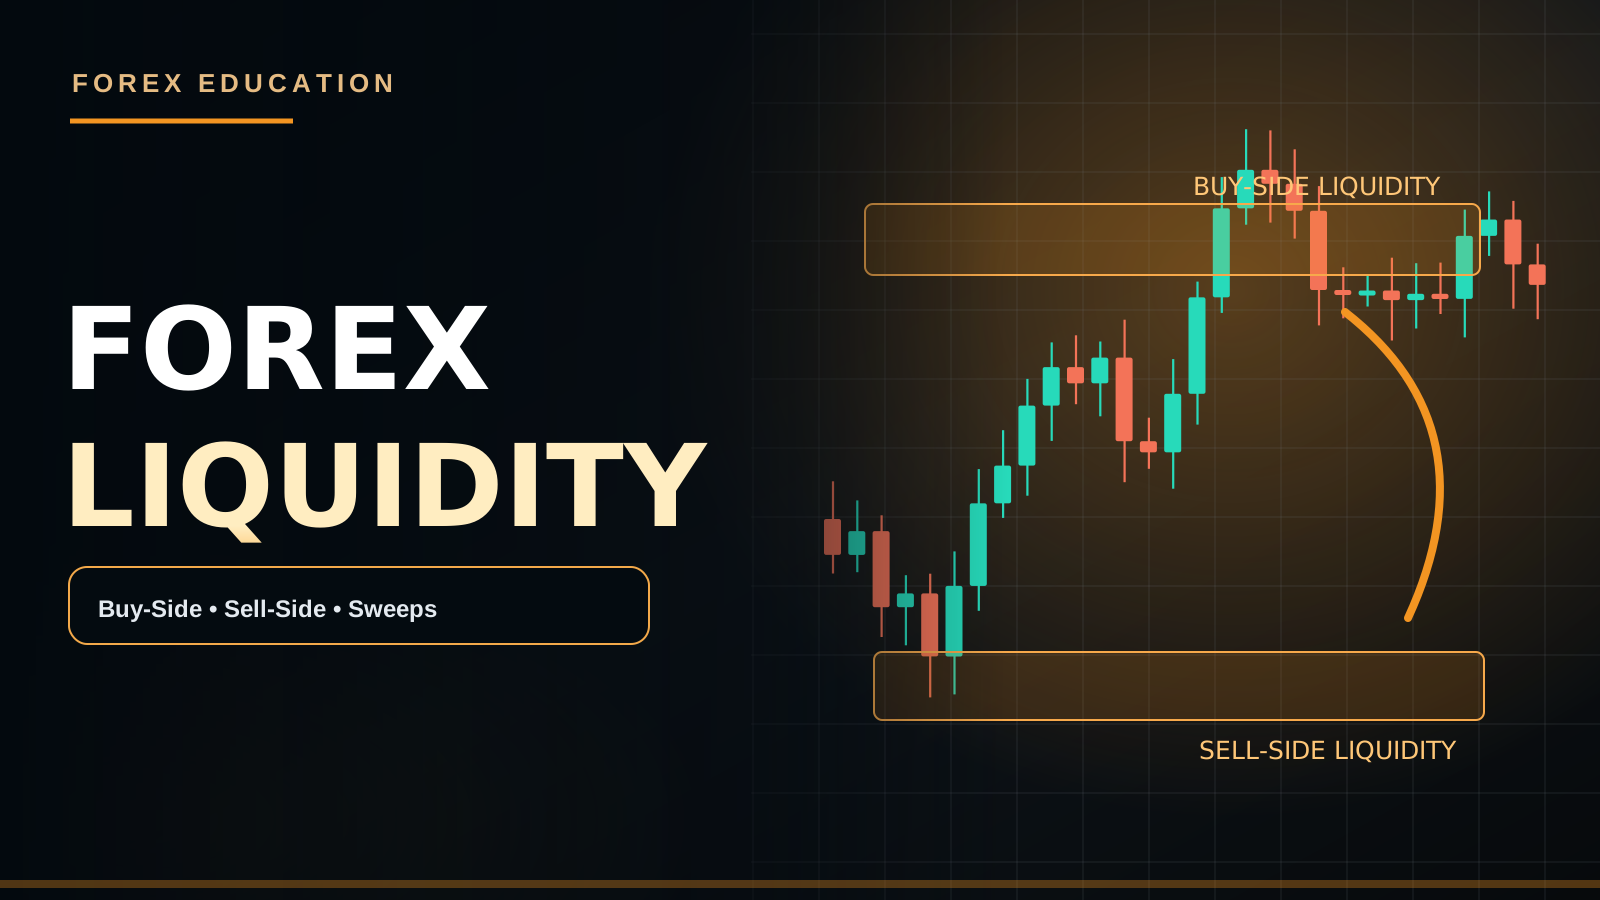
INTRODUCTION
A liquidity sweep is a label some price-action and SMC traders use when price briefly trades beyond an obvious previous high or low, then retreats. It may coincide with stop orders or breakout orders, but a candle chart does not prove who initiated the move or why.
1. FIND RELEVANT REFERENCE POINTS
Prior session highs and lows, equal highs/lows, clear swing extremes and round-number areas often attract attention. Larger H1/H4 swing points usually provide broader context than tiny random M1 oscillations.
2. BUY-SIDE SWEEP
A market trades above a prior high before closing back below it. The move may have triggered protective stops from shorts and buy-stop entries from breakout traders. A subsequent bearish structure shift may strengthen the failed-break interpretation.
3. SELL-SIDE SWEEP
Price trades below a prior low then reclaims it. That behavior can challenge a bearish breakout thesis. A lower-timeframe bullish close and higher low might offer further context, but the apparent reversal can still fail.
4. SWEEP OR GENUINE BREAK?
Look for follow-through. A genuine breakout may hold beyond the previous boundary and establish new structure. A sweep may return quickly inside the old range and fail on retest. Neither outcome is guaranteed in advance.
5. EDUCATIONAL EXAMPLE
Imagine GBP/USD has twice rejected near 1.2750. During the next test it trades to 1.2762 but an M15 candle closes near 1.2743. This is a possible buy-side sweep pattern. A trader might watch M5 for a lower high and bearish confirmation, using the sweep extreme as risk context.
6. ENTRY AND RISK
Do not short purely because a wick appeared. Define the trigger, appropriate structural stop and realistic target. Rapid news movements can widen spreads and invalidate an otherwise clean-looking setup.
7. LIMITATIONS
Spot FX order-flow data is fragmented. Equal highs do not reveal the exact location or size of all stop orders. Avoid declaring that a specific institution manipulated price based solely on a visual pattern.
FAQ
Can both sides be swept in the same session? Yes. Is a sweep always followed by a strong reversal? No.
WHAT FOREX LIQUIDITY MEANS
At its broadest, liquidity describes the capacity to buy or sell an asset without an excessive disturbance in price. In price-action and Smart Money Concepts discussions, the word also refers to possible concentrations of stop orders, breakout entries and resting interest near highly visible chart levels. Those are related but not identical definitions.
WHERE TRADERS LOOK FOR LIQUIDITY
Equal highs, equal lows, previous day high, previous day low, previous week extremes, major swing highs/lows and obvious Support/Resistance bands are popular references. Orders may cluster because many traders use the same visible chart levels. However, decentralized spot forex does not publish one complete global order book showing every broker's stops.
BUY-SIDE LIQUIDITY
Above an established swing high or series of equal highs, short sellers may have protective Buy Stop orders and breakout traders may also place Buy Stop orders. When price moves beyond the high, those orders may activate. The move can continue strongly upward or return below the level; order activation does not guarantee reversal.
SELL-SIDE LIQUIDITY
Below prior swing lows or equal lows, Buy positions may have protective Sell Stops and breakout traders may have Sell Stop entries. A move below a prior low can activate some of that interest. Again, the market may reverse, consolidate or keep declining.
LIQUIDITY SWEEP VS BREAKOUT
Suppose GBP/USD repeatedly stalls near 1.2750. Price pushes to 1.2762 but an M15 candle closes at 1.2743. That is a possible buy-side sweep and failed-break pattern. In contrast, a completed close above 1.2750 followed by a stable retest and new higher low may support a genuine breakout narrative. Neither can be known with certainty before follow-through forms.
CONFIRMATION SEQUENCE
Mark an H1/H4 liquidity reference, wait for the level to be reached, then observe whether price reclaims the prior range. On M5/M15 seek an actual structure shift, a completed engulfing/rejection candle or a breakout-and-retest sequence. Define the extreme that invalidates the trade and calculate lot size from that stop. A wick alone is not confirmation.
SESSIONS AND PREVIOUS DAY HIGHS/LOWS
London and New York active hours may create pronounced moves around previous session highs/lows. Those areas are not guaranteed trading signals. High-impact news can produce dramatic sweeps in both directions with wide spreads. A trader may reasonably stay flat until structure stabilizes.
IS THE MARKET HUNTING STOPS?
Charts can show where a sweep occurred; they cannot by themselves identify the intentions of banks, funds or market makers. Market movement also reflects economic releases, hedging, liquidity, changes in yields, risk appetite and genuine directional orders. Avoid asserting manipulation without independent evidence.
FAQ
Does every sweep reverse? No. Can both sides be swept in one session? Yes. Are Equal Highs/Equal Lows precise order maps? No. Best rule? Liquidity Area → Reaction → Confirmation → Risk Plan → Possible Entry.
LIQUIDITY HAS MORE THAN ONE TRADING MEANING
In the broad financial-market sense, liquidity is the ability to transact without moving price excessively. Traders also use the term for apparent areas where pending orders and protective stops may cluster. These meanings are related but should not be conflated. A broker's chart might show a sharp move through Equal Highs, but it does not disclose the complete set of global stop orders or all actual available market depth.
EQUAL HIGHS AND EQUAL LOWS
Equal Highs are two or more peaks forming in a similar price area; Equal Lows are comparable troughs. They are rarely exactly equal to the last decimal, so treat them as narrow bands rather than single perfect numbers. Breakout traders may place Buy Stops above equal highs and Sell Stops beneath equal lows. Traders already holding opposite positions may place protective orders there. These are possible behaviors, not visible confirmed inventory.
BUY-SIDE LIQUIDITY
Buy-Side Liquidity is commonly discussed around old swing highs, Equal Highs, Previous Day Highs and prominent Resistance levels. Short sellers may use protective buy orders above a previous high; momentum traders may also seek to Buy on a confirmed break. When price rises through the high, some orders may activate. That movement can fuel continuation or be followed by rejection. A buy-side sweep is not an automatic Sell instruction.
SELL-SIDE LIQUIDITY
Sell-Side Liquidity is commonly associated with Equal Lows, previous-day lows, major swing lows and Support boundaries. Long positions may have protective sell orders beneath these levels, while breakdown traders use sell-stop entries. Price can move through the level, activate orders, then reverse, consolidate or continue downward. The direction afterward depends on broader order flow, expectations and price behavior.
PREVIOUS DAY AND PREVIOUS WEEK EXTREMES
Daily and weekly highs/lows are widely followed because they offer shared reference points across timeframes. Intraday traders may monitor whether price breaks, retests or fails at these levels during London and New York. However, exact day boundaries depend on platform timezone, and some broker daily candles use different cutoffs. A consistent session-calendar convention is important for a meaningful test.
LIQUIDITY SWEEP VERSUS A REAL BREAK
Imagine GBP/USD previous H1 resistance near 1.2750. Price spikes to 1.2765 but M15 closes at 1.2740. That is a potential failed upside break. If price instead closes above 1.2750 and subsequent candles form higher lows beyond the boundary, the continuation interpretation strengthens. A wick alone cannot forecast the outcome; sustained closes and structure are more informative.
LIQUIDITY SWEEP VS STOP HUNT CLAIMS
A chart pattern can support the description 'price swept a prior high.' It does not by itself prove a particular bank intentionally manipulated retail traders. Genuine price discovery, hedging flows, news shocks, market-maker inventory adjustments and stop orders may all contribute. Distinguish observed price action from unsupported attribution of intent. Traders can use the pattern without claiming knowledge they do not possess.
THE SWEEP-CHoCH-CONFIRMATION MODEL
One educational short model is: identify Equal Highs on H1, wait for a breakout attempt, observe a close back below the highs, then require an M5 bearish CHoCH or confirmed lower high. Only then consider a Sell if the Stop Loss beyond the sweep extreme and the next logical target produce acceptable risk-to-reward. If price holds above the highs, the failed-break thesis weakens.
A BULLISH SELL-SIDE SWEEP MODEL
An H1 range has Equal Lows around 1.0980. Price trades to 1.0971 but an M15 candle closes back above 1.0980. Later M5 forms a bullish engulfing that closes above a local high. A trader might investigate a possible long with structural invalidation beneath the sweep low. But if the higher timeframe is strongly bearish and new macro data supports selling, price can sweep again and resume downward.
SESSION HIGHS AND LONDON OPEN
Some intraday methods monitor the Asian session high and low before the London open. A London move beyond an Asian extreme may be a breakout or an unsuccessful sweep. Neither is mandatory. The specific Asian window must be defined consistently in relation to UTC and daylight-saving changes. A trading method with shifting window boundaries cannot produce a reliable test.
VOLUME AND ORDER FLOW LIMITATIONS
Retail spot Forex tick volume usually reflects updates in quotes or broker activity, not global centralized traded volume. Futures data may provide a different view of transactions on a particular exchange. A Footprint or Delta chart based on centralized futures can be useful context but is not an exact full inventory of spot FX stop orders. Avoid calling every high-volume wick a confirmed institutional liquidity grab.
RISK MANAGEMENT AT SWEEP EXTREMES
The sweep high or low may be an intuitive reference for invalidation, but the actual Stop Loss should correspond to the written model and account for spread/volatility. Placing an extremely tight stop inside the swept band can make the trade vulnerable to a second test. If the Stop becomes too wide for acceptable lot size, skip. The next opposing Support/Resistance or range midpoint can offer more realistic targets than assuming a guaranteed long reversal.
ECONOMIC EVENTS AND FALSE SIGNALS
NFP, CPI and FOMC may produce two-sided spikes through prior-day extremes. Liquidity can thin and slippage rise. A sweep immediately during a release is not automatically the same setup as one occurring during a calmer session. Define whether the strategy excludes news windows. Waiting for completed M15 or M5 structure is a reasonable risk filter, though it cannot remove all uncertainty.
TESTING LIQUIDITY STRATEGIES
Write exact criteria for Equal Highs/Lows, reference timeframe, maximum wick extension, candle-close reclaim, CHoCH condition, retest rules, SL placement and target. Collect all qualifying trades, including failures and occurrences where the desired confirmation never appeared. Separate London, New York and news periods. Compare expectancy after transaction costs, not only gross pip movement.
FAQ
Can both buy-side and sell-side liquidity be swept in one session? Yes. Does every sweep reverse? No. Is a liquidity level identical to confirmed hidden stop volume? No. Does a successful sweep automatically prove market manipulation? No. Should a trade be skipped without confirmation? Yes, if that is the plan.
CONCLUSION
A liquidity sweep is useful as a structured way to discuss failed breaks, provided evidence, uncertainty and risk are kept separate.
PIPSEPAISA FREE COURSES
Sir Sajid Khan Ghori — Free Forex Technical Analysis Course. Want to join? Message us on WhatsApp or go to the Courses tab at www.pipsepaisa.com for enrollment.
Sir Ghulam Abbas — Free Forex Fundamental Analysis Course. Message us on WhatsApp or go to the Courses tab to enroll.
RISK DISCLAIMER
For education only, not personal financial advice. Leveraged trading risks capital loss.
Read in Roman Urdu
INTRODUCTION
Liquidity Sweep ka matlab chart par price ka obvious high/low ke paar ja kar phir wapas aana hota hai. SMC traders isay possible stop orders aur breakout traders ki activity se relate karte hain. Sirf wick se intention prove nahi hota.
1. KAHAN DEKHEIN
Previous session high/low, equal highs/lows, clear H1/H4 swings aur round numbers important reference ho sakte hain.
2. BUY-SIDE SWEEP
Price previous high ke upar trade kare aur wapas neeche close ho. Possible breakout failure ka clue milta hai. M5 bearish structure shift further confirmation ho sakti hai.
3. SELL-SIDE SWEEP
Price old low ke neeche jaaye phir wapas upar close kare. Bearish breakout weak ho sakta hai. Bullish confirmation candle aur higher low observe karein.
4. GENUINE BREAK SE FARQ
Real breakout level ke bahar hold kar ke new structure bana sakta hai. Sweep mein price jaldi range mein return kar sakti hai.
5. EXAMPLE
GBP/USD repeated high 1.2750 ho. Price 1.2762 wick banaye lekin M15 close 1.2743 ho. Ye possible buy-side sweep hai. M5 lower high aur bearish close wait kar sakte hain. Ye live signal nahi.
6. RISK
Sirf wick par blind sell na karein. Confirmation, structural SL aur next target define karein. News spread wider kar sakti hai.
7. LIMITATIONS
Spot FX fragmented hai; exact stop inventory chart se nahi dikhti. Specific institutions par manipulation ka claim bina evidence nahi.
FAQ
Kya same session dono taraf sweep? Haan. Kya har sweep giant reversal? Nahi.
FOREX LIQUIDITY KYA HOTI HAI?
Simple words mein Liquidity ka matlab market mein buyers aur sellers ki availability hai, taa ke transactions major price disturbance ke baghair execute ho saken. Price Action aur SMC ke context mein traders Liquidity un price areas ko bhi kehte hain jahan Stop Loss, pending breakout entries aur other orders ka cluster ho sakta hai. Ye do related lekin different meanings hain.
LIQUIDITY KAHAN HOTI HAI?
Equal Highs, Equal Lows, Previous Day High/Low, Previous Week High/Low, Major Swing High/Low aur obvious Support/Resistance zones traders ke liye important references hote hain. Kai traders same visible levels par Stop Loss ya Buy/Sell Stop orders rakhte hain. Lekin decentralized Forex mein ek complete global Stop Loss map publicly available nahi.
EQUAL HIGHS AUR BUY-SIDE LIQUIDITY
Jab price do ya zyada dafa almost same highs banati hai to Equal Highs kehte hain. In highs ke upar short sellers ke protective Buy Stop orders aur breakout traders ke Buy Stop entries ho sakti hain. Price upar cross kare to kuch orders trigger ho sakte hain. Lekin iske baad market reverse, sideways ya upward continuation teeno kar sakti hai.
EQUAL LOWS AUR SELL-SIDE LIQUIDITY
Jab price multiple times similar low banaye to Equal Lows hoti hain. In lows ke neeche Buy traders ke protective Sell Stops aur breakout traders ki Sell Stop entries ho sakti hain. Price low break kare to orders activate ho sakte hain, magar reversal ki guarantee nahi.
LIQUIDITY SWEEP EXAMPLE
GBP/USD repeatedly 1.2750 ke paas High banaye. Price 1.2762 tak spike de lekin M15 candle 1.2743 par close kare. Ye possible Buy-Side Liquidity Sweep hai. Agar price 1.2750 se upar strong close kar ke retest hold kare aur Higher Low banaye to genuine Breakout ka scenario stronger ho sakta hai.
SWEEP + CONFIRMATION
Pehle H1/H4 par Liquidity Area mark karein. Price zone tak aane ka wait karein. Dekhein level cross kar ke price range mein wapas aa rahi hai ya bahar hold karti hai. M5/M15 CHoCH, completed Engulfing, Rejection ya Breakout/Retest jaisi confirmation seekhein. Invalidation swing aur lot size calculate kar ke hi trade consider karein. Sirf wick = entry nahi.
PREVIOUS DAY HIGH/LOW AUR SESSIONS
London aur New York mein Previous Day High/Low ke around strong moves possible hain. Lekin CPI/NFP news par dono taraf spikes, slippage aur wide spread aa sakte hain. Market unstable ho to No Trade valid decision hai.
KYA MARKET STOP LOSS HUNT KARTI HAI?
Har Wick ko intentional Stop Hunt kehna accurate nahi. Banks, funds, hedgers, institutions, retail traders, economic data, rates aur sentiment sab price ko affect karte hain. Chart se specific institution ki niyyat prove nahi hoti.
FAQ
Har Sweep reversal? Nahi. Same session dono sides sweep? Haan. Equal Highs exact order map? Nahi. Rule: Liquidity Area → Reaction → Confirmation → Risk Plan → Entry.
LIQUIDITY KE DO COMMON MEANINGS
Financial Market mein Liquidity ka broad matlab ye hai ke buying/selling transactions major price disturbance ke baghair execute ho saken. SMC aur Price Action community mein Liquidity un chart areas ko bhi kaha jata hai jahan Stop Loss aur Pending Breakout Orders cluster ho sakte hain. Ye meanings related hain lekin exactly same nahi. Broker chart par Equal Highs ke upar strong wick dekh kar complete global Stop Order inventory confirm nahi hoti.
EQUAL HIGHS AUR EQUAL LOWS
Equal Highs jab do ya zyada Swing Peaks almost same Price Zone par banein. Equal Lows jab multiple Swing Lows similar area par hon. Last decimal tak exact equality necessary nahi, is liye narrow band consider karein. Breakout Traders Equal Highs ke upar Buy Stop aur Equal Lows ke neeche Sell Stop rakh sakte hain. Opposite Positions walay traders protective Stops bhi wahan rakh sakte hain. Ye possible order behaviors hain, publicly verified complete list nahi.
BUY-SIDE LIQUIDITY
Buy-Side Liquidity usually Previous High, Equal Highs, Previous Day High ya Resistance ke upar discuss hoti hai. Short Sellers apna protective Buy Stop old Swing High se upar laga sakte hain. Momentum Traders bhi confirmed breakout par Buy Stop use kar sakte hain. Price high cross kare to kuch orders trigger ho sakte hain. Lekin is movement ke baad continued bullish rally ya bearish rejection, dono possible hain. Buy-Side Sweep immediate Sell ki guarantee nahi.
SELL-SIDE LIQUIDITY
Sell-Side Liquidity Equal Lows, Previous Day Low, old Swing Lows aur Support levels ke neeche possible hoti hai. Buy Positions ki protective Sell Stops aur Breakdown Traders ki Sell-Stop Entries yahan ho sakti hain. Price low break karne ke baad reverse bhi ho sakti hai, Range bana sakti hai ya same bearish direction continue. Next movement broader Market Context aur Order Flow par depend karti hai.
PREVIOUS DAY AUR WEEK LEVELS
Previous Day High/Low aur Previous Week High/Low widely watched reference levels hain. Intraday Traders London/New York mein inka Breakout, Retest ya Sweep observe karte hain. Lekin daily candle boundary Broker Timezone ke mutabiq different ho sakti hai. Consistent Session Calendar use karna zaroori hai. Har din alag Day Cutoff use karne se Backtest results meaningful nahi rehte.
SWEEP AUR REAL BREAKOUT MEIN FARQ
GBP/USD H1 Resistance around 1.2750 hai. Price 1.2765 tak spike de lekin M15 candle 1.2740 par close kare. Ye possible Buy-Side Sweep aur Failed Break ka pattern hai. Agar price 1.2750 ke upar complete close de aur aglay candles higher lows hold karen to genuine continuation scenario stronger hai. Sirf wick par future direction 100% predict nahi hoti.
STOP HUNT CLAIM KO CAUTIOUS RAKHEIN
Chart par clearly observe ho sakta hai ke price Previous High sweep kar ke wapas aayi. Lekin sirf is se prove nahi hota ke specific Bank ne intentionally Retail Stop Loss hunt kiye. Hedging, Economic News, Market-Maker Inventory, real orders aur price discovery sab contribute kar sakte hain. Observed Price Action aur Institutional Intent ke unsupported claims ko separate rakhein. Liquidity concept seekhne ke liye conspiracy-style certainty zaroori nahi.
SWEEP → CHoCH → CONFIRMATION STRATEGY
Hypothetical Sell Model: H1 Equal Highs identify karein. Price high ke upar breakout attempt kare. M15 ya strategy-defined Candle old Range ke andar close ho. M5 bearish CHoCH ya Lower High confirm kare. Uske baad hi possible Sell evaluate karein. Stop Loss Sweep Extreme ke beyond aur Target Next Logical Support/Range Level tak. Agar price High ke upar hold kar rahi hai to Failed Break hypothesis weak ho jati hai.
SELL-SIDE SWEEP BULLISH EXAMPLE
H1 Equal Lows around 1.0980 hain. Price temporarily 1.0971 tak drop kare lekin M15 wapas 1.0980 ke upar close kare. Phir M5 Bullish Engulfing previous local High ke upar close de. Ye possible Buy setup ka confirmation clue hai. SL relevant Sweep Low ke beyond ho sakta hai. Lekin H4 strong Downtrend aur unexpectedly USD-positive News ho to price dobara low break kar ke bearish continuation bhi de sakti hai.
ASIAN HIGH LOW AUR LONDON OPEN
Kuch Intraday Traders Asian Session ki High/Low Range pehle mark karte hain. London Open par price Asian Extreme cross kare to genuine Breakout ya Liquidity Sweep dono possible hain. Koi outcome compulsory nahi. Asian Window ka Start/End UTC aur DST differences ke mutabiq consistently define karein. Arbitrary session boundaries se honest performance testing weak ho jati hai.
VOLUME AUR ORDER FLOW KI LIMITATION
Spot Forex ka Tick Volume usually broker quotes/price updates ki activity show karta hai, world-wide centralized traded Lots nahi. Futures Volume, Footprint ya Delta ek specific centralized market ki traded transactions ka useful context de sakte hain, lekin pure Spot Forex stops ka exact map nahi. Har High-Volume Wick ko guaranteed Institutional Sweep kehna justified nahi.
STOP LOSS SWEEP EXTREME PAR KAISE?
Sweep ka High ya Low possible structural reference ho sakta hai, lekin SL actual Entry Model aur Spread/Volatility ke mutabiq define karein. Bohat Tight Stop swept area ke andar ho to second test par hit ho sakta hai. Agar Stop wide ho aur acceptable Lot possible na ho to Trade Skip. Target Range Midpoint ya Next Opposing Level ho sakta hai; guaranteed huge reversal ka assumption na karein.
CPI NFP AUR FOMC SWEEPS
High-impact Economic Data par Price Previous Day High aur Low dono sides rapidly sweep kar sakti hai. Spread Wide aur Slippage risk bhi barh sakta hai. News Spike ko quiet session Liquidity Setup jaisa assume na karein. Strategy ke News Filters likhein. M5/M15 Completed Structure Close ka wait risk filter ho sakta hai, guaranteed protection nahi.
LIQUIDITY STRATEGY BACKTEST
Equal High/Low ka exact tolerance, Timeframe, Wick Extension, Close-Reclaim rule, CHoCH definition, Retest Condition, SL, TP aur News Exclusion pehle write karein. Har qualifying historical trade include karein, winners aur losers dono. Jo setup confirmation tak nahi pohanchay unhein bhi note karein. London vs New York outcomes aur Net Costs compare karein.
FAQ
Ek session dono sides sweep? Haan. Har Sweep reversal? Nahi. Kya Equal High actual hidden stop volume prove karta hai? Nahi. Kya Sweep intentional manipulation ka proof? Nahi. Confirmation na mile to No Trade? Haan, agar strategy ka rule hai.
CONCLUSION
Liquidity sweep ko failed-break behavior ke context mein samjhein aur confirmation ka wait karein.
PIPSEPAISA FREE COURSES
Sir Sajid Khan Ghori ka Free Forex Technical Analysis Course join karne ke liye WhatsApp par message karein ya www.pipsepaisa.com ke Courses tab mein enroll karein.
Sir Ghulam Abbas ke Free Forex Fundamental Analysis Course ke liye bhi WhatsApp ya Courses tab se enroll karein.
DISCLAIMER
Sirf education ke liye; trading mein loss ka risk hai.
Educational content only. Trading involves risk. Always use independent analysis and appropriate risk management.