
Forex Market Structure: Higher Highs, Higher Lows, Lower Highs and Lower Lows
PipSePaisa • Forex Education & Research
INTRODUCTION
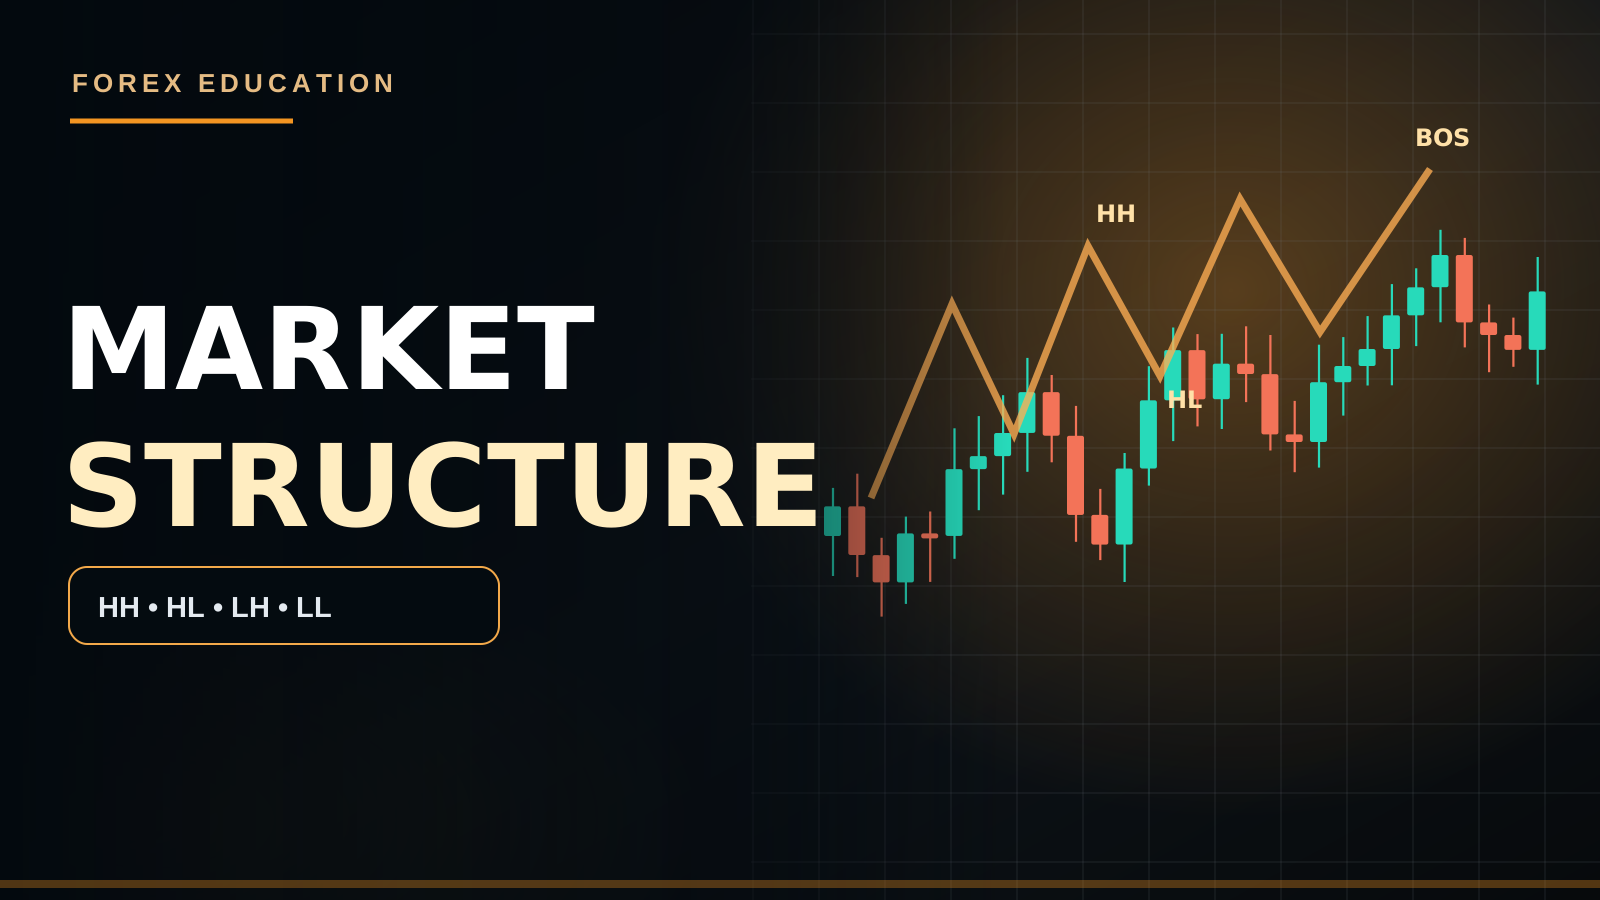
Market structure describes the sequence of price swings. Rising peaks and troughs generally suggest upward control; falling peaks and troughs suggest downward control. The practical challenge is deciding which swings matter on the chosen timeframe and recognizing when a trend is simply pulling back.
1. SWING HIGHS AND SWING LOWS
A swing high is a local peak relative to nearby candles; a swing low is a local trough. Traders use different confirmation rules, such as waiting for multiple candles on each side. The exact labeling method should be consistent in backtests and live trading.
2. UPTREND STRUCTURE
When price repeatedly forms higher highs (HH) and higher lows (HL), buyers have maintained upward progress. A pullback into an earlier HL or demand area may create a potential continuation location, but lower-timeframe confirmation and invalidation still matter.
3. DOWNTREND STRUCTURE
Lower lows (LL) and lower highs (LH) describe repeated downward progress. A rally toward previous supply can be a pullback, not a new uptrend. Traders should distinguish a temporary bullish candle from a break of meaningful bearish structure.
4. RANGES AND MIXED STRUCTURE
If peaks and troughs overlap, the market may be balancing within a range rather than trending. During a range, aggressive labeling of every micro swing as a new trend can cause unnecessary trades.
5. BREAK OF STRUCTURE
A break beyond a previous significant swing in the direction of the established trend is commonly described as a continuation break of structure (BOS) in some trading frameworks. A break opposing the current swing sequence may raise the possibility of a change of character (CHoCH). Naming conventions vary across educators; use explicit price rules.
6. EDUCATIONAL EXAMPLE
Suppose Gold produces highs of 100, 106 and 112, and lows of 96, 102 and 108. That is an illustrative HH/HL sequence. A close below 108 weakens the nearest rising swing; a larger H4 reversal may require breaking a more important low. The relevant scale matters.
7. MULTI-TIMEFRAME CONFUSION
A five-minute downtrend can exist inside an hourly uptrend. Neither description is contradictory. Decide which timeframe determines your directional thesis and which handles entry timing.
FAQ
Does one lower low always reverse a trend? No, significance depends on timeframe and swing selection. Are wicks enough for structure breaks? Different systems use different rules; candle closes can filter some false breaks.
HOW PRICE CREATES SWING STRUCTURE
Market structure is an ordered series of swing peaks and troughs. A swing high forms where upward progress temporarily stops and price retreats; a swing low forms where downward progress pauses and rebounds. Decide whether your method requires a fixed number of surrounding candles or a completed close. Without a consistent swing definition, any chart can be made to fit a preferred trend.
UPTREND: HIGHER HIGH AND HIGHER LOW
A rising sequence might show lows at 96, 102 and 108 while highs progress 100, 106 and 112. This illustrates buyers making successive price advances. Yet an uptrend can include bearish candles and M5 pullbacks; not every lower-timeframe Sell signal is a major reversal.
DOWNTREND: LOWER HIGH AND LOWER LOW
A downtrend can show lower peaks and lower troughs. Rallies toward an earlier Lower High or Supply Zone can be countertrend pullbacks. When a trader calls every green candle a bullish reversal, they confuse local candle direction with higher-timeframe structure.
BOS AND CHoCH
In common SMC language, BOS may describe a decisive break of an important prior swing in the prevailing direction. CHoCH may refer to a break that challenges the previous sequence. Definitions vary; some require a candle close, others a wick break. Label your rules before backtesting and distinguish internal M5 structure from H1/H4 structure.
WHAT HAPPENS IN A RANGE?
When highs and lows overlap and neither HH/HL nor LH/LL progresses cleanly, price may be ranging. Breakout traders can suffer repeated false starts. Range traders may instead watch the extremes, but a strong news release may convert the entire structure into a trend.
MULTIPLE TIMEFRAME EXAMPLE
H4 can remain bullish while H1 is bearish during a pullback. On H1, price may break a local low but approach an H4 demand area. A lower-timeframe bullish CHoCH after a test may indicate the H1 pullback is weakening. This is a conditional scenario, not proof that the H4 uptrend must continue.
ENTRY AND INVALIDATION
Use structure to answer three questions: What is the trend? Where could price react? At which swing would my idea be wrong? Place potential targets at structural extremes or opposing zones. Check spread, slippage and the economic calendar.
FAQ
Does one lower low reverse the market? It depends on swing importance and timeframe. Can a wick alone be BOS? Only if that is part of a pre-defined method. Does H4 always override M5? H4 gives broader context, not certainty.
WHAT COUNTS AS A SWING?
A swing high is a meaningful local peak and a swing low a meaningful local trough, but their significance depends on timeframe and definition. Some approaches confirm a peak only after subsequent candles fail to exceed it. Others define structure using impulsive legs and corrections. A consistent rule is essential because otherwise a trader can redraw swings after the price outcome is known. A minor M1 peak should not automatically have the same status as an H4 multi-session high.
BULLISH STRUCTURE AND CONTINUATION
In a bullish sequence, price makes a Higher High followed by a Higher Low, then another Higher High. This suggests upward progress in that timeframe. A normal correction can produce several bearish candles, a temporary M5 downtrend or even a break of a small internal low. As long as the significant H4 Higher Low remains intact under the chosen model, the broader bullish thesis may still be alive.
BEARISH STRUCTURE AND RALLIES
A bearish sequence produces Lower Lows and Lower Highs. Price may rally after a sharp decline and form bullish engulfing candles during the correction. Such a rally can be a countertrend retracement toward Supply rather than evidence of a full reversal. A trader who labels every upward candle as a new uptrend is confusing candle direction with swing hierarchy.
RANGING MARKET AND STRUCTURAL OVERLAP
When price repeatedly reaches similar highs and lows without clear directional progress, it may be balancing inside a range. The middle of a range often produces confusing short-term BOS/CHoCH signals. Clear Support and Resistance boundaries, previous session extremes and upcoming news may matter more than labeling every local wave. Trend-following and mean-reversion systems respond differently to this environment.
BREAK OF STRUCTURE AS A RULE
A common SMC definition uses BOS for a decisive break of a meaningful swing in the direction of the prevailing trend. For example, in an H1 uptrend, a completed candle close above the prior H1 Higher High may be a bullish BOS. But the exact candle-close and swing-confirmation rules vary by educator. Stating your rule allows an objective backtest; the label alone contains no guaranteed trade instruction.
CHANGE OF CHARACTER AS A WARNING
CHoCH often refers to an opposing structural break that challenges the previous sequence. If an uptrend's significant Higher Low is broken, some traders describe a bearish CHoCH or Market Structure Shift. That can be an early warning, but the market may range or resume upward. H1 CHoCH is not automatically a bearish H4 reversal. Look for a new Lower High, retest or other follow-through evidence if the model requires it.
INTERNAL AND EXTERNAL MARKET STRUCTURE
External structure refers to the larger significant swings defining broad trend context; internal structure refers to smaller movements within a larger leg. A bearish M5 CHoCH can appear inside an H1 uptrend during pullback. An H1 break of a confirmed external low is more significant than a tiny M5 low break. Both are observations, but they answer different analytical questions.
STEP-BY-STEP BUY EXAMPLE
Assume H4 makes Higher Highs and Higher Lows. H1 pulls back into a previously marked Demand Zone. On M15, the downward movement slows. M5 forms a bullish CHoCH and later a completed bullish engulfing above local resistance. A trader may evaluate a Buy with Stop Loss beyond the meaningful rejection swing and TP around the preceding H1 High. If H1 demand decisively fails, the scenario is invalidated.
STEP-BY-STEP SELL EXAMPLE
A hypothetical GBP/USD downtrend forms lower highs and lower lows on H1. After breaking a significant low, price returns to H1 Supply near a previous Lower High. M5 produces a lower high and a bearish candle closes below local support. This may fit a trend-following Sell model. A sudden bullish H4 structural break or surprise economic data could change the context, so the plan needs a clear invalidation point.
WICK SWEEP VERSUS STRUCTURE BREAK
A Wick can trade beyond a previous high and return inside the old range. That is not necessarily equivalent to a confirmed structure break under a close-based model. Some aggressive strategies use wick penetration; others require full candle closes. Neither definition is automatically superior. For reliable testing, avoid switching from wick to close criteria depending on the historical result.
SWING STRUCTURE AND SUPPLY/DEMAND
Market Structure helps identify direction, while zones help identify locations. A bullish H4 swing sequence aligned with H1 Demand may be a better context for trend continuation than an isolated Demand Zone inside a strong bearish H4 trend. Order Blocks and Fair Value Gaps can offer additional price areas, but should not replace the need to understand the higher-timeframe swing sequence.
JOURNALING STRUCTURAL ANALYSIS
Mark the most recent confirmed H4 high/low and H1 high/low before entry. Record whether an M5 BOS or CHoCH actually completed, whether the setup was with the trend or countertrend, and what swing would invalidate it. After the trade, review whether you incorrectly labeled a minor internal low as a major external one. This is a frequent source of premature reversals.
FAQ
Can H1 and H4 have opposite directions? Yes. Does one Lower Low end every uptrend? Depends on swing hierarchy. Is a Wick enough for BOS? Only if explicitly in your rules. Should a BOS be traded without level and risk analysis? No. Does CHoCH guarantee reversal? No.
CONCLUSION
Name swings consistently, map their hierarchy and use structure for context rather than as a guaranteed forecast.
PIPSEPAISA FREE FOREX COURSES
Sir Sajid Khan Ghori — Free Forex Technical Analysis Course. Want to join? Message the PipSePaisa team on WhatsApp or visit the Courses tab at www.pipsepaisa.com for enrollment.
Sir Ghulam Abbas — Free Forex Fundamental Analysis Course. Message on WhatsApp or use the Courses tab to enroll.
DISCLAIMER
For education only. Hypothetical examples are not trading signals; leveraged trading involves risk of losing capital.
Read in Roman Urdu
INTRODUCTION
Market Structure price ke swing highs aur swing lows ki sequence ko kehte hain. HH/HL generally bullish progress aur LH/LL bearish progress show karte hain. Sab se important baat meaningful swing select karna hai.
1. SWING POINTS
Swing High local peak aur Swing Low local trough hai. Aapko ek consistent method select karna chahiye, jaise nearby candles se comparison aur completed close ka wait.
2. UPTREND
Higher High aur Higher Low repeat hon to bullish structure hai. HL ya demand ke qareeb pullback possible continuation area ho sakta hai, lekin confirmation mandatory hai.
3. DOWNTREND
Lower High aur Lower Low bearish structure show karte hain. Supply tak pullback ko automatically bullish reversal na samjhein.
4. SIDEWAYS MARKET
Jab highs/lows overlap karte hain, price range mein ho sakti hai. Har M1 swing ko naya trend label karna confusion paida karta hai.
5. BOS AUR CHoCH
Trend direction mein significant swing break ko kuch SMC frameworks BOS kehte hain. Opposite break CHoCH ka clue ho sakta hai. Different mentors definitions differently use kar sakte hain, is liye objective rules likhein.
6. EXAMPLE
Gold ke hypothetical highs 100, 106, 112 aur lows 96, 102, 108 hon to HH/HL sequence hai. 108 ke neeche close near-term structure weak kar sakta hai, lekin full H4 reversal confirm karne ke liye bigger swing dekhein.
7. TIMEFRAME
M5 bearish aur H1 bullish ek saath ho sakte hain. Entry timeframe ko overall bias se confuse na karein.
FAQ
Kya ek LL se trend reverse? Zaroori nahi. Wick vs close? Apne fixed rules follow karein.
MARKET STRUCTURE KAISE BANTI HAI?
Structure Swing High aur Swing Low ki series hoti hai. Swing High temporary peak aur Swing Low temporary trough hai. Aapko pehle decide karna hota hai ke swing confirm karne ke liye kitni candles aur close chahiye. Bina consistent rule ke chart par koi bhi preferred trend bana sakte hain.
UPTREND: HH AUR HL
Misaal lows 96, 102, 108 aur highs 100, 106, 112 hon to Higher Low aur Higher High sequence hai. Ye buyers ki continued progress show karti hai. Lekin is uptrend ke andar red M5 candles aur short pullbacks aa sakti hain. Har red candle major reversal nahi.
DOWNTREND: LH AUR LL
Downtrend mein Lower High aur Lower Low bante hain. Price old LH ya Supply Zone par pullback kar sakti hai. Har green candle ko bullish reversal kehna local move aur overall structure ka confusion hai.
BOS AUR CHoCH
SMC mein trend direction ke important swing break ko BOS kaha ja sakta hai. Opposite break CHoCH ka early clue ho sakta hai. Kuch traders Wick aur kuch completed Candle Close use karte hain. Backtest mein same rule rakhein. M5 internal structure aur H1/H4 major structure alag samjhein.
RANGING MARKET
Jab Highs/Lows overlap karte hain aur clean HH/HL ya LH/LL nahi banti, price range mein ho sakti hai. Breakout strategy repeated fakeouts de sakti hai. Range extremes par reaction possible hoti hai, lekin news se poora regime badal sakta hai.
H4 AUR H1 EXAMPLE
H4 overall bullish hai lekin H1 par bearish pullback chal raha hai. H1 low break ho kar price H4 Demand Zone par aati hai. Wahan M5 bullish CHoCH milay to pullback weak hone ka clue ho sakta hai. Lekin H4 trend continuation guaranteed nahi.
TRADING PLAN
Structure se 3 sawal clear karein: Direction kya? Possible reaction area kahan? Kis swing par idea invalid? TP prior high/low ya opposite zone par consider karein. Spread aur news calendar check karein.
FAQ
Ek LL trend reverse? Hamesha nahi. Wick BOS count? Apne defined rules par depend. H4 always correct? Nahi.
SWING HIGH AUR SWING LOW KAB CONFIRM HOTA HAI?
Swing High ek meaningful local price peak aur Swing Low ek meaningful trough hota hai. Lekin importance Timeframe aur Swing Definition se decide hoti hai. Kuch strategies peak tab confirm karti hain jab aglay candles us High ko break na karen. Doosre models Impulsive Moves aur Pullbacks use karte hain. Agar rule consistent na ho to Trader outcome dekh kar purane swings shift kar sakta hai. M1 ka chhota high aur H4 ka multi-session high same importance nahi rakhte.
BULLISH STRUCTURE MEIN NORMAL PULLBACK
Uptrend mein pehle Higher High, phir Higher Low, phir new Higher High aata hai. Is se chosen timeframe par upward price progress show hoti hai. Lekin correction ke waqt kai Red Candles ya M5 chhota Downtrend ban sakta hai. Agar H4 ka main Higher Low abhi intact hai to broader Bullish Structure continue reh sakti hai. Har M5 Bearish Engulfing se H4 bearish reversal conclude karna incorrect ho sakta hai.
BEARISH STRUCTURE AUR BULLISH RALLY
Downtrend mein Lower Low aur Lower High repeat hote hain. Strong fall ke baad price upar retrace kar sakti hai aur bullish candles bhi ban sakti hain. Ye rally kabhi Countertrend Pullback hoti hai jo Supply Zone ke qareeb complete ho sakti hai. Har Green Candle ko market reversal na samjhein. Swing hierarchy dekhein ke new High previous significant Lower High ke upar break hua ya nahi.
RANGE MEIN STRUCTURE CONFUSION
Sideways market mein price similar Highs aur Lows ke darmiyan move karti rehti hai. Range ke middle par kai fake M5 BOS aur CHoCH signals mil sakte hain. Clear H1 Support/Resistance, Previous Session Extremes aur News Events par focus karna zyada useful ho sakta hai. Trend-Following system is environment mein repeated losses de sakta hai jabke Range Model differently behave karega.
BOS KI CONSISTENT DEFINITION
SMC ke common framework mein BOS meaningful swing break ko Trend Direction mein describe karta hai. Example H1 Uptrend mein previous Higher High ke upar complete candle close ko Bullish BOS kaha ja sakta hai. Lekin mentors ka swing selection aur Wick-vs-Close criteria different ho sakta hai. Pehle apne written rules define karein. Sirf 'BOS' label profit ki guarantee ya live Buy/Sell signal nahi.
CHoCH EARLY WARNING KAB?
Agar Uptrend ka important Higher Low break ho jaye to kuch traders usay Bearish CHoCH ya Market Structure Shift kehte hain. Ye current bullish sequence weak hone ka early warning ho sakta hai, guaranteed full reversal nahi. Price sideway bhi ja sakti hai ya level reclaim kar ke upar bhi continue kar sakti hai. H1 CHoCH automatically H4 trend change nahi karti. Additional Lower High, retest ya follow-through confirmation consider karein.
INTERNAL AUR EXTERNAL STRUCTURE
External Structure broader Trend ko define karne wale meaningful Swings hain. Internal Structure large price leg ke andar chhoti waves hoti hain. H1 bullish market mein M5 par bearish CHoCH normal correction ka part ho sakti hai. H1 main Higher Low ka breakdown comparatively zyada important ho sakta hai. Dono events useful observations hain lekin same directional conclusion nahi dete.
BUY EXAMPLE STEP BY STEP
H4 par Higher High/Higher Low bullish hai. H1 price pullback kar ke previously marked Demand Zone mein aati hai. M15 par Downward Momentum slow hoti hai. M5 bullish CHoCH banati hai aur completed Engulfing Candle local Resistance ke upar close karti hai. Ye possible Buy continuation setup ho sakta hai. SL meaningful rejection low ke beyond aur TP previous H1 High ke aas paas plan karein. Agar H1 Demand strongly fail ho to bullish scenario invalid.
SELL EXAMPLE STEP BY STEP
GBP/USD H1 Downtrend mein Lower High/Lower Low bana rahi hai. Price new Low break karne ke baad H1 Supply par retrace kare. M5 Lower High de aur bearish candle local Support ke neeche close kare, to trend-following Sell scenario evaluate ho sakta hai. Lekin H4 par sudden bullish BOS ya unexpected economic news context ko change kar sakti hai. Stop Loss structural invalidation ke beyond define karein.
WICK SWEEP VS STRUCTURE BREAK
Agar price Previous High ke upar Wick bana kar wapas range mein close kare, to close-based structure model mein ye full BOS count nahi hota. Kuch aggressive strategies Wick Cross accept karti hain. Koi universal one-size-fits-all rule nahi. Agar live strategy mein Full Candle Close required hai to historical backtesting mein bhi same rule follow karein. Losing trades ko exclude karne ke liye criteria change karna misleading hai.
STRUCTURE AUR DEMAND ZONES
Market Structure direction ka context deti hai jabke Supply/Demand potential reaction location. Bullish H4 sequence ke saath H1 Demand aligned ho to trend-continuation scenario possible hota hai. Same Demand agar H4 strong Downtrend mein ho to Countertrend setup hai. Order Block ya FVG extra zones show kar sakte hain lekin H4 Swing Direction ko ignore nahi karna chahiye.
MARKET STRUCTURE JOURNAL
Trade se pehle latest confirmed H4 High/Low aur H1 High/Low mark karein. M5 BOS/CHoCH complete hui thi ya sirf Wick thi? Setup H4 trend ke saath thi? Kya kis Swing ke beyond invalidation rakhi? Result ke baad check karein ke M5 internal low ko galti se H1 external low samjha tha ya nahi. Consistent screenshots se learning improve hogi.
FAQ
H1 aur H4 different direction? Haan. Ek Lower Low se every uptrend end? Swing importance par depend. Wick BOS? Model criteria par. BOS bina level/risk trade? Nahi. CHoCH guaranteed reversal? Nahi.
CONCLUSION
Market Structure ka use direction, zone context aur invalidation identify karne ke liye karein.
PIPSEPAISA FREE COURSES
Sir Sajid Khan Ghori ka Free Forex Technical Analysis Course: WhatsApp par message karein ya www.pipsepaisa.com ke Courses tab se enroll karein.
Sir Ghulam Abbas ke Free Forex Fundamental Analysis Course ke liye bhi WhatsApp ya Courses tab use karein.
DISCLAIMER
Examples education ke liye hain, live signals nahi. Trading mein capital lose ho sakta hai.
Educational content only. Trading involves risk. Always use independent analysis and appropriate risk management.