
Market Profile (TPO) Explained: Value Area, POC, Initial Balance and Forex Auction Theory
PipSePaisa • Forex Education & Research
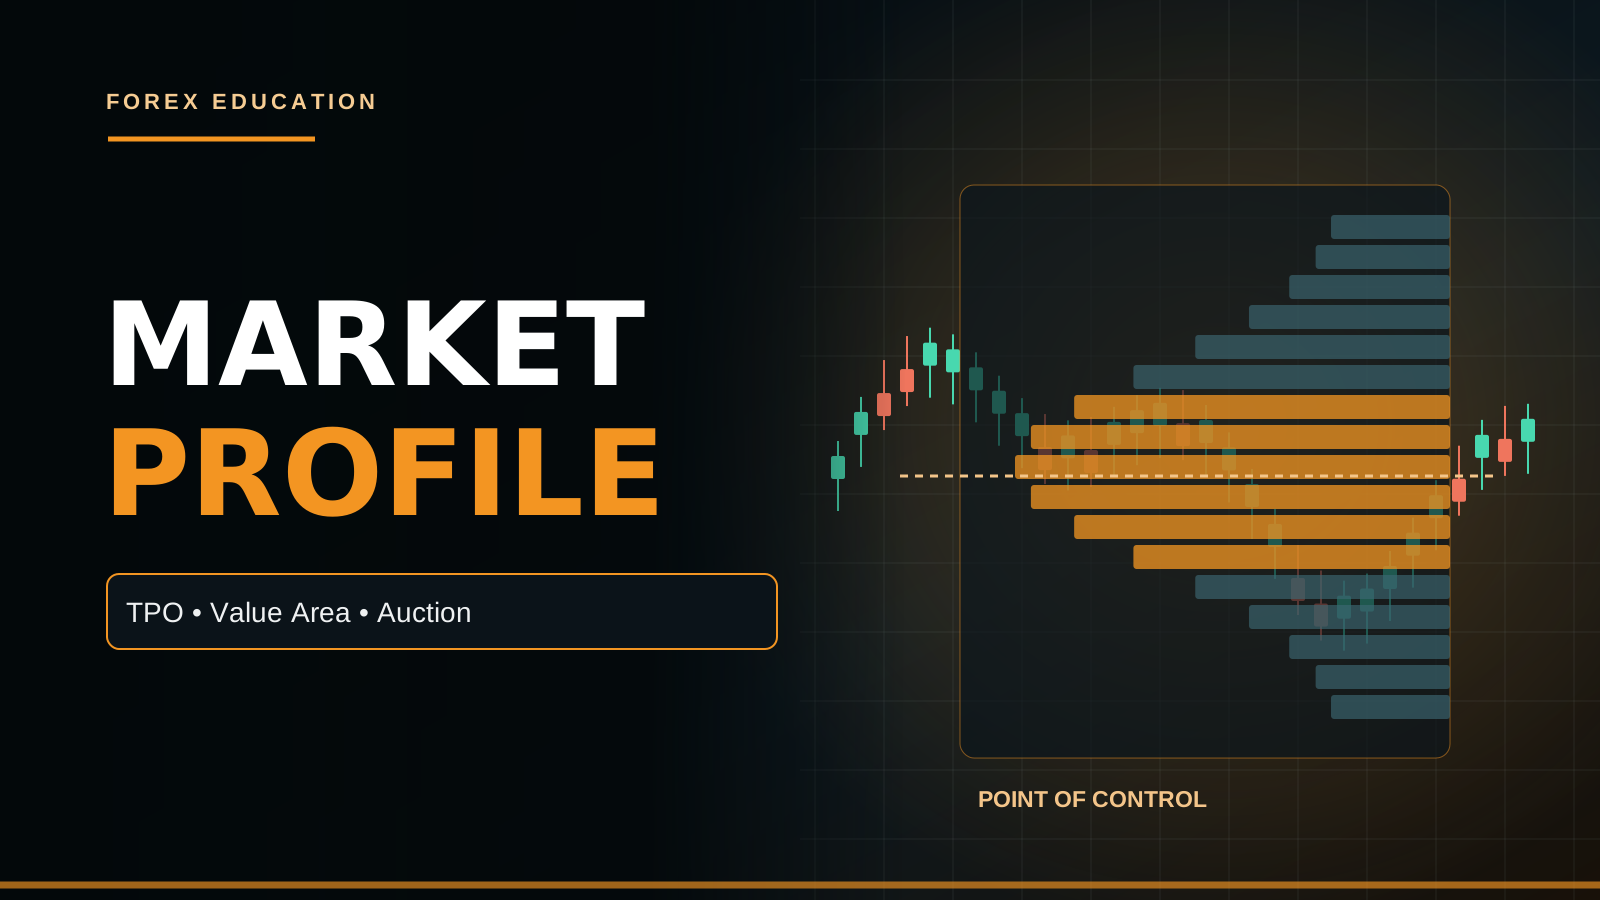
WHAT IS MARKET PROFILE AND TPO?
Market Profile is a framework for organizing traded prices by time and observing how an auction develops. A Time Price Opportunity, or TPO, generally represents a price visited within a selected time bracket, often displayed using letters. Repeated visits create a horizontal distribution that shows where the market spent time rather than merely which direction the latest candle moved. Market Profile is not a promise that the most visited price will act as permanent support. It is a descriptive charting tool whose interpretation depends on the session definition and contract.
AUCTION MARKET THEORY
Auction-market thinking views trading as a continuing process in which buyers and sellers explore prices to find levels where transactions and perceived value can occur. Price can rotate within a balanced range or move directionally as participants reprice their views. The profile can help distinguish balance from initiative movement, but the underlying causes may involve economic data, positioning and venue-specific liquidity. An auction narrative should be tied to visible behavior rather than claiming a particular bank deliberately created each TPO shape.
HOW THE TPO LETTERS WORK
Suppose a platform divides the session into thirty-minute brackets. Prices traded during the first bracket may receive the letter A, the second B and so on. Each letter at a price indicates time visitation under the configured price increment, not necessarily one order or one thousand contracts. Letter conventions, tick grouping and session templates differ among platforms. A trader should document the bracket length, price increment and timezone before comparing profiles. Otherwise two charts of the same instrument may display different distributions.
TPO PROFILE VERSUS VOLUME PROFILE
TPO Profile measures how much defined time-bracket participation appears at each grouped price level, while Volume Profile measures executed trading volume distributed by price. The shapes can sometimes look similar, but they answer different questions. A price frequently visited for short periods may have a high TPO count without the highest traded volume. A rapid high-volume event could produce substantial volume with relatively few time brackets. Never describe TPO letters as verified traded contracts or interpret a volume-based POC as the same calculation.
POINT OF CONTROL (POC)
The TPO Point of Control is generally the price row containing the largest number of TPO observations for the selected profile, subject to platform tie-breaking rules. A volume-profile POC instead uses the most recorded volume. Both can serve as historical reference levels. Neither guarantees a return visit or reversal; price can trend away after a major repricing. When teaching POC, identify whether the chart is TPO-based or volume-based and state which session or composite period produced the level.
VALUE AREA HIGH AND LOW
Value Area is typically a band surrounding a selected share of TPO activity or traded volume, depending on the profile type. Many charting tools use approximately seventy percent by convention, but the threshold and algorithm can be configurable. Value Area High (VAH) marks its upper boundary and Value Area Low (VAL) the lower boundary. These are calculated reference points, not literal price guarantees. If two software packages use different value-area methods, their VAH and VAL can differ without either chart necessarily being defective.
BALANCED AND IMBALANCED PROFILES
A roughly symmetrical, well-populated distribution is sometimes interpreted as evidence of balance, while an elongated or thin distribution can suggest more directional exploration. However, simplistic shape labels are not trading signals. A session can have a bell-shaped profile and still break out on the next report. A tall elongated profile can also be followed by range reversion. Evaluate actual price acceptance, repeated tests and external H4 structure rather than relying only on the graphic resembling a familiar letter.
INITIAL BALANCE (IB)
Initial Balance is commonly defined using the first portion of a trading session, often the first hour in traditional futures Market Profile practice, although other settings exist. Its high and low show the early price range. Later extension beyond the IB can reveal directional exploration, but it is not inherently bullish or bearish forever. Sessions, daylight-saving changes and trading-hours templates determine which candles constitute the Initial Balance. A Forex trader using a broker's server midnight rather than the intended exchange opening may calculate the wrong IB.
RANGE EXTENSIONS
An Initial Balance extension occurs when price trades beyond the IB high or low during a later part of the session. A sustained move with meaningful closes outside the range can be read differently from one quick wick that immediately returns. The amount of extension and price response may depend on news and liquidity. If your rule requires a confirmed retest outside IB, do not treat the first tick as a complete breakout. A powerful extension can still reverse as participants reassess information.
SINGLE PRINTS
In TPO terminology, single prints describe profile price rows visited during only one time bracket within the defined distribution, according to the platform grouping rules. They may occur during fast directional moves and can later be revisited or left behind. Some analysts call them low-acceptance areas. But a single print is not necessarily an actual exchange price gap, nor a guarantee that price must return to fill it. Evaluate the broader auction and trade timeframe before using one as an entry location.
HIGH-VOLUME AND LOW-VOLUME NODES
Volume Profile can display High-Volume Nodes and Low-Volume Nodes, reflecting relative recorded trading concentration. TPO has analogous ideas based on time visitation, though labels should not be mixed carelessly. Areas with heavy historical activity may attract renewed observation, while thin areas may be crossed quickly or pause unexpectedly. The relationship is not deterministic. A low-volume area is not an empty market or proof of absent future liquidity. Data aggregation and profile period influence each node.
VALUE-AREA ROTATION
Some traders use a balanced auction framework in which price rotates between Value Area boundaries or toward POC. If the market remains range-bound and repeatedly rejects boundary extensions, such a rotation hypothesis may be reasonable to investigate. But a fundamental repricing can cause price to establish new value outside the previous band instead. A trade from VAL toward POC needs a completed bullish reaction, a structural Stop Loss and sufficient target room. Blindly buying every touch of VAL is not a tested confirmation strategy.
ACCEPTANCE OUTSIDE VALUE
If price repeatedly trades and closes outside the previous value area, some auction traders interpret that as developing acceptance at different prices. A single short-lived wick is much weaker evidence. Look for sustained participation and a meaningful new balance, while noting that the session profile is still developing. A fresh day's POC may move as more brackets are recorded. An apparent shift at 10 a.m. may look different by the close. Do not use final profile statistics to justify earlier entries in a backtest.
DEVELOPING POC AND LOOK-AHEAD BIAS
A developing POC is recalculated as a session progresses. It can move from one price row to another as more TPO brackets or traded volume accumulate. A backtest that uses the final POC at the start of a historical session is invalid, because that information did not yet exist. Replay the session chronologically and save what the profile actually showed at the decision time. This subtle error can make a profile-based indicator appear to pick exact reversals with impossible accuracy.
COMPOSITE PROFILES
A composite Market Profile combines multiple days or a deliberately chosen range of sessions into one distribution. It may help identify larger areas of historical acceptance and rejection. However, selecting the exact start and end date after observing a successful bounce can introduce selection bias. Document whether the composite covers the prior week, current month or another fixed interval, and avoid silently changing boundaries. Composite profiles may be more useful for H4 context than for ultra-short M1 scalping, depending on the model.
FOREX SPOT AND CFD DATA LIMITS
The Spot Forex market is decentralized, with trading spread across many venues and liquidity providers. A retail TPO chart built from broker price quotes can still describe time spent at observed prices, but its session conventions may differ from exchange futures profiles. A volume-based Forex profile relying on broker tick counts should be identified as a proxy. TPO does not require centralized global executed volume in the same way as exchange volume profiles, yet data quality and market hours remain important.
GOLD FUTURES VERSUS XAUUSD
Exchange-traded Gold futures have contract-specific sessions and reported trading activity. A retail XAUUSD CFD may track related prices but use different contract values, quote increments and server hours. For a Gold Market Profile strategy, decide whether the analytical chart is exchange futures or the same broker CFD being traded. If futures levels are mapped to a CFD, verify the price basis and timing. An attractive Profile Level on Gold futures cannot automatically become a precise CFD Stop Loss.
A GOLD VALUE-AREA EXAMPLE
Suppose XAUUSD has a completed prior-session TPO value area with VAH at an illustrative 2420, POC at 2412 and VAL at 2405. On a later session price tests the old VAL and forms an H1 rejection plus completed M5 bullish CHoCH. A trader might consider a conditional rotation toward POC, but the price could instead accept below VAL and continue falling. The Stop should reflect the actual swing invalidation, and Gold lot risk must use broker contract specifications. These numbers are hypothetical, not current prices.
A EUR/USD BREAKOUT EXAMPLE
Imagine EUR/USD is balancing inside a weekly composite profile. London activity pushes above prior-session VAH and holds through several completed M15 candles. A retest then creates a meaningful higher low and completed M5 bullish engulfing. This could be considered a breakout-and-acceptance candidate if H4 structure and the next H1 resistance allow sufficient reward. If price returns into the old value area, the hypothesis weakens. Do not describe a one-tick excursion as confirmed value migration.
INITIAL BALANCE AND NEWS RISK
An important CPI, NFP or FOMC event can cause large moves through the Initial Balance and Value Area in minutes. Spreads may widen and Stop Loss orders can slip. Profile levels are historical references; they are not protection against fundamental repricing. A conservative method might avoid the release window, wait for a post-news H1 range to develop and then monitor M5 confirmation. A trader should not increase volume because price appears to have 'escaped value' during a highly uncertain event.
RISK MANAGEMENT WITH POC
A POC is a reference point, not an objectively safe Stop Level. Stops generally belong beyond a meaningful structural high/low or defined invalidation area, while position size follows planned monetary risk and distance. If the Stop is thirty pips away and the nearest opposing profile level offers only ten pips, the setup may have poor reward-to-risk. Neither a strong profile level nor a premium indicator justifies oversizing. Use net costs, spread and fill considerations in the expected payoff.
BACKTESTING A TPO STRATEGY
Define the instrument, TPO price increment, bracket length, session opening, value-area percentage, POC algorithm and the precise signal. Replay historical sessions as they developed; do not leak final profile information into earlier bars. Compare a TPO-based entry model with a simpler H1 Support/Demand and M5 engulfing strategy. Include every signal and failed rejection, realistic fills and news exceptions. Track net R, win rate, drawdown and sample size over different market regimes before claiming the profile adds value.
MARKET PROFILE FAQ
Is TPO the same as executed volume? No. Does POC guarantee price will return? No. Are VAH and VAL fixed forever? No, they depend on the selected profile and settings. Does a single print always get filled? No. Is the Initial Balance always the first hour for every platform? No, conventions vary. Can a developing POC shift while a session is still open? Yes. Does a Value Area breakout guarantee trend continuation? No. Use profile references together with actual market structure, completed confirmation and responsible risk.
PIPSEPAISA FREE COURSES
Join Sir Sajid Khan Ghori's Free Forex Technical Analysis Course to study market structure, chart confirmations and practical setups. Explore the Free Forex Fundamental Analysis Course by Sir Ghulam Abbas to understand CPI, NFP, rates and Gold drivers. Enrollment information is at www.pipsepaisa.com in Courses. Educational content only; leveraged markets can cause significant losses.
Read in Roman Urdu
MARKET PROFILE TPO KYA HAI?
Market Profile ek Auction Analysis Framework hai jo Price ko Time ke relation mein organize karta hai. TPO ka matlab Time Price Opportunity hai; selected Time Bracket mein Price Area visit ho to us level par ek Letter/Marker add ho sakta hai. Multiple Visits ek Horizontal Profile banati hain jo show karti hai Market kis Price ke aas paas zyada time rahi. Ye exact institutional Pending Orders ka map nahi. TPO POC future guaranteed Support/Resistance nahi. Session Definition aur chosen Market important hain.
AUCTION MARKET THEORY
Auction Market Theory Market ko continuous Price Discovery Process ke taur par dekhti hai. Buyers/Sellers different Prices test karte hain aur Market kabhi Balance Range mein rotate karti hai, kabhi Strong Directional Move. Profile ka Shape Market ke visited Price Levels show karta hai. Is se H1 Range vs Trend ko Context mil sakta hai. Lekin Chart se specific Bank ki hidden strategy conclusively identify nahi ho sakti. Fundamental News, Risk Sentiment aur Liquidity Conditions bhi Price ko change kar sakti hain.
TPO LETTERS KAISE BANTI HAIN?
Suppose Platform Session ko 30-minute Brackets mein divide karta hai. First Bracket ke visited Prices par A, second par B aur next par C markers show ho sakte hain. Har Letter ek Order ya exact Volume Amount nahi. Ye Price-Time Visitation Marker hai. Platform Tick Grouping, Session Hours aur Letter Assignment differ kar sakti hai. Comparison se pehle Bracket Duration, Tick Size, Exchange Session aur Timezone fix karein. Same Forex Instrument par two Different Settings Profile Shape change kar sakti hain.
TPO VS VOLUME PROFILE
TPO Profile Time Bracket Visits measure karti hai. Volume Profile price-wise executed Volume ka distribution show karti hai, assuming valid data. Dono Shapes similar nazar aa sakti hain lekin calculation different. Ek Price par market long time spend kare aur Volume relatively lower ho to TPO high, Volume Profile POC elsewhere possible. News ka Huge Volume few Minutes mein aa sakta hai. TPO Letters ko exact Contracts count na samjhein. Volume Feed genuine hai ya Broker Tick Proxy, verify karein.
POINT OF CONTROL POC
TPO POC usually selected Session ka woh Price Row hota hai jahan maximum TPO Counts hon, platform tie-breaking rules ke mutabiq. Volume POC maximum traded Volume Row hota hai. Dono historically important Reference Prices ho sakte hain magar automatic Buy/Sell Level nahi. Price News Surprise par POC ko revisit kiye baghair strong move kar sakti hai. H4/H1 Market Structure aur current Demand/Supply context important. Session POC vs Weekly Composite POC identify karein.
VALUE AREA HIGH LOW
Value Area selected Profile Distribution ka central active Band show karti hai. Common Tools around 70% Time Price Visits ya Volume threshold use kar sakti hain, lekin setting configurable hoti hai. Upper Boundary VAH Value Area High, lower Boundary VAL Value Area Low. In Lines se Chart Context mil sakta hai, magar Price har VAH par reverse aur har VAL par buy nahi hoti. Different Value-Area Algorithms se exact levels differ kar sakte hain. Tool Settings note karein.
BALANCED VS TREND PROFILE
Symmetrical Profile ko some Analysts Balanced Auction ke perspective se interpret karte hain. Thin Elongated Distribution directional Exploration suggest kar sakti hai. Lekin Rounded Shape next day guaranteed sideways aur Elongated Profile next day trend guarantee nahi. CPI/NFP Report Market Value instantly reprice kar sakti hai. H4 Bias, H1 Support/Demand, previous high/low aur VAH/VAL actual Price Reaction analyze karein. Fancy Letter-Shape without Confirmation reliable order signal nahi.
INITIAL BALANCE IB
Initial Balance usually trading Session ke first defined period ka High-Low hai. Traditional Futures TPO Practice mein first Hour common hai, lekin platform Method mein different settings possible. IB High Break continuation ya Failed Break Sweep dono ho sakta hai. Wrong Timezone par IB calculate karne se Rules invalid. CME Futures RTH aur 24h FX Broker Server Session difference samjhein. H1/H4 larger trend aur actual M5 Close essential rehti hai.
IB RANGE EXTENSION
IB High ya Low se later Price beyond move kare to Range Extension discuss hoti hai. Lekin Upper Wick ka momentary Break aur M15/H1 completed Close outside IB different. Genuine Trend Extension, Liquidity Sweep ya Sideways Return possible. Some Traders IB Break + Retest Strategy test karti hain. Agar written Rule complete Candle Close require karti hai to early Price Touch Buy/Sell nahi. Next H1 opposing Zone tak Target Room calculate karein.
SINGLE PRINTS KYA HAIN?
TPO Single Prints woh Price Rows ho sakti hain jahan selected Profile mein sirf one Time-Bracket Marker aaya. Strong Directional Move mein market low Time Acceptance display kar sakti hai. Lekin Single Print exact exchange gap nahi aur future 'must fill' level guaranteed nahi. Kabhi revisit hota hai, kabhi Strong Trend continue karti hai. H4/H1 Context aur Latest Economic Catalyst samajhein. M5 completed Retest/CHoCH ke bina random order na lagayein.
HIGH LOW ACTIVITY NODES
Volume Profile HVN/LVN Volume Concentration measure karti hai. TPO ka relevant activity profile Time Visits se derived ho sakta hai. Thick Node historical acceptance ka clue, Thin Node rapid traversal ka hypothesis. Lekin LVN guaranteed fast breakout aur HVN guaranteed support nahi. Data Source aur Profile Period change hone se Nodes shift ho sakte hain. Broker Tick Volume ko Worldwide Exchange Volume claim na karein. Price ka actual retest aur M5 Response observe karein.
VAH VAL ROTATION
Balanced Auction mein Price VAL se POC ya VAH ke darmiyan rotate kar sakti hai, but only under relevant market conditions. H1 Range intact ho aur Boundary Rejection repeat ho to potential Rotation Model consider. Lekin major CPI/Fed Surprise New Value outside previous Area establish kar sakti hai. VAL Touch par automatic Buy nahi; M5 Bullish Engulfing/CHoCH complete hona, structural SL aur realistic POC/H1 Supply Target check zaroori. No Confirmation = No Trade.
VALUE AREA KE BAHAR ACCEPTANCE
Previous VAH ke above multiple completed Candles aur new active Profile build ho to New Price Acceptance ka possible clue. Sirf ek M1 Wick enough nahi. Developing Profile session ke end tak change ho sakti hai. 10 AM ka POC final close par shift bhi ho. Backtest mein future Complete Session Profile pehle se use karna Look-Ahead Bias. Decision Time par available VAH, VAL aur IB values identify karein. H1 Structure align kar ke trade consider karein.
DEVELOPING POC BIAS
Developing POC current Session ke new Letters/Volume ke saath shift hota rehta hai. Final Session POC ko first M5 Candle ke waqt available samajhna wrong. Historical Chart Future Data reveal kar sakti hai. Live Strategy enter karne ke moment par current Developing POC kya tha, record karein. Warna Backtest perfect reaction areas dikha sakti hai jo real-time trader nahi dekh sakta tha. Same applies final Value Area High/Low calculated after session end.
COMPOSITE TPO PROFILE
Composite Profile multiple Sessions/Days ko combine kar ke broader Price Acceptance show kar sakti hai. Weekly Composite POC aur Daily POC different hote hain. H4 Context mein multi-day auction relevant ho sakti hai, M1 scalp mein late signal. Composite Start/End dates pehle define karein. Winning Bounce ke baad intentionally Profile Start shift karna Bias hai. Previous Week Composite vs Current Developing Profile alag label karein. Chart cleanliness aur rule consistency maintain karein.
SPOT FOREX CFD LIMITATION
Retail MT5 EUR/USD Broker Quotes globally consolidated Volume nahi deti. TPO Price Visitation selected Broker Data se calculate ho sakti hai, magar Daily Session Time aur Price Feed Exchange Futures se different. Forex Volume Profile broker Tick Volume proxy ho sakti hai. TPO Time Count ko Global Institutions ke all executed contracts samajhna inaccurate. Futures TPO aur Spot CFD TPO exact same POC guarantee nahi. Instrument/Symbol Data Source clearly label karein.
GOLD FUTURES VS XAUUSD
COMEX Gold Futures aur Retail XAUUSD CFD related prices par trade ho sakti hain but same Contract nahi. Futures Exchange Session, Tick Value aur CFD Broker Spread/Contract Size differ. Gold TPO POC futures par show ho to CFD MT5 Entry exact same Decimal par blindly copy mat karein. Futures-Spot Price Basis aur Timezone verify karein. H1 Gold Supply/Demand, M5 Full Candle Confirmation aur equity-based Lot always important hain.
GOLD TPO NUMERICAL EXAMPLE
Hypothetical XAUUSD Previous Session VAH 2420, TPO POC 2412 aur VAL 2405. New Session Price VAL test kare aur H1 Rejection ke baad M5 Bullish CHoCH complete ho to Possible Rotation POC ki taraf hypothesis. Lekin Price 2405 ke below accept ho to Bearish continuation bhi. Structural SL actual Rejection Low ke below, TP POC ya relevant H1 Supply. Gold Lot Broker Contract Size se calculate karein. Ye Example Live Price Signal nahi.
EUR/USD BREAKOUT EXAMPLE
EUR/USD Weekly Composite Range ke andar Balance kar rahi hai. London Session par Price prior VAH break kare aur multiple M15 Candles above Close dein. Retest par M5 Bullish Engulfing aur Higher Low ho to possible Continuation Setup. H4 Trend aur Next H1 Supply Target Room check karein. Agar Price previous Value Area mein back Close kare to Breakout Acceptance Thesis weak ho sakti hai. One Wick ko permanent New Value announce na karein. Stop proper Swing below.
IB NEWS VOLATILITY
NFP, CPI ya Fed Press Conference par Gold/EURUSD Initial Balance aur VAH/VAL ko fast break kar sakti hain. Broker Spread Wide aur Stop Slippage possible. TPO Historical Levels major News Price Repricing ko stop nahi karti. Conservative Strategy News Window avoid kar ke post-news H1 Acceptance/Retest aur M5 Confirmation wait kar sakti hai. Big Candle ke peeche Low Liquidity mein Entry chase risk barha sakti hai. No Confirmation = No Trade.
POC STOP LOT RISK
POC khud safe Stop Price guarantee nahi. H1 Demand Buy par SL meaningful Swing Low beyond, Supply Sell par SL Swing High beyond. Agar EUR/USD Stop 30 Pips aur nearest VAH/Resistance target 10 Pips ho to RR poor. TPO Level attractive hone se Risk Budget double justified nahi. Correct Lot Pip Value aur Account Equity se. Spread, Commission aur Slippage realistic include. No Trade better than forced bad R:R.
TPO STRATEGY BACKTEST
Instrument, Price Row Tick Size, 30m/other Brackets, Session Start, Value-Area %, POC Formula aur M5 Confirmation exact define karein. Historical Session ko one Candle at a time replay karein. Final Developing POC future leak na ho. TPO + H1 Demand Strategy vs Plain Support/Resistance + M5 CHoCH Results compare karein. Spread, Commission, News Filter aur Failed Trades include karein. Net R, Drawdown aur Out-of-Sample data judge karein.
MARKET PROFILE FAQ
TPO same as executed Volume? Nahi. POC guaranteed revisit? Nahi. VAH/VAL forever fixed? Nahi, Profile Settings depend. Single Print must fill? Nahi. IB every Platform first Hour? Nahi. Developing POC Session ke andar shift? Haan. VAH Break always trend? Nahi. TPO auction understanding mein help karti hai, but Entry H4/H1 Structure, M5 Completed Engulfing/CHoCH aur Structural SL/Lot required under chosen Strategy. No Confirmation = No Trade.
PIPSEPAISA FREE COURSES
Sir Sajid Khan Ghori ka Free Forex Technical Analysis Course aur Sir Ghulam Abbas ka Free Forex Fundamental Analysis Course PipSePaisa ke www.pipsepaisa.com Courses section par explore karein. Ye sirf Educational Content hai, financial advice nahi. Forex, CFDs aur Gold mein Leverage se Loss ka risk hota hai.
Educational content only. Trading involves risk. Always use independent analysis and appropriate risk management.