
SMT Divergence in Forex and Gold: Correlated Highs, Lows and Confirmation Strategy
PipSePaisa • Forex Education & Research
WHAT IS SMT DIVERGENCE?
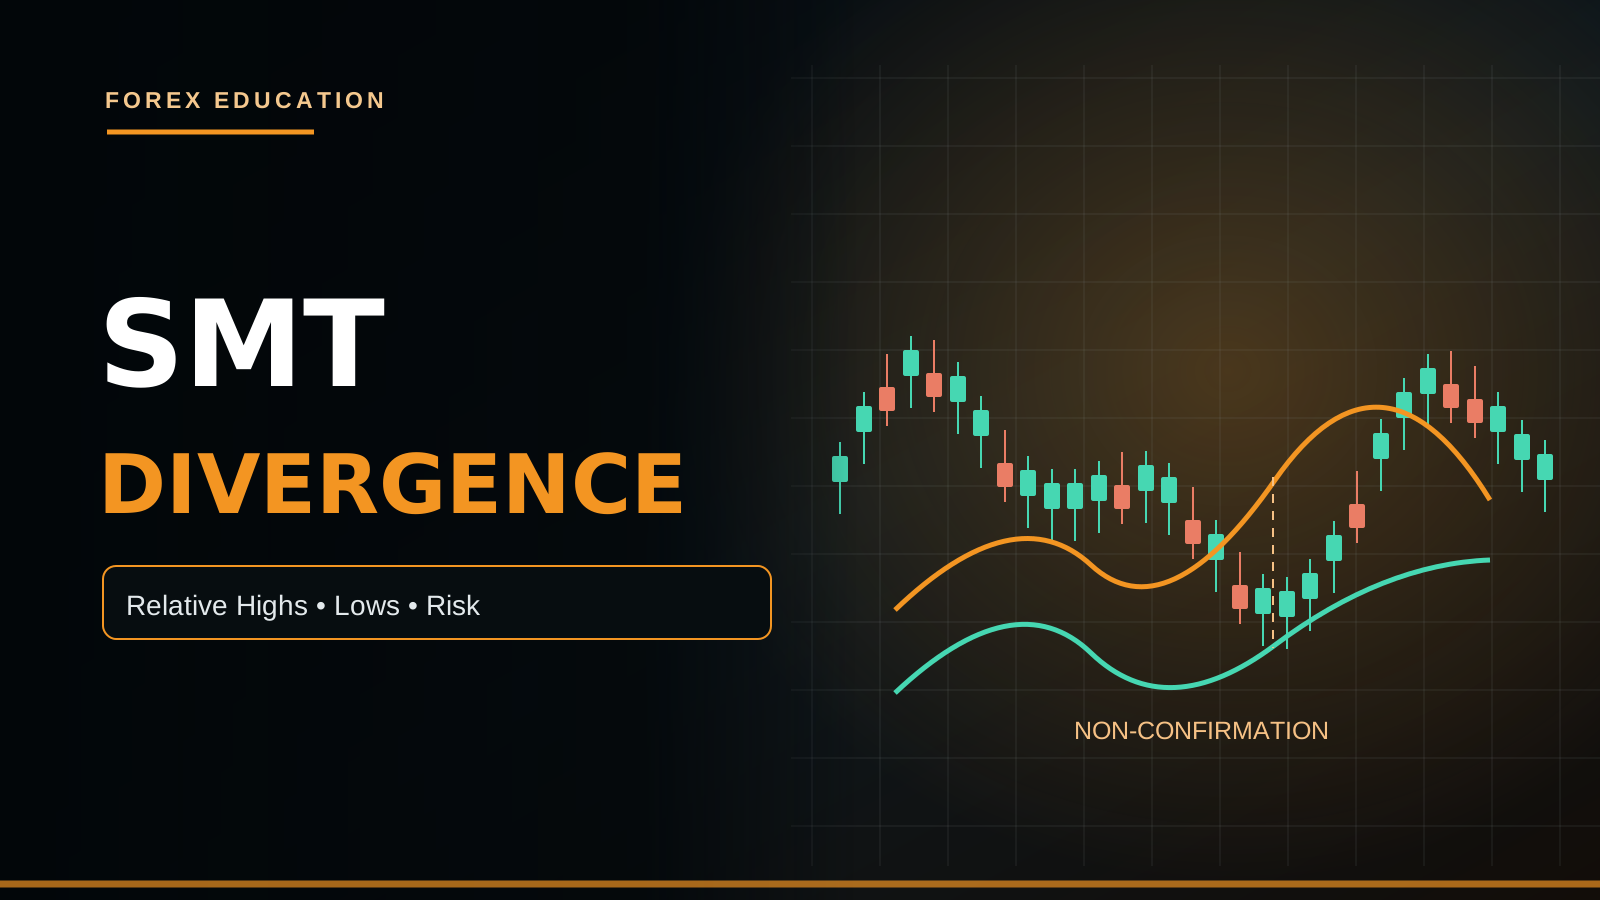
SMT Divergence, commonly discussed in Smart Money Concepts and Inner Circle Trader education, is a comparison of relative swing behavior between two markets expected to show some historical relationship. For example, one positively related currency pair might make a new high while another fails to exceed its comparable previous high. Traders study such non-confirmation as potential evidence of weakening synchronized momentum. This is an interpretive technical signal, not verified insight into every institution's intentions or a reliable forecast by itself.
THE MARKET RELATIONSHIP COMES FIRST
A valid SMT comparison requires a logical reason to compare the instruments. EUR/USD and GBP/USD often share sensitivity to broad USD moves, but the relationship varies with ECB and Bank of England developments. Gold and Silver can also co-move in some regimes, while differences in industrial demand and volatility are important. If two unrelated assets diverge, that observation is not automatically meaningful. Explain whether you expect positive or inverse behavior, what horizon is relevant and why.
BULLISH SMT WITH POSITIVELY RELATED MARKETS
A commonly discussed bullish SMT pattern occurs when one market trades beneath a prior corresponding swing low while a positively correlated peer holds above its own prior low. The first chart records a relative lower low and the second does not confirm. Some traders treat this as a possible warning that the downward move may not be uniformly supported. However, the instrument making the new low can continue lower, and the other may follow later. The divergence is a candidate observation, not confirmation of a Buy.
BEARISH SMT WITH POSITIVELY RELATED MARKETS
A possible bearish SMT configuration is one instrument moving above a prior corresponding high while a positively related peer fails to make a comparable higher high. Analysts sometimes interpret that disparity as a warning of selective strength or temporary exhaustion. But currency-specific economic information can explain why one pair outperforms another. The leader may simply be stronger and continue rising. A Sell requires additional evidence such as H1 Supply rejection, completed M5 bearish structural shift and acceptable risk-to-reward.
INVERSELY RELATED MARKETS NEED DIFFERENT LOGIC
Some traders compare a currency pair against DXY because of their commonly inverse price behavior. For example, EUR/USD making a higher high and DXY failing to make a correspondingly lower low might be called a form of non-confirmation under a chosen rule. However, the USD Index is a weighted basket heavily influenced by EUR itself, making the relationship partly mathematical and not independent evidence. Do not use the same high-versus-high definition for inverse pairs without correctly reversing the expected direction.
ALIGN THE SWING TIMES
Two charts may have different trading hours, holidays, price feeds and market response speeds. Comparing a EUR/USD M5 high made at 09:00 with a GBP/USD high made several sessions earlier can create artificial divergence. Set a consistent observation window and define what makes swings comparable. Some methods permit a small timing tolerance; it must be chosen before reviewing results. Daily candle boundaries can differ among brokers, so timestamp alignment matters. True comparison requires contemporaneous information.
DEFINE YOUR SWING POINTS CLEARLY
Swing definitions are not universal. One researcher might require a local pivot with two completed candles on each side; another may use an obvious H1 structure high. Fractal-based pivots sometimes require future bars to confirm a swing, which creates look-ahead risk if the backtest assumes the pivot was known earlier. State the exact confirmation delay and price definition. A real-time SMT model must use only information visible at the moment of decision. Otherwise excellent historical signals may vanish in live trading.
SMT IS NOT A STANDARD STATISTICAL TEST
Despite the acronym's popularity, trading-community SMT Divergence is a discretionary chart interpretation, not an official economic statistic or a single universally standardized hypothesis test. Different educators may select different instruments, timeframes and swing matching rules. Its apparent significance should be established empirically rather than accepted because a familiar trading term is used. A backtest must distinguish correlation coefficients from visually selected swing divergence. They answer different questions and can disagree.
FOREX CORRELATION CAN CHANGE
A pair that historically tracked another can decouple after changes in central-bank guidance, growth forecasts or political events. An unexpected BoE rate decision may move GBP/USD without a comparable EUR/USD response; an ECB speech may do the reverse. Those are legitimate fundamental differences, not necessarily a pending reversal opportunity. Rolling correlations can help describe the relationship, but they also depend on lookback and timeframe. SMT signals are less interpretable when the expected relationship is already weak.
GOLD AND SILVER SMT
Gold and Silver can sometimes move in broadly similar directions, but Silver has distinctive industrial-demand exposure and can be more volatile. A Gold higher high without a corresponding Silver higher high might be a potential divergence to investigate. Yet it may reflect legitimate shifts in relative precious-metal demand. Retail XAUUSD and XAGUSD broker prices should be compared using correct chart timestamps and completed candles. Futures and CFDs may differ. Never translate an SMT observation into a guaranteed Gold Sell.
EUR/USD VERSUS GBP/USD BULLISH SCENARIO
Imagine H4 structure for both EUR/USD and GBP/USD is broadly bullish. During London, EUR/USD briefly trades beneath its previous intraday low but GBP/USD remains above its matched low. EUR/USD then reclaims an H1 Demand zone and M5 prints a completed bullish structure change. Some traders may consider a Buy with Stop beyond the sweep low and target near H1 Supply. But upcoming ECB data could change EUR behavior. This is a hypothetical illustration, not a live signal.
EUR/USD VERSUS GBP/USD BEARISH SCENARIO
Suppose both pairs approach previous-day highs, but GBP/USD produces a higher high while EUR/USD fails to break its comparable high. GBP/USD simultaneously reaches H1 Supply and returns below the broken level. A trader might wait for an M5 lower high and bearish engulfing before evaluating Sell. If GBP/USD subsequently accepts prices above H1 Supply and EUR/USD catches up, the non-confirmation may disappear. A textbook-looking divergence is not permission to widen the Stop Loss after entry.
SMT WITH LIQUIDITY SWEEPS
Liquidity sweeps and SMT divergence are related in some ICT trading narratives but are not identical. A sweep refers to a price excursion beyond a recognizable high or low and its subsequent reaction. SMT is a relative comparison across markets. One instrument may sweep while a peer does not, creating both interpretations at once. But none of those labels guarantees that a specific bank triggered retail Stops. Price may continue rather than reject the level, so a completed structure shift is still important.
SMT WITH FAIR VALUE GAPS
Some traders wait for SMT non-confirmation at an H1 Supply/Demand area, followed by a meaningful displacement candle and a Fair Value Gap. The FVG may help identify a candidate retracement entry zone if the strategy explicitly uses it. However, stacking SMT, FVG and Order Block labels without objective definitions makes it difficult to test the rules. Each extra condition delays entry or reduces setup frequency. It must be tested for incremental value rather than assumed to produce an A++ winner.
SMT AND THE KILL ZONES
Traders might particularly watch relative highs and lows during selected London or New York Kill Zones. Such timing can concentrate attention on periods where liquidity and participation change, but the clock does not prove that the divergence is meaningful. A bullish SMT occurring before CPI may be invalidated by fresh economic data. Confirm the strategy's exact New York clock convention and daylight-saving adjustments. The relevant question is whether SMT adds value beyond H1 location, session and completed M5 confirmation.
H4 BIAS VERSUS M5 DIVERGENCE
A bearish SMT signal on M5 may simply reflect a short-lived pullback while both assets remain in bullish H4 trends. A conservative trend-following model might ignore countertrend signals unless H1 structure changes. Other strategies may trade brief reversals with different targets and stops. Do not equate a tiny M1 non-confirmation with a confirmed multi-day bearish market shift. The timeframe that defines the divergence should match the timeframe of its intended trade hypothesis and risk horizon.
A PRICE-BASED STOP LOSS IS STILL REQUIRED
SMT compares charts; it does not calculate a safe Stop Loss. For an EUR/USD Buy after sell-side sweep and bullish M5 confirmation, the logical invalidation may lie below the sweep low. The Stop could become wide if the confirmed candle closes far above Demand. Lot Size should decrease as stop distance increases when the same monetary risk is maintained. An SMT pattern with a poor target-to-risk ratio is not a trade opportunity merely because both charts display a visually appealing divergence.
A GOLD SLIPPAGE CONSIDERATION
When comparing Gold and Silver around US data, both instruments can move rapidly and spreads may widen. A confirmed divergence on a completed M5 bar may not translate into a favorable retail XAUUSD fill if the market already moved substantially. Gold's contract size and tick value differ from EUR/USD, while Silver has its own contract details. Broker CFD feeds can also have different timestamps. A correct SMT observation does not compensate for wide spread, a large stop or execution slippage.
BEWARE OF HINDSIGHT DRAWINGS
After price reverses sharply, it is easy to find one nearby chart whose previous high or low did not confirm. That is not the same as a repeatable rule. A proper SMT backtest selects the two markets beforehand, defines matching swing criteria, sets the time window and records every occurrence, including non-confirmations that led to continuation or no trade. Historical data should be replayed chronologically without access to later candles. A strategy may otherwise appear nearly flawless through selective examples.
CORRELATION FILTER AND OUT-OF-SAMPLE CHECK
A researcher can compare a baseline H1 zone plus M5 CHoCH strategy with an enhanced version that also requires SMT. Use the same pairs, spread assumptions, stops, targets and risk rules. Develop any thresholds on earlier data and evaluate them on unseen later periods. Track trade count, net R, worst drawdown and missed winners. The SMT filter might improve results, or it might simply remove valid entries. Only an honest out-of-sample comparison can support claims that it adds value.
NEWS AND DIFFERENT MONETARY POLICIES
An ECB rate surprise can temporarily decouple EUR/USD from GBP/USD, while a BoE surprise can do the reverse. Changes in US real yields may affect Gold differently from Silver. Correlated asset pairs do not share every fundamental driver. Before calling a divergence bearish or bullish, check the economic calendar and whether one instrument had an important independent catalyst. Price separation after legitimate news may persist for days instead of reverting within a Kill Zone. A model ignoring such differences can be misleading.
SMT TRADE JOURNAL
Record the two symbols, chart data sources, timestamps, expected correlation sign, comparison window, chosen swing highs/lows and exact time when divergence became observable. Also log H4 direction, H1 Demand/Supply, whether liquidity was swept, M5 completed confirmation, entry, Stop, target and net R after costs. Include cases where divergence never formed and cases where it appeared but no valid trigger followed. Without these fields, traders can overestimate how often the pattern would genuinely have produced a live entry.
SMT DIVERGENCE FAQ
Does SMT prove a bank intentionally manipulated one currency pair? No. Is a higher high in one chart and not another always bearish? No; their normal relationship matters. Can Gold and Silver diverge for legitimate fundamental reasons? Yes. Can a bullish SMT fail and trend continue downward? Yes. Does a Kill Zone guarantee the signal? No. Can the filter reduce profitable trades? Yes. The practical workflow is: Related Markets → Aligned Swings → H4/H1 Context → Completed M5 Confirmation → Structural Stop and Lot → Review. No Confirmation = No Trade.
PIPSEPAISA FREE COURSES
For market structure, Supply/Demand and practical M5 confirmation, explore the Free Forex Technical Analysis Course by Sir Sajid Khan Ghori. For central bank, inflation and currency-specific economic drivers, explore the Free Forex Fundamental Analysis Course by Sir Ghulam Abbas. Visit www.pipsepaisa.com Courses for current enrollment information. This content is educational, not personalized financial advice. Leveraged trading involves possible loss.
Read in Roman Urdu
SMT DIVERGENCE KYA HAI?
SMT Divergence Smart Money Concepts/ICT Education mein do historically related Markets ke Swing High/Low behavior ko compare karne ka concept hai. Example EUR/USD New Swing High banaye magar GBP/USD comparable High break na kare. Kuch Traders is Non-Confirmation ko potential weakening Relative Momentum ka clue samajhte hain. Lekin Ye Exact Hidden Bank Buying/Selling ka proof nahi. SMT Akeli guaranteed reversal Entry nahi. H4 Context, H1 Zones aur completed M5 CHoCH zaroori hain.
MARKET PAIR SELECT
SMT compare karne se pehle reason define karein ke two instruments historically related kyun hain. EUR/USD aur GBP/USD broad USD Weakness/Strength driver share kar sakti hain. Gold aur Silver kabhi move together magar Silver Industrial Demand aur Volatility different. Totally unrelated Charts opposite move karein to SMT signal automatically meaningful nahi. Positive ya Negative relationship expected hai? H1/H4 Window? Economic Events? In definitions ke baghair SMT labels hindsight overfitting hain.
BULLISH SMT EXAMPLE
Positive correlated EUR/USD aur GBP/USD dekhte hain. EUR/USD previous comparable Low ke neeche new Low banaye, GBP/USD apna previous Low hold kare. Ye possible Bullish SMT Non-Confirmation hai. Lekin EUR/USD further Downtrend continue aur GBP/USD baad mein Low break bhi kar sakti hai. Bullish SMT ka matlab immediately Market Buy nahi. H1 Demand, Sell-Side Sweep aur M5 Bullish CHoCH Full Close confirm ho to conditional Buy evaluate karein.
BEARISH SMT EXAMPLE
EUR/USD Previous High break kar ke Higher High banaye magar GBP/USD comparable Higher High form na kare. Some ICT Traders ise Bearish SMT discuss karte hain. Lekin ECB News Euro ko independently stronger kar sakti hai, so EUR/USD continuation bhi possible. H4/H1 Supply, Previous Day High rejection aur M5 Bearish Engulfing/CHoCH Full Close chahiye under defined Strategy. Only one New High vs no New High Sell certainty nahi.
DXY INVERSE SMT
EUR/USD vs DXY ko compare karte waqt inversely related behavior consider karein. EUR/USD Higher High de aur DXY expected Lower Low confirm na kare to some methods non-confirmation discuss kar sakti hain. Lekin DXY Basket mein EUR ka major weight hai, isliye DXY separate fully independent Confirmation nahi. Positive-correlated High-vs-High Rule ko DXY par directly copy mat karein. Other Basket Currency Drivers aur Exact Lookback Conditions verify karein.
SWING TIMING ALIGNMENT
EUR/USD aur GBP/USD comparable High/Low same relevant Time Window mein assess karein. Ek Pair ka M5 High 09:00 aur doosri Pair ka two-days-old High compare karna misleading ho sakta hai. Trading Hours, Broker Server Time aur DST difference bhi. Swing Window aur allowed Time Tolerance predefine karein. M15 Signal ko H4 non-confirmation kehna Timeframe mismatch. Historical Candles aligned hon taa ke future knowledge accidentally use na ho.
SWING DEFINITION FIX
Swing High/Low ka exact rule likhein: two neighboring Candles Pivot, H1 External Swing ya Other predefined Structure. Fractal Pivot confirm hone ke liye future two bars required hon to earlier M5 Entry par woh known nahi thi. Backtest Future Pivot ko entry time par available assume kare to Look-Ahead Bias. Bullish SMT Low A aur Low B actual moment par identifiable hone chahiye. Swing Rules result dekh kar adjust na karein.
SMT SCIENTIFIC GUARANTEE NAHI
Trading community SMT Divergence ek Technical Interpretation hai, koi government-certified economic statistic ya universally fixed statistical test nahi. Mentors different Currency Pairs, Pivots aur Timeframes select kar sakte hain. Two Charts compare karna useful Observation ho sakti hai magar Statistical Edge objective data se test karein. Correlation Coefficient aur Swing Non-Confirmation separate measures hain. Popular Terminology guaranteed Market Reversal probability establish nahi karti.
CORRELATION REGIME CHANGE
EUR/USD aur GBP/USD historical positive correlation recent ECB/BoE Surprises ke baad weak ho sakti hai. One Pair New High aur Other lower ho to reason Bank Policy Difference bhi. Har decoupling Gold/Japan institutional manipulation proof nahi. Rolling Correlation Past Relationship describe karti hai, future fixed nahi. Selected H4/M15 Data Window par relationship check karein. Agar instruments currently unrelated behave kar rahe hon to SMT label ka predictive meaning limited.
GOLD SILVER SMT
Gold XAUUSD aur Silver XAGUSD some regimes mein similarly move kar sakti hain, lekin Silver Industrial Demand aur Higher Volatility carry karti hai. Gold New High banaye aur Silver comparable High confirm na kare to Possible SMT Non-Confirmation. Lekin Industrial Metals News aur Dollar/Yields Effects different ho sakte hain. Gold Futures vs Silver CFD unrelated Data Conventions mix na karein. Same Broker, Time Window aur proper H4/H1 Context use karein. Bearish SMT guaranteed Gold crash nahi.
EUR GBP BULLISH SCENARIO
Hypothetical H4 EUR/USD aur GBP/USD dono broadly Bullish. London Session mein EUR/USD previous intraday Low sweep kar ke below move de, GBP/USD matched Low ke above remain. EUR/USD H1 Demand reclaim aur M5 Full Close Bullish CHoCH de. Conditional Buy candidate possible, SL Sweep Low ke beyond aur TP H1 Supply. Lekin ECB unexpected Data Euro independently drive kar sakti hai. SMT + Entry Price + Risk/Reward combined evaluate karein. Live Signal nahi.
EUR GBP BEARISH SCENARIO
Both EUR/USD aur GBP/USD Previous Day Highs ke qareeb. GBP/USD Higher High banaye magar EUR/USD apna matching High break na kare. GBP/USD H1 Supply touch kar ke broken high ke below return. M5 Lower High aur completed Bearish Engulfing ho to Sell candidate under tested model. Lekin GBP/USD later resistance above hold kare aur EUR/USD catch up, SMT disappear. SL planned Rejection High ke beyond maintain karein. Stop Widen nahi.
LIQUIDITY SWEEP PLUS SMT
SMT aur Liquidity Sweep same concept nahi. Sweep Price ek previous High/Low beyond jati hai; SMT do Markets ke comparable Swing behavior ka difference. EUR/USD Low Sweep kare aur GBP/USD Low hold to dono labels simultaneously possible. Lekin Exact Bank Stop Hunt prove nahi. Price further lower continue ho sakti hai. H1 Demand, M5 Bullish Engulfing aur meaningful Swing Reclaim ke baghair Buy force na karein. Liquidity Areas potential observations hain.
SMT WITH FVG
Kuch ICT Traders SMT Observation ke baad M5 Displacement Candle aur three-Candle FVG Retest ke liye wait karte hain. FVG possible Entry Area provide kar sakti hai, guaranteed Fill nahi. SMT + FVG + Order Block labels ka combo automatically A++ Profit Guarantee nahi. Har Condition exact chart rule mein define honi chahiye. Additional Filters Frequency reduce aur Entry Late kar sakti hain. Backtest mein With/Without FVG performance compare karein.
SMT KILL ZONE
London/NY ICT Kill Zones mein EUR/USD vs GBP/USD relative highs/lows observe karna popular ho sakta hai. Lekin selected Time Window SMT ke outcome ko guarantee nahi. CPI/NFP Headline Price pair-specific move change kar sakti hai. New York DST Clock Conversion correct rakhein. H1 Zone, Kill Zone aur M5 CHoCH ke sath SMT extra useful filter hai ya unnecessary complexity, Historical Data se judge karein. Timing Rule pehle fix karein.
H4 VS M5 SMT
H4 Strong Bullish Trend mein M5 Bearish SMT temporary Pullback ka signal bhi ho sakti hai, Major H4 Reversal necessarily nahi. Trend-Following Strategy M5 Countertrend Signal Skip kar sakti hai, jab tak H1 Lower Low confirm na ho. Countertrend Scalping alag Exit/Stop Rules demand karti hai. M1 Minor Non-Confirmation ko Daily Bearish Outlook declare mat karein. Divergence Timeframe aur Trade Holding Period aligned hon.
SMT STOP LOSS
SMT Chart Comparison exact MT5 Stop Price set nahi karti. EUR/USD Bullish SMT + H1 Demand Buy Setup mein SL meaningful Sweep Low ke beyond. M5 Big Confirmation Candle ke baad Stop Distance wide ho sakti hai. Equity-Based Dollar Risk constant ho to Lot Size reduce karein. Nearest H1 Supply only 10 Pips aur Stop 30 Pips to RR poor. SMT Label ke naam par forced 1:5 TP draw na karein. No Trade allowed.
GOLD SILVER SLIPPAGE
Gold aur Silver CPI/FOMC par fast move kar sakti hain. M5 completed SMT + CHoCH signal visually valid ho, lekin actual XAUUSD Fill late ya wide spread ke saath worse. Gold Contract Size, Silver Contract Size aur Currency Pair Pip Values different. Broker CFDs vs Exchange Futures Candle Timestamps align na hon to Divergence misleading. Actual Stop/TP, Lot aur News Avoid Window evaluate karein. Perfect Chart Pattern Execution Risk remove nahi.
HINDSIGHT SMT BIAS
Price Reverse hone ke baad 20 Charts mein se koi one Instrument find karna jo High confirm na kare, valid preplanned SMT Test nahi. Two Markets pehle select karein. Swing Rule, Time Window, H1 Structure aur required M5 Signal define karein. All Occurrences record including failed divergence, missing confirmation aur continuation. Future Candles hide kar ke replay. Winning screenshots only select karein to Strategy unrealistic reliable lagegi. Fair Sample analysis necessary.
SMT BACKTEST PLAN
Baseline H1 Supply/Demand + M5 CHoCH Strategy vs Same Model with SMT Filter compare karein. Pairs, Spread, Structural SL, TP aur Equity Risk constant. Previous Years In-Sample optimization, later Out-of-Sample validation. Net R, Win/Loss, Drawdown, Trade Frequency aur Missed Winners note karein. SMT Extra Rule some False Trades avoid, but valid Winners miss bhi ho sakte hain. Perfect Trade Selection guaranteed nahi. Real Data Decide kare.
ECONOMIC NEWS DIFFERENCES
ECB Rate Decision Euro ko independently move kare, GBP/USD same reaction compulsory nahi. BoE UK Wage News Pound ko affect kar sakti hai. Gold Real Yield aur Silver Industrial Demand different reactions create kar sakte hain. Isliye every Relative High/Low mismatch SMT Reversal Signal nahi. Economic Calendar, Actual vs Forecast aur Pair-specific Fundamentals observe karein. News-driven Decoupling days tak continue ho sakti hai. SMT ko historical relationship ke context mein interpret karein.
SMT JOURNAL FIELDS
Both Symbols, Broker/Data Source, Date/Timezone, Positive/Inverse Relation, Swing High/Low, Comparison Window aur exact Divergence Completion Time record karein. H4 Bias, H1 Zone, Sweep, M5 CHoCH/Engulfing, Entry, SL, TP, Actual Spread, Commission aur Net R add karein. No SMT aur SMT without confirmation Cases bhi. Same Rule Winners/Losers dono par. Objective Journal ke bina 'SMT always works' claim unreliable hai.
SMT FAQ FINAL
SMT Specific Bank Manipulation Proof? Nahi. One Higher High and other not always Bearish? Nahi, Correlation Rule matter. Gold Silver Legitimate Decoupling? Haan. Bullish SMT fail aur Downtrend continue? Haan. Kill Zone guarantee? Nahi. Extra SMT Filter Winners reduce? Possible. Correct Process Market Pair Relation → Same Time Swing → H4/H1 Zone → M5 Full CHoCH → Structural SL/Correct Lot → Target/Journal. No Confirmation = No Trade.
PIPSEPAISA FREE COURSES
Sir Sajid Khan Ghori ka Free Forex Technical Analysis Course aur Sir Ghulam Abbas ka Free Forex Fundamental Analysis Course www.pipsepaisa.com ke Courses section se explore karein. Ye sirf Educational Guide hai, Financial Advice nahi. Forex aur Leveraged Gold Trading mein Loss Risk hota hai.
Educational content only. Trading involves risk. Always use independent analysis and appropriate risk management.