
Heikin-Ashi Candles Explained: Smoothed Trend Charts, Formula, Signals and Forex Risk
PipSePaisa • Forex Education & Research
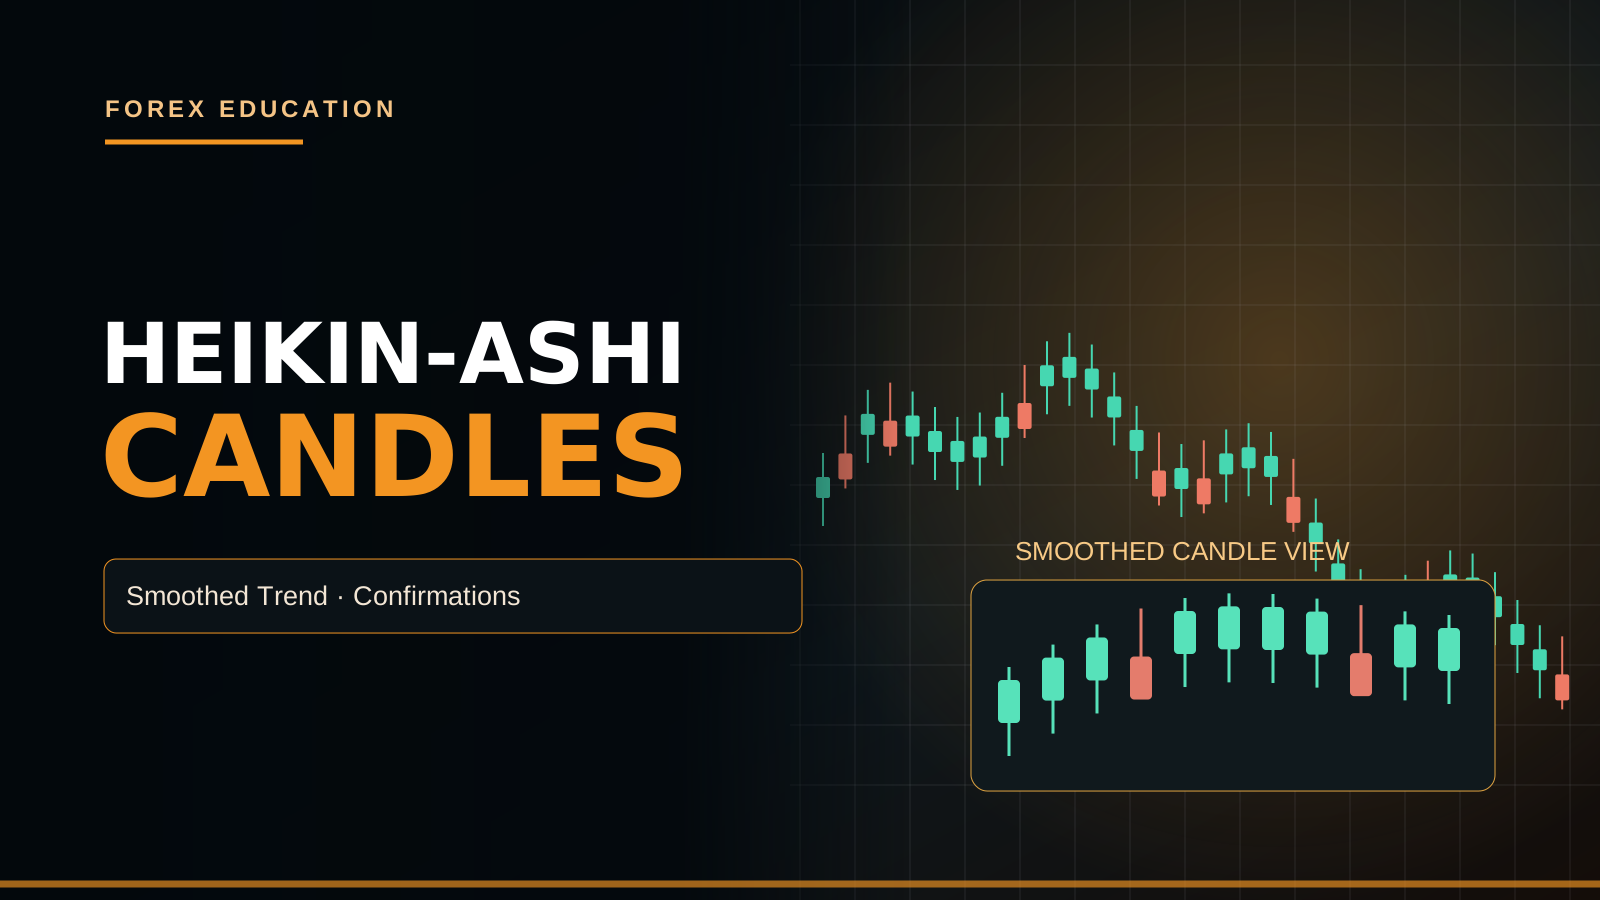
WHAT ARE HEIKIN-ASHI CANDLES?
Heikin-Ashi is a method of constructing smoothed candles from ordinary price data. Its name is often translated as an average-bar concept. Compared with conventional open-high-low-close candles, Heikin-Ashi charts can make sustained trends appear visually smoother by using previous Heikin-Ashi values in subsequent calculations. The resulting colored bars may help traders recognize directional persistence. But they do not display raw traded opens and closes in the same way as standard candles. That distinction is essential for accurate entry, Stop Loss and backtest interpretation.
ORDINARY CANDLES VERSUS HEIKIN-ASHI
A standard OHLC candle uses the actual opening, highest, lowest and closing prices observed during a given bar under the chart's feed. Heikin-Ashi instead calculates modified values using averages and prior synthetic values. A normal bullish candle can appear amid a Heikin-Ashi bearish run because the smoothing formulas preserve trend context. Conversely, the Heikin-Ashi candle can lag a sudden price reversal. Do not interpret its plotted Open or Close as the exact price where the market necessarily traded on the relevant exchange or CFD feed.
HEIKIN-ASHI CLOSE FORMULA
A common Heikin-Ashi Close is calculated as (ordinary Open + ordinary High + ordinary Low + ordinary Close)/4. This uses all four values from the original candle. For a hypothetical bar with ordinary O=100, H=110, L=98 and C=106, the Heikin-Ashi Close is 103.5. This average is not necessarily the actual closing transaction price of that bar, which was 106. A backtest using 103.5 as a guaranteed executable entry at the close would be misleading.
HEIKIN-ASHI OPEN FORMULA
The next Heikin-Ashi Open commonly equals (previous Heikin-Ashi Open + previous Heikin-Ashi Close)/2. This recursive calculation makes the candle body incorporate past smoothed values. Initial seed conventions can vary by platform or dataset starting point, so early bars may differ slightly. A trader should compare the same platform settings before declaring two Heikin-Ashi indicators inconsistent. Because the HA Open relies on earlier synthetic values, its plotted body represents an analytical construct rather than an ordinary spot opening quote.
HEIKIN-ASHI HIGH AND LOW
A common Heikin-Ashi High is the maximum of original High, current HA Open and current HA Close. The HA Low is the minimum of original Low, current HA Open and current HA Close. These formulas can produce visual structures different from traditional OHLC ranges, especially when the synthetic Open lies beyond the original bar range. Traders must check platform implementation. Stop placement should be based on actual executable market levels and a meaningful structural invalidation, not on an untested assumption that every synthetic wick reflects current traded liquidity.
WHY THE CHART LOOKS SMOOTHER
Heikin-Ashi reduces visual noise by averaging each candle and incorporating prior synthetic values. During a sustained bullish move, many consecutive green candles may appear with relatively small lower shadows under certain conditions. In a sustained decline, bearish candles may display small upper shadows. But consecutive same-color bars are not a guarantee that momentum will continue. Trend signals can arrive late after a sharp market shift. The advantage of cleaner visuals needs to be weighed against slower reversal recognition.
BULLISH HEIKIN-ASHI STRUCTURE
Some traders view an extended sequence of rising bullish Heikin-Ashi bars as evidence of a continuing price trend. A bar with a relatively small lower shadow may appear strong, but the inference is conditional and depends on timeframe. A bullish HA candle within an H4 downtrend might reflect only an H1 pullback. Rather than buying immediately on color, establish H4 structure, wait for H1 Demand and check an ordinary M5 price-action confirmation. The HA series is a supplementary trend filter, not a full entry system.
BEARISH HEIKIN-ASHI STRUCTURE
Repeated bearish Heikin-Ashi candles can indicate that prices are persistently moving lower under the smoothing methodology. Small upper shadows may be observed during some strong declines. But late entry into a bearish sequence near major H1 Demand can offer poor reward-to-risk. If the strategy looks for selling opportunities, a pullback toward H1 Supply with regular M5 bearish confirmation may be more coherent than chasing the last red synthetic bar. The trend color is context, not permission to ignore invalidation levels.
DOJI-LIKE TRANSITION CANDLES
A Heikin-Ashi candle with a small body and shadows on both sides may suggest a pause or transition in the smoothed series. That does not prove a reversal. Small bodies can occur during sideways movement or before renewed continuation. Conventional Doji definitions should not be transferred uncritically because HA Open and Close are averages rather than ordinary traded values. A trader should review actual H1 levels, normal candle structure and the next completed confirmation. One short candle cannot establish a major change of trend.
HEIKIN-ASHI AND SUPPORT RESISTANCE
Because Heikin-Ashi changes plotted body levels, support and resistance drawn from its candles may differ from those constructed from ordinary trade prices. For precise zones, many traders prefer marking H4/H1 structural highs, lows and Supply/Demand on a normal price chart. Heikin-Ashi can then serve as a secondary view of trend behavior. When switching chart modes, ensure drawn horizontal levels did not accidentally shift to synthetic prices. The correct entry, Stop and Take Profit need executable market-level context.
HEIKIN-ASHI TIMEFRAME ALIGNMENT
A bullish H4 Heikin-Ashi sequence can persist even while several M5 ordinary candles are bearish during a pullback. A model may use H4 Heikin-Ashi as a broad trend filter and regular H1 Supply/Demand plus M5 engulfing as the actual trigger. But that combination needs testing rather than assumption. Multi-timeframe chart feeds and completed-bar timing must align. A forming H4 Heikin-Ashi bar can change color before it closes, so avoid using its final historical value as if it were known early.
THE PROBLEM WITH SYNTHETIC BACKTEST FILLS
Backtests placed directly on nonstandard candle charts can accidentally fill orders using synthetic OHLC values rather than actual historical market prices, depending on software settings. A strategy might appear to Buy near a Heikin-Ashi Close lower than the price actually available. That creates unrealistic performance. For honest evaluation, indicators may calculate on Heikin-Ashi while executions are modeled from standard price data with spread and slippage. Read the platform's documentation for the chosen backtesting mode, especially when comparing TradingView scripts with MT5 robots.
TRADINGVIEW HEIKIN-ASHI CONSIDERATIONS
TradingView offers Heikin-Ashi chart views and scripts that can access synthetic HA data under its documented facilities. Traders should know whether their indicator is calculated from regular OHLC or the displayed nonstandard series. Alert conditions on the still-forming synthetic bar can fluctuate. Testing a closed-bar condition and then taking real fills at the next available tradable price is more defensible. Platform chart rendering is not an official global exchange order flow. Confirm which data source and symbol were used.
MT5 HEIKIN-ASHI INDICATORS
MetaTrader 5 can display Heikin-Ashi via compatible indicators, but an Expert Advisor must obtain the correct indicator buffers and handle historical readiness on timeframe changes. If the indicator is custom, buffer numbering and recalculation logic need testing. Any EA should use actual SymbolInfo tick quotes and contract details for orders, not synthetic candle OHLC as guaranteed fills. Confirm the account's hedging/netting mode and stop restrictions. A reliable HA trend filter is only one part of a complete execution and risk framework.
A GOLD TREND-FOLLOWING CASE
Suppose Gold H4 standard-price structure is bullish and the H4 Heikin-Ashi candles remain mostly green. Price pulls back into an H1 Demand Zone rather than extending into H4 Supply. A regular M5 chart then prints a completed bullish engulfing and a meaningful Higher Low. A trader may examine a Buy with structural Stop below the rejection low and target near H1 Supply. But if US CPI causes real yields to rise sharply, the Gold trend can reverse despite the smoothed green filter.
A EUR/USD SELL CASE
Imagine EUR/USD H4 is in a sustained downtrend, reinforced by a series of red Heikin-Ashi candles. During London trading, price retraces to a normal H1 Supply Zone and an M5 bearish CHoCH completes. A tested system might evaluate Sell with Stop beyond the swing high and target near previous H1 Demand. If EUR/USD is already at strong weekly Support, the remaining reward may be insufficient. A strong visual bearish sequence should never override basic target space and risk limits.
HOW TO SIZE A HEIKIN-ASHI TRADE
A Heikin-Ashi candle's height is not a universal money-risk measurement. Calculate the actual entry-to-structural-stop distance on a normal broker chart, then apply the correct pip or tick value and equity risk allowance. A Gold price move and an EUR/USD pip do not have the same contract value. Trading several USD-related positions can accumulate correlated exposure. Stop-market fills can be worse than planned during major economic releases. Smoothed candles do not protect a leveraged account from liquidation.
HEIKIN-ASHI VERSUS RENKO
Heikin-Ashi is time-bar based when constructed from timed OHLC data, while Renko charts generally build bricks using specified price-movement thresholds and may represent time differently. Both are nonstandard charting forms, but their calculations and backtesting problems differ. A Heikin-Ashi chart does not necessarily eliminate small reversals; it smooths their appearance. A Renko strategy cannot be copied directly into HA without rewriting rules. Backtest execution should use valid real-price assumptions for whichever method is chosen.
HEIKIN-ASHI JOURNAL AND BACKTEST
Record both the standard-price H4/H1 structure and Heikin-Ashi color or transition state available at entry time. Note whether an M5 ordinary-candle confirmation had actually closed. Compare results with and without the HA filter using the same real fill assumptions, spread, Stop and target. Include sessions where the smoothing caused a late signal or missed entry. A model with fewer losing trades may also miss more profitable trades, so evaluate net R and drawdown rather than selected screenshot accuracy.
HEIKIN-ASHI FAQ
Does a Heikin-Ashi Close always equal the real market Close? No. Are its colors smoother because values are averaged? Generally yes. Can a forming HA bar change appearance before closing? Yes. Can the trend filter lag reversals? Yes. Should Stop Loss be placed blindly on a synthetic body? No. Can Gold fall during a green HA sequence? Yes. Use Heikin-Ashi as an optional trend lens, mark H4/H1 levels on executable price data and wait for completed M5 confirmation.
PIPSEPAISA FREE COURSES
Learn professional chart reading and execution confirmation in Sir Sajid Khan Ghori's Free Forex Technical Analysis Course. For Gold market fundamentals, explore Sir Ghulam Abbas's Free Forex Fundamental Analysis Course. Enrollment updates at www.pipsepaisa.com under Courses. Educational content only. Leveraged Forex and Gold trading can lead to capital losses.
ANOTHER LIMITATION: PRICE GAPS AND MARKETS
A Heikin-Ashi Open is recursively smoothed, so it can obscure some visual gaps or ordinary opening jumps that are apparent on raw candlesticks. Actual market gaps still exist, and retail Stop Loss orders may execute at unfavorable prices. This is especially important when a trader holds leveraged Gold or Forex exposure across closed sessions or significant weekend news. Never use an apparently continuous HA candle sequence as evidence that the broker will deliver continuous prices. Regular OHLC and transaction history remain necessary for execution analysis.
CREATING A SIMPLE TWO-CHART WORKFLOW
Open a regular price chart for actual H4 Supply/Demand, H1 reaction zones and Stop calculation. Keep a Heikin-Ashi chart or indicator at the same symbol and a clearly recorded timeframe for trend observation. When price reaches a planned level, wait for the regular M5 candle to close in the required structure. Take a screenshot before entry and record whether the HA filter was green, red or uncertain. This separates the smoothed visual indicator from the market price where an order could really execute.
HIGH-IMPACT ECONOMIC DATA
CPI, NFP and Federal Reserve announcements can cause rapid repricing that precedes a clear Heikin-Ashi color change. A model designed for calm trend-following conditions may be unsuitable during the first several minutes of a major release. Check the economic calendar, maximum spread and position risk before an entry. If Gold has already moved significantly, the opportunity cost of waiting for confirmation must be compared with the danger of chasing a move. Sitting out a fast market is a valid risk decision.
Read in Roman Urdu
HEIKIN ASHI CANDLES KYA HAIN?
Heikin-Ashi ek Smoothed Candlestick Chart Method hai jo Regular OHLC Prices se calculated Values banata hai. Iske Colors/trends Normal Candlestick Chart se smoother nazar aa sakte hain, especially strong H1 Trend mein. Lekin Heikin Ashi Open/Close real Broker traded Open/Close ke same necessarily nahi. Beginners synthetic Candle Price ko MT5 actual Entry assume kar ke backtest galat kar sakte hain. Heikin-Ashi trend visualization tool hai, guaranteed next Candle prediction nahi.
NORMAL CANDLE VS HEIKIN ASHI
Normal Candlestick Open, High, Low, Close actual selected Chart Bar data show karti hai. Heikin Ashi modified price calculations se body banata hai. Normal M5 Candle Bullish ho aur Heikin-Ashi still Red appear possible. Market Reversal already start ho, HA Color later change kar sakta hai. Smoothing Trend clarity improve but delay also. Synthetic Candle High/Low ya Open ko exact executable Quote samajhna risky. Actual Broker Bid/Ask separately.
HEIKIN ASHI CLOSE FORMULA
Common Heikin Ashi Close Formula (Regular Open + High + Low + Close) / 4. Hypothetical Original O=100, H=110, L=98 aur C=106 ho to HA Close = (100+110+98+106)/4 = 103.5. Actual Normal Candle Close 106 tha, HA calculated Close 103.5. Ye 103.5 automatically trading exchange par bar closing available Price nahi. TradingView Backtest mein synthetic close execution possible issue create karti hai.
HEIKIN ASHI OPEN FORMULA
Heikin-Ashi Open commonly (Previous HA Open + Previous HA Close)/2. Is recursive Formula se previous trend information candle body mein include hoti hai. First HA Candle seed/platform calculation method change ho to starting bars thore differ. Regular Candle ke Opening Quote aur HA Open same hone compulsory nahi. Backtest/EA mein Formula selected platform according consistent implement karein. Chart Smoothing Accuracy aur Broker Execution Price alag.
HA HIGH LOW FORMULA
Heikin Ashi High commonly max(Regular High, Current HA Open, Current HA Close). HA Low min(Regular Low, HA Open, HA Close). Isliye Some HA Wicks Original Bar Range se different ho sakti hain depending synthetic value. Formula exact software implementation verify. Structural Stop MT5 actual Price Chart ke relevant Swing beyond set karein. Heikin Ashi plotted Wick ko fixed Order Flow Stop Cluster proof na samjhein. H1 Supply/Demand alag confirm karein.
SMOOTH TREND VIEW
Heikin-Ashi Previous HA Values aur Current OHLC Averages use karke Chart Noise visually reduce karta hai. Strong Bullish Trend mein consecutive Green bars aur small lower wicks appear possible. Bearish Trend mein repeated Red bars. Lekin same color streak next candle bhi same guaranteed nahi. Late Trend Change Detection drawback. Clean Visuals useful, but Entry Timing aur Stop Distance actual Chart se. Gold CPI sudden reversal HA smooth line se instantly detect na ho.
BULLISH HEIKIN ASHI SIGNAL
Consecutive Green HA Candles H1/H4 Bullish Momentum visualize kar sakti hain. Lower Wick small ya absent ho to some Traders Strong Trend interpret karte. Lekin H4 Strong Downtrend ke andar M5 HA Green sirf short Pullback bhi ho sakti hai. Buy ke liye H4 HH/HL, H1 Demand aur Regular M5 Bullish Engulfing Full Close required according strategy. HA Color alone A++ Buy guarantee nahi. No Confirmation = No Trade.
BEARISH HA SIGNAL
Repeated Red HA Bars Bearish Trend Continuity ka visual clue ho sakti hain. Small Upper Wicks sometimes downside momentum indicate. Lekin Price already H1 Demand ke qareeb ho to late Sell poor RR. H4 LH/LL Bias, H1 Supply Retest, Regular M5 Bearish Engulfing/CHoCH complete hona important. Synthetic Red Candle ko actual MT5 Sell fill price na samjhein. Structural SL actual Swing High ke beyond use.
HA DOJI TRANSITION
Heikin Ashi Small Body with Upper/Lower Wicks Trend Pause/Transition ka possible signal. Lekin guaranteed Reversal nahi. Normal Doji candle actual open-close proximity display, HA Small Body synthetic price averaging ka result. H1 Range/Consolidation aur H4 Trend check karein. M5 Completed CHoCH ke baghair opposite Trade open na karein. Trend pause se strong continuation bhi possible. Candle Type alone sufficient nahi.
SUPPORT RESISTANCE HA CHART
Heikin Ashi Synthetic Candle Bodies Standard H1 OHLC se differ. Agar Supply/Demand Zone only HA Candle Body se mark karein to real Chart Price Area change possible. Precise H4/H1 Buying/Selling Zones Regular Candlestick Chart par mark karna useful. HA Trend Direction side panel/secondary chart par observe karein. Actual MT5 Entry, Stop, TP Standard Price Levels se. Indicator Visual High/Low and real trade exposure confuse na karein.
H4 H1 M5 ALIGNMENT
H4 HA Green Trend still M5 Regular Red Pullback show kar sakti hai. Possible System H4 HA Color broad filter, H1 Normal Demand Zone, M5 Full Bullish Engulfing actual Entry. Lekin Backtest required. H4 HA Candle forming ho aur Chart Color intra-bar change, final close hindsight mein alag. Agar H4 Close Confirmation required ho to Candle complete hone se pehle Signal count na karein. Timeframes align.
SYNTHETIC BACKTEST ISSUE
TradingView Non-Standard HA Chart par Strategy Backtest agar Synthetic Open/Close par Orders fill assume kare to fake attractive Performance show ho sakti hai. Real Broker Trade actual Bid/Ask price par execute hota hai. HA Indicator Data entry filter ke liye, actual market OHLC fill ke liye use karna important depending platform options. MT5 EA conversion mein Standard Price Values aur HA Calculation separate. Spread/Commission/Slippage include. Perfect History live profitable guarantee nahi.
TRADINGVIEW HEIKIN ASHI
TradingView par Heikin Ashi Chart Type select kar sakte hain, lekin Indicator Regular OHLC vs HA synthetic values ka difference samjhein. Forming Candle Alert bar close se pehle false flip ho sakta hai. Agar Strategy Full M5 Close demand karti hai to alert after close and actual next tradable Price fill. Pine Script historical results synthetic chart settings se differ. Data Feed Symbol aur Session clearly label. Colors future signals certainty nahi.
MT5 HEIKIN ASHI EA
MT5 Heikin Ashi Custom Indicator Buffers se EA trend conditions read kar sakta hai if coded correctly. TF Change par Data Refresh aur Indicator Handle readiness verify. Buy/Sell actual SymbolInfo Bid/Ask Quotes se, HA synthetic Close par Broker Guaranteed Fill nahi. Gold Contract Size, Stop Level, Tick Value, SL/TP and Margin check. EA Recovery Mode active ho to trend filter risk eliminate nahi. Backtest Multi-TF rules with correct bar-close.
GOLD HA BUY EXAMPLE
XAUUSD H4 Regular HH/HL aur HA H4 mostly Green. Price H1 Demand Zone retest kare, M5 Normal Bullish Engulfing Full Close plus Higher Low. Conditional Buy setup, SL Rejection Low beyond, TP next H1 Supply. Lekin Hot CPI Real Yields higher kare to Gold trend against move possible. HA Green Trend guarantee nahi. Lot calculation Gold Broker Contract/Equity Risk ke mutabiq. No Confirmation = No Trade.
EUR/USD HA SELL EXAMPLE
EUR/USD H4 Lower High/Lower Low aur HA Red Bars. London Session mein H1 Supply Pullback, M5 Regular Bearish CHoCH Full Close. Conditional Sell, SL meaningful Swing High above, TP H1 Demand. Agar Weekly Support bilkul nearby ho to low RR, no entry. Heikin-Ashi strong bearish visuals ke bawajood other Currency News pair reverse kar sakti hai. Execution Price actual Broker Quote se.
HA TRADE LOT SIZE
HA Candle Height ko Direct $Loss calculator na samjhein. Real MT5 Entry-to-SL Distance, XAUUSD Contract Size ya EUR/USD Pip Value aur Equity Risk Percent use karein. Multiple Correlated Dollar Trades combined Risk calculate. Gold NFP/CPI ke waqt Stop Slippage possible. HA Smooth Color se extra 10x leverage justified nahi. Minimum Lot planned loss exceed kare to No Trade. Structural SL and TP important.
HA VS RENKO
Heikin Ashi timed OHLC Data se smoothed candle create, Renko Price Threshold/Brick Method use karti hai and Time representation different ho sakti hai. Dono Non-Standard Charts hain, same calculations nahi. HA Candle Trend Smoothing aur Renko Box Formation different Trading Rules. Renko EA signals ko HA par simply copy na karein. Historical Synthetic Bars price fills reality se mismatch possible. Chart Type identify before testing.
HA BACKTEST JOURNAL
Journal H4 Normal Market Structure, HA Green/Red Status, H1 Demand/Supply, M5 Regular Engulfing/CHoCH, actual Entry, SL, TP, Lot, Spread and Net R. Without HA Filter vs With HA Filter Data compare. HA signal late aaya aur Winner miss hua to also record. Synthetic Candle Backtest Fill unrealistic na ho. Losing/Wining trades both. Out-of-Sample check. Indicator sirf Visual Clear hone se reliable edge proof nahi.
HEIKIN ASHI FAQ
HA Close Real Market Close same? Nahi. HA Colors smoother? Generally Haan. Forming HA Candle Flip? Possible. Trend Reversal late signal? Haan. Synthetic Body par Blind Stop? Nahi. HA Green ke bawajood Gold down? Haan. Correct Plan HA Trend Context → H4/H1 Regular Supply/Demand → M5 Full Confirmation → Actual Quote Entry → Structural SL/Lot/TP. No Confirmation = No Trade.
PIPSEPAISA FREE COURSES
Sir Sajid Khan Ghori ka Free Forex Technical Analysis Course aur Sir Ghulam Abbas ka Free Forex Fundamental Analysis Course ke updated details www.pipsepaisa.com ke Courses section mein check karein. Ye Education hai, guaranteed financial return promise nahi. Trading Risk important.
MARKET GAP AUR HA CHART
Heikin Ashi Smoothed Open ki wajah se some Market Opening Gaps ya sudden jumps regular candles se different visually appear ho sakte hain. Lekin Actual Broker Market Gap still real hota hai aur Stop Loss worse price par fill possible. Weekend Gold/Forex Hold mein ye serious Risk hai. HA continuous chart dekh kar Price always smooth execute hogi, assume na karein. Actual Regular OHLC aur Broker Fill History check karein. Candlestick Chart Type Financial Loss Risk remove nahi karti.
TWO CHART PRACTICAL WORKFLOW
Regular TradingView/MT5 Chart par H4 Supply/Demand, H1 Reaction Zone, SL aur TP mark karein. Same Symbol Heikin Ashi View separately open kar ke overall Trend observe karein. H1 Zone reach ho to Normal M5 Bullish/Bearish Engulfing Full Close aur relevant CHoCH confirmation wait. Journal mein HA Color aur Timeframe entry time par note karein. Dono Charts ke Data Feeds/Timezone consistent hon. Synthetic HA Entry Price aur actual Ask/Bid different samjhein.
HIGH IMPACT NEWS RISK
CPI, NFP, Fed FOMC News par Price HA Color Flip se pehle huge Move kar sakti hai. Normal calm Session Trend Following Rules first M1 News Candle ke liye equally reliable nahi. Economic Calendar check, Spread Filter aur Lot Risk set karein. Gold agar already H1 Supply tak rally kar chuki ho to HA Green hone ke bawajood late Buy poor Risk Reward. No Confirmation = No Trade. Jab Risk unclear ho to Flat rehna disciplined approach hai.
Educational content only. Trading involves risk. Always use independent analysis and appropriate risk management.