
Money Flow Index (MFI) Explained: Price-Volume Momentum, 80/20 Levels and Forex Data Limits
PipSePaisa • Forex Education & Research
WHAT IS THE MONEY FLOW INDEX?
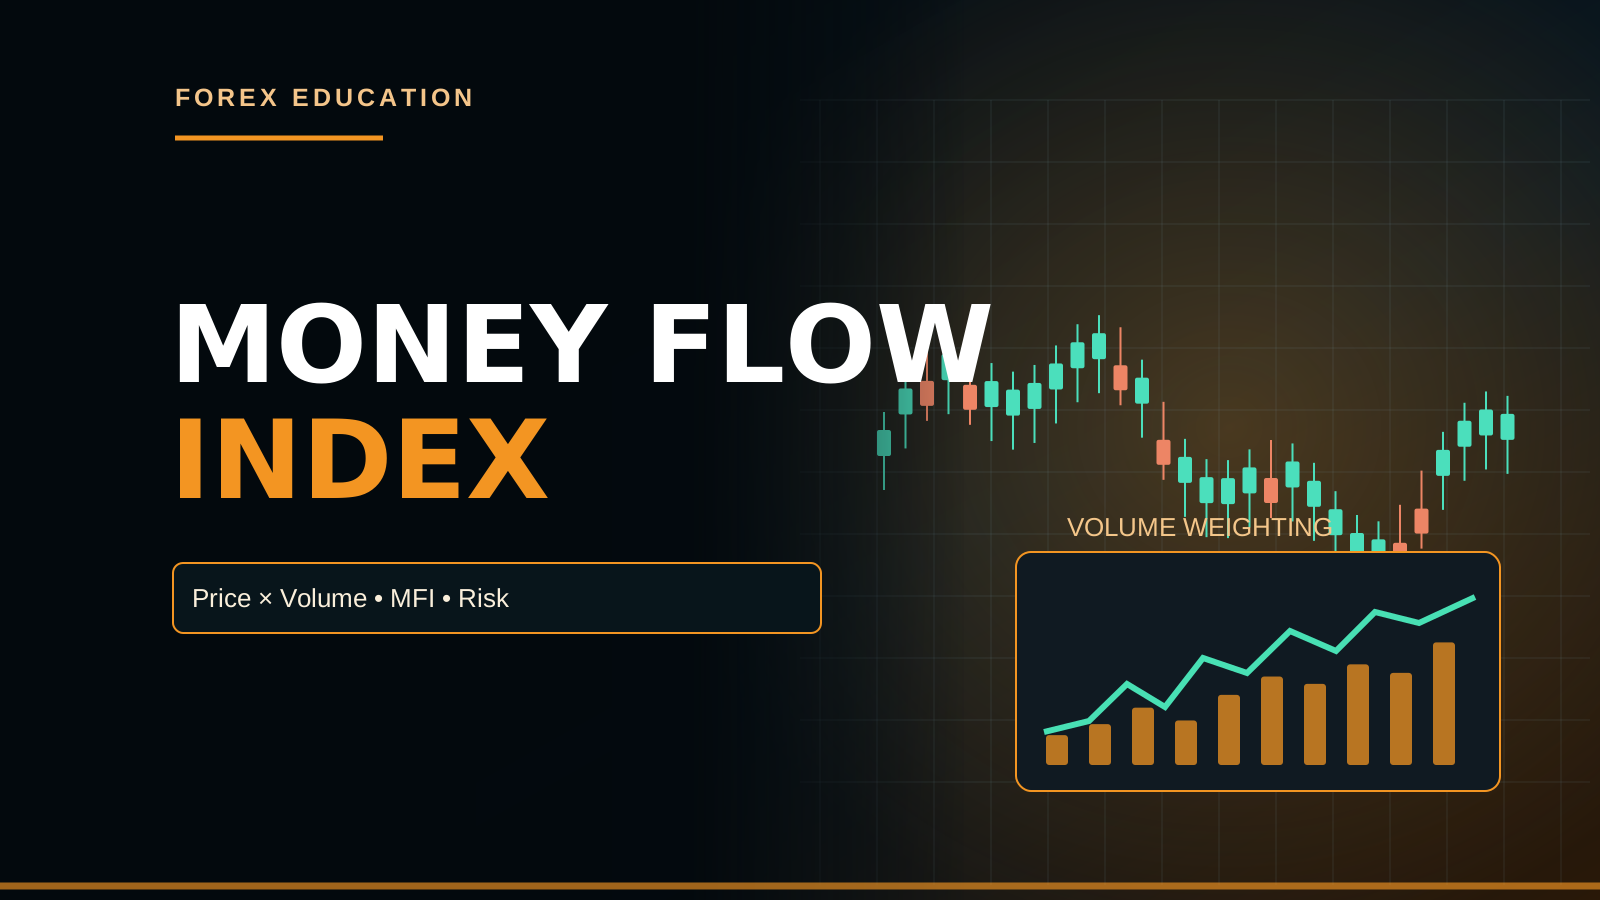
The Money Flow Index, or MFI, is a technical oscillator that combines price information with a volume input to estimate the direction and intensity of positive versus negative money flow over a chosen period. Its calculation resembles a volume-weighted variation of a relative-strength approach, but it is not an actual statement of how many dollars institutional investors transferred into an asset. MFI values commonly range from zero to one hundred. Like other oscillators, MFI describes historical observations and cannot guarantee an upcoming Forex or Gold price reversal.
PRICE-VOLUME INDICATOR BASICS
Price movement describes how quotes or transactions change through time, while volume measures an amount of activity under the data source's conventions. Combining the two may provide a richer description than price alone when the volume input is meaningful. However, volume is not universally comparable across decentralized Spot Forex brokers and centralized exchange-traded futures. Retail tick counts can reflect quotation updates, not global executed notional amounts. Before interpreting MFI on MT5, identify whether the symbol provides tick volume, real exchange volume or broker-specific proxy data.
TYPICAL PRICE FORMULA
A common MFI calculation starts by determining Typical Price for each bar as (High + Low + Close)/3. This summarizes the bar's selected price information. If High is 110, Low is 98 and Close is 104, the Typical Price equals 104. This is not necessarily the exact opening or closing transaction price. A data-feed difference in highs and lows may lead to a different Typical Price, which can alter the following money-flow calculations. The chosen candle timeframe and broker symbol therefore matter.
RAW MONEY FLOW
A widely used MFI step multiplies Typical Price by the bar's selected volume, producing Raw Money Flow. If the Typical Price is 100 and reported volume is 500 units, the raw product is 50,000 in the data's price-volume units. The economic meaning depends on whether volume represents contracts, shares, broker ticks or something else. A 50,000 raw figure from quote ticks cannot be assumed to equal fifty thousand US dollars of confirmed bank buying. Always describe the calculation without overstating its real-world coverage.
POSITIVE VERSUS NEGATIVE FLOW
In the conventional MFI method, a bar's raw money flow is categorized as positive when its Typical Price exceeds the previous bar's Typical Price and negative when it falls below. Equal Typical Prices may be handled without assigning positive or negative flow depending on implementation. This classification should not be mistaken for knowing which participant initiated every trade. A rising Typical Price is enough for the method's positive classification even though every completed market transaction still has both a buyer and a seller.
MONEY FLOW RATIO
The MFI formula commonly sums positive and negative Raw Money Flow over the selected lookback and divides the positive total by the negative total to produce a Money Flow Ratio. For example, positive flow of 900 and negative flow of 300 yields a ratio of 3 under this simplified calculation. If the denominator is zero, the implementation needs appropriate handling rather than naive division. The ratio is then transformed onto a more interpretable scale. Exact values depend on period length and price/volume data.
THE MFI OSCILLATOR FORMULA
One common form is MFI = 100 − 100/(1 + Money Flow Ratio). Under the illustrative ratio of 3, the output is 100 − 100/4 = 75. This says that the rolling money-flow calculation favors the positive component under its classification, not that a new Buy has a seventy-five-percent probability of success. It also does not guarantee an actual 75-percent increase in a brokerage account. The MFI reading is unitless after normalization, whereas real Stop Loss risk depends on contract values and prices.
WHY 80 AND 20 ARE COMMON
Many MFI chart templates use 80 and 20 as conventional upper and lower reference levels. An MFI above eighty is often called overbought, and a reading under twenty oversold. These are descriptors of recent indicator imbalance, not universal support and resistance levels for the actual market price. In a strong Gold uptrend, MFI can remain elevated; in a steep decline, it can stay depressed. Mechanical reversal trades on every threshold crossing can suffer repeated losses. Price location and market regime matter.
WHY OVERBOUGHT CAN STAY OVERBOUGHT
An asset may sustain bullish price momentum while volume remains elevated, resulting in repeated positive Raw Money Flow. MFI can therefore stay high for an extended period. That is not proof of manipulation or an imminent top. A mean-reversion strategy must determine what actual price event would invalidate its bullish trend, such as a completed structure break near H1 Supply. Selling because MFI is eighty-five without considering the higher timeframe can be premature. A trend-following approach may interpret the same condition differently.
WHY OVERSOLD CAN STAY OVERSOLD
During a pronounced bearish move, declines in Typical Price accompanied by activity can create persistent negative flow. A low MFI may therefore describe continuing pressure rather than a bargain. An H4 downtrend breaking H1 Demand should not automatically be bought because a small MFI panel turns red. A valid reversal candidate might require a new structural Higher Low, completed M5 bullish confirmation and sufficient target room. The oscillator itself cannot establish whether liquidity is genuinely exhausted or whether a major market participant is changing position.
MFI AND RSI ARE DIFFERENT
MFI and the Relative Strength Index both use normalized oscillator scales but calculate them differently. RSI commonly derives relative strength from averaged price gains and losses; MFI weights price direction with a volume measure. They may agree during a strong move or diverge when volume varies. A higher MFI than RSI does not automatically prove institutions are accumulating shares or Gold. The definitions, periods and source quality need to be checked. Combining the two does not necessarily create independent confirmation if their price components overlap.
MFI VERSUS ON-BALANCE VOLUME
On-Balance Volume, or OBV, accumulates positive or negative volume according to a price direction rule, creating a cumulative series rather than MFI's bounded ratio-based oscillator. Both rely on the volume data source and can be misleading when input represents broker tick counts rather than consolidated traded amounts. OBV rising while MFI falls can occur because their rules and windows differ. A trader should not count OBV and MFI as two independent confirmations without studying overlap. The actual price trigger still matters.
FOREX SPOT VOLUME LIMITATIONS
The Spot Forex market is decentralized, so a typical retail broker does not supply one global consolidated record of every executed EUR/USD trade. MetaTrader 5 volume indicators on retail currency symbols often use broker tick volume, reflecting quotation updates or broker-specific activity rather than global traded lots. Tick activity may be correlated with market activity under some conditions, but it is not identical to worldwide dollar volume. Therefore the exact MFI value can change across brokers and feeds. Do not advertise an MFI spike as verified worldwide institutional inflow.
GOLD CFD VERSUS GOLD FUTURES
A retail XAUUSD CFD is broker-defined and its volume may reflect quotes or provider data. COMEX Gold futures are exchange-traded products with reported contract activity under the exchange's rules. MFI on the futures chart may use exchange volume, whereas a CFD MFI may rely on tick counts. The indicators can look different even when the quoted prices broadly move together. Contract expiration, session and price basis must be checked before transferring levels or trading conclusions. Futures MFI also does not reveal every OTC Gold transaction globally.
MFI BULLISH DIVERGENCE
A bullish MFI divergence may be described when price makes a lower low while MFI makes a higher low at comparable confirmed swing points. This can indicate that the oscillator's negative-flow relationship has moderated, but it is not proof that sellers have exhausted their orders. During a sustained downtrend, such divergences can persist and fail. A trader might treat divergence as a warning near H1 Demand while requiring an independent M5 bullish CHoCH. If structural confirmation does not arrive, the correct response may be to abstain.
MFI BEARISH DIVERGENCE
A bearish divergence may appear when price reaches a higher high but MFI records a lower peak. Some traders interpret this as weaker volume-weighted momentum during price advances. Yet it can arise because of different activity across bars without causing a genuine trend reversal. Divergences near H4 Supply may justify closer observation but not blind shorting. A completed bearish M5 structure shift, target room and appropriate Stop should be required for any real trade. Do not label every divergence as a known institution distributing positions.
MFI FAILURE SWINGS
Some technical methods discuss failure-swing patterns in oscillators, where indicator movements form a characteristic sequence around extreme levels before breaking an internal oscillator swing. Such patterns are definitions imposed on historical indicator values, not direct executable prices. An MFI failure swing should not be confused with an actual M5 market-structure Change of Character. If a strategy uses both, write separate conditions and bar-close timing. A price entry still requires a real quotation, a defined Stop Loss and an objective reason that the trade thesis would fail.
A GOLD BUYING-ZONE CASE
Suppose H4 Gold is bullish and XAUUSD returns toward a meaningful H1 Demand Zone. The MFI dips toward twenty during the pullback, then rises as a completed M5 bullish engulfing and Higher Low appear. This may provide optional volume-related context for a conditional Buy under a tested system. However, if the MFI is based on retail tick volume, it does not certify exchange-wide accumulation. Place the Stop below relevant price structure and size the lot using the broker's Gold contract specification. An upcoming NFP release may justify skipping.
AN EUR/USD SELLING-ZONE CASE
Consider EUR/USD in an H4 downtrend, retesting H1 Supply during London trading. MFI moves high during the corrective rise, then falls as M5 completes bearish CHoCH. A disciplined Sell setup would need the rejection high as structural invalidation, a realistic target before the next H1 Demand and net costs compatible with the planned reward. If ECB news drives a genuine H1 breakout above Supply, the prior bearish thesis may fail regardless of the MFI reading. The indicator is contextual, not decisive.
MFI ON M5 VERSUS H1
An MFI value calculated on M5 can flip quickly after a few active bars, while H1 may continue to reflect a larger directional context. Comparing the two without accounting for different lookback durations can lead to unnecessary confusion. One tested approach might use H1 MFI only as background and M5 ordinary price structure for entry. A still-forming M5 candle changes its High, Low, Close and Volume input, so the latest MFI reading can move before candle close. If close confirmation is a rule, do not trade the temporary state.
BACKTESTING PRICE-VOLUME FILTERS
To determine whether MFI adds value, compare a baseline H4 trend/H1 zone/M5 confirmation strategy with a version using an MFI threshold or divergence filter. Keep the same symbols, realistic spread/commission and stop rules, and note which volume source each dataset used. A strategy that performs on one exchange-futures feed may not behave identically on retail CFD tick volume. Record missed winners as well as rejected losers, total net R, drawdown and sample size. Historical selected winning charts do not prove an edge.
MFI FAQ AND FINAL TAKEAWAY
Does MFI directly measure worldwide bank cash entering EUR/USD? No. Does it use a volume input? Yes, according to the data feed. Are 80 and 20 guaranteed reversal points? No. Can its values differ across brokers? Yes. Is MFI identical to RSI or OBV? No. Can a tick-volume MFI be useful as a technical observation? Potentially, if limitations are understood. The execution plan remains H4/H1 location, completed M5 confirmation, structural Stop and monetary risk matched to the actual tradable instrument.
PIPSEPAISA FREE COURSES
Learn trading volume concepts, price structure and M5 confirmation in Sir Sajid Khan Ghori's Free Forex Technical Analysis Course, and economic releases in Sir Ghulam Abbas's Free Forex Fundamental Analysis Course. Check current details in Courses at www.pipsepaisa.com. This guide is educational, not personal financial advice. Trading Forex and Gold with leverage can cause substantial losses.
Read in Roman Urdu
MONEY FLOW INDEX MFI KYA HAI?
Money Flow Index MFI Price aur Volume Inputs combine kar ke positive/negative Money Flow Momentum estimate karta hai. Ye actual Worldwide Banks ke Cash Inflows ka official Audit nahi. MFI usually 0 se 100 Range. Gold XAUUSD, EUR/USD, Futures aur Stock Charts par calculate ho sakta hai but underlying Volume Data type different. High MFI automatically institutions buy kar rahi hain, proof nahi. Indicator derived historical data hai, guaranteed next M5 candle signal nahi. H4/H1 Market Structure and SL important.
PRICE VOLUME COMBINATION
Price Trend direction show karti, Volume chosen Data Source Activity magnitude. MFI dono combine karne ka method. Lekin Retail Forex Broker Tick Volume actual Globally Traded Lots same nahi. Futures Exchange Reported Contracts more centralized. MT5 Volume Bar Tick Count ho sakti hai, Broker Real Volume Data not guaranteed. MFI Green/Red Reading reliable context only if input understood. XAUUSD CFD and COMEX Futures MFI numbers differ. Data Source identify karein.
MFI TYPICAL PRICE
MFI Typical Price = (High + Low + Close) / 3. Hypothetical H 110, L 98, C 104 to Typical Price = 104. Ye calculated bar reference, real Market Ask/Bid execution guarantee nahi. Broker Gold High/Low different, MFI Price Source accordingly. M5 Typical Price calculation and H1 different periods. Underlying OHLC clean Data important. Signal strategy full candle close use.
RAW MONEY FLOW FORMULA
Raw Money Flow = Typical Price × selected Bar Volume. Example Typical Price 100 aur Volume 500 ho to 50,000 arbitrary Price-Volume Units. Lekin Volume 500 Broker Ticks hon to Cash $50K transfer automatically nahi. Futures Contracts, Shares, CFDs Tick Counts different. MFI Formula ka Raw Flow name actual global funds movement proof nahi. Indicator Source Transparency essential. Retail Forex education mein ye distinction important.
POSITIVE NEGATIVE FLOW
MFI Positive Money Flow typical agar Current Typical Price Previous Bar se greater ho. Negative if Current Typical Price lower. Equal cases software conventions. Ye every transaction aggressive Buy/Sell Volume ki exact classification nahi. Rising Price Bar ke Raw Volume Positive Category assign, lekin actual Market Trade both Buyer Seller involved. Footprint Bid/Ask Delta aur MFI Positive Flow calculation same information nahi. Chart Indicator label se institutional motives infer mat karein.
MONEY FLOW RATIO
Lookback N Bars ke Positive Raw Money Flow Total ÷ Negative Raw Money Flow Total = Ratio. Example Positive 900, Negative 300 => Ratio 3. Negative Total zero ho to software safe calculation required. MFI Rolling Window ke saath update. Ration 3 matlab three guaranteed future Buy Trades nahi. Price/Volume Scaling and selected Broker Series context. Historical Indicator Data realtime conditions se.
MFI COMPLETE FORMULA
MFI = 100 − 100/(1 + Money Flow Ratio). Hypothetical Ratio 3 => 100 - 100/4 = 75. MFI 75 means 75% next Candle win chance nahi. Trading Account +75% Gain prediction nahi. Normalized Oscillator Scale 0–100. Money Flow data classification chosen period par. Account Dollar Risk via Stop Distance, Lot, Tick/Pip Value. No Confirmation = No Trade.
MFI 80 20 LEVELS
MFI Chart par 80 above Overbought, 20 below Oversold commonly. Strong Bullish XAUUSD trend mein MFI 80+ multiple H1 bars possible. Bearish Move 20 below persist. High/Low Reading guaranteed reversal nahi. H4 Trend, H1 Supply/Demand and regular M5 Engulfing/CHoCH full confirmation. Blind overbought Sell losses. Indicator Levels Forex Currency Strength Values ke same nahi.
OVERBOUGHT STAY KYUN?
Gold Strong H4 Higher High/Low Trend mein Price typical rising aur Broker Volume activity elevated ho to MFI high stay. MFI 85 = Banks Sell immediately next minute proof nahi. H1 Supply or Resistance near and M5 completed bearish CHoCH needed for potential reversal. Mean Reversion and Trend Following opposite interpretation. Prewritten Rules. Price rise continue ho to indicator may remain extreme; Risk Management.
OVERSOLD STAY KYUN?
H4 Strong Bearish Trend mein MFI 20 below remain for many bars. Negative Classified Flow bearish context, but oversold means automatic Buying opportunity nahi. H1 Demand break ho to Gold further lower possible. Reversal only if meaningful H1 Reaction and M5 Bullish CHoCH/Engulfing Full Close. SL Actual Swing Low below. MFI low actual pending institutional Orders quantity proof nahi. No Confirmation = No Trade.
MFI VS RSI
RSI Price Gain/Loss Average based, MFI Price and Volume classification. Both 0–100 but formula different. MFI 85 aur RSI65 ho to institutional accumulation automatically prove nahi. MFI Broker Tick Volume Source may influence. Combining two similar Price-Based Oscillators guaranteed 90% Win Rate nahi. H1 Zone plus M5 Signal objectively test. RSI/MFI Period mismatch comparison important.
MFI VS OBV
On Balance Volume OBV direction according cumulative Volume Series; MFI rolling positive/negative Price×Volume Ratio normalized 0–100. Different Indicators, same Broker Tick Data dependent possible. OBV Rising, MFI weaker reading contradictory but algorithms different. Two Indicators both Green = global bank orders double proof nahi. H4 Structure, H1 Demand and M5 confirmation mandatory. Independent Test whether filter adds value.
SPOT FOREX VOLUME LIMIT
Retail EUR/USD Spot Forex Decentralized. MT5 Broker Tick Volume global consolidated Exchange Contracts nahi. Tick counts Quote Updates intensity, actual worldwide USD Billions measure nahi. MFI Price × Tick Count calculate kare to Name Money Flow despite not confirmed real money. Different Broker Feeds different MFI Lines. Some Tick Volume Market Activity correlate ho sakta hai but equality not guaranteed. Source Identify and Students ko clearly explain.
GOLD FUTURES VS CFD MFI
Retail MT5 XAUUSD CFD Tick Volume aur COMEX Gold Futures Exchange Trade Volume different. Futures MFI real reported Contracts use kar sakti, CFD broker Quote Updates. Price related but Futures Contract Expiry, Tick Value, Session and Basis different. MFI Divergence futures par show, MT5 XAUUSD par missing possible. COMEX data entire world Gold OTC Trades capture nahi. Accurate education avoids universal institutional flow claims.
MFI BULLISH DIVERGENCE
Price Lower Low banaye aur MFI comparable Higher Low, possible Bullish Divergence. Negative Price-Volume Momentum weaker clue, guaranteed reversal nahi. Gold H4 Downtrend multiple divergence failures. H1 P+ Demand and M5 Bullish CHoCH Full Close required conditional Buy. Swing selection same Timeframe. Hindsight perfect Low choose biased. Structural SL and Risk Limit.
MFI BEARISH DIVERGENCE
Gold Higher High and MFI Lower High possible Bearish Divergence. Price rally ke relative Volume-weighted Momentum weaker, but Bank Distribution confirmed not. H1/H4 Supply Rejection and M5 Bearish Engulfing/CHoCH Full Close then conditional Sell. Strong Uptrend continue possible. Divergence at every H1 High guaranteed reversal nahi. SL Swing High and Target Supply/Demand.
MFI FAILURE SWING
MFI Failure Swing oscillator peak/trough sequence ka named technical pattern ho sakta hai. Ye actual Gold H1 Price BOS/CHoCH exactly same nahi. Indicator Lines ka internal Break aur Price Structural Swing Break distinguish. Agar Strategy both require karti hai to exact M5 Close and Indicators Bar Index define. Real MT5 Entry Bid/Ask Quote se. MFI 80 Cross entry price ya SL nahi. Loss Risk.
GOLD MFI BUY EXAMPLE
Gold H4 HH/HL, H1 P+ Buying Zone Pullback, MFI near20 then higher, M5 Full Bullish Engulfing and Higher Low. Conditional Buy Watch. But Broker Tick Volume institutional Gold Buying guarantee nahi. SL actual Swing Low below, TP next H1 Supply. Gold Contract Size and Equity Lot. NFP imminent ho to No Trade. No Confirmation = No Trade.
EURUSD MFI SELL EXAMPLE
EUR/USD H4 LH/LL, London Session H1 Supply Pullback. MFI high then lower, M5 Bearish CHoCH Full Close conditional Sell. SL Rejection Swing High above, TP next H1 Demand. ECB Rate Surprise bullish EUR create H1 breakout; Sell thesis fail. MFI alone Guarantee nahi. Broker Spread and Pip Value correctly calculate. Risk budget same.
M5 VS H1 MFI
M5 MFI Fast Tick Activity Changes se value fluctuate, H1 broader selected 14 Bars. H1 MFI Green/M5 Red Pullback possible. Different Timeframes not automatically indicator error. Forming M5 Candle Volume High/Low/Close all moving, MFI crossing after close revert. Closed-Bar Signal rule apply. Gold H4 Trend/H1 Zone first, M5 Price Confirmation last. Avoid premature entry.
MFI BACKTEST FAIR
Plain H4 Trend + H1 Demand + M5 Engulfing vs With MFI Filter compare. Same Period, Broker Tick Volume Source, Spread, Lot, SL/TP. Futures Exchange Volume Test and CFD Tick test different. Filter Good Winners reject ya Bad Trades avoid both. Net R, Drawdown, Win Rate/Avg Winner Loss, Sample Size. Only Winners Screenshots high accuracy claim misleading. Out-of-Sample important.
MFI FAQ FINAL
MFI worldwide Banks actual Cash Flows? Nahi. Volume Input use? Haan, feed dependent. MFI80/20 Guaranteed reversal? Nahi. Broker Difference? Haan. RSI/OBV same? Nahi. Tick Volume MFI useful? Possible with limitations. Process H4 Structure → H1 Demand/Supply → MFI optional context → M5 Full Confirmation → Structural SL/TP/Lot and Journal. No Confirmation = No Trade.
PIPSEPAISA FREE COURSES
Sir Sajid Khan Ghori ka Free Forex Technical Analysis Course aur Sir Ghulam Abbas ka Free Forex Fundamental Analysis Course ki current details www.pipsepaisa.com Courses par. Educational Material, Financial Advice nahi. Leverage account loss risk.
BROKER TICK VOLUME IMPORTANT REMINDER
MFI Widget agar Forex EURUSD par Value 90 dikha rahi hai to '90 Percent Global Banks Buy' social media par claim inaccurate. Tick Volume Broker Price Updates ho sakta hai, not global executed Volume. Each Platform Market Data Feed, History and Session change MFI values. COMEX Futures real reported Volume different. Proper Student Education mein this limitation compulsory. Gold Trading ka final decision H4 Bias, H1 P+ Zone, completed M5 Engulfing/CHoCH, realistic SL and Account Lot se. No Confirmation = No Trade.
Educational content only. Trading involves risk. Always use independent analysis and appropriate risk management.