
RSI Indicator Explained: Relative Strength Index, Overbought/Oversold and Divergence Trading
PipSePaisa • Forex Education & Research
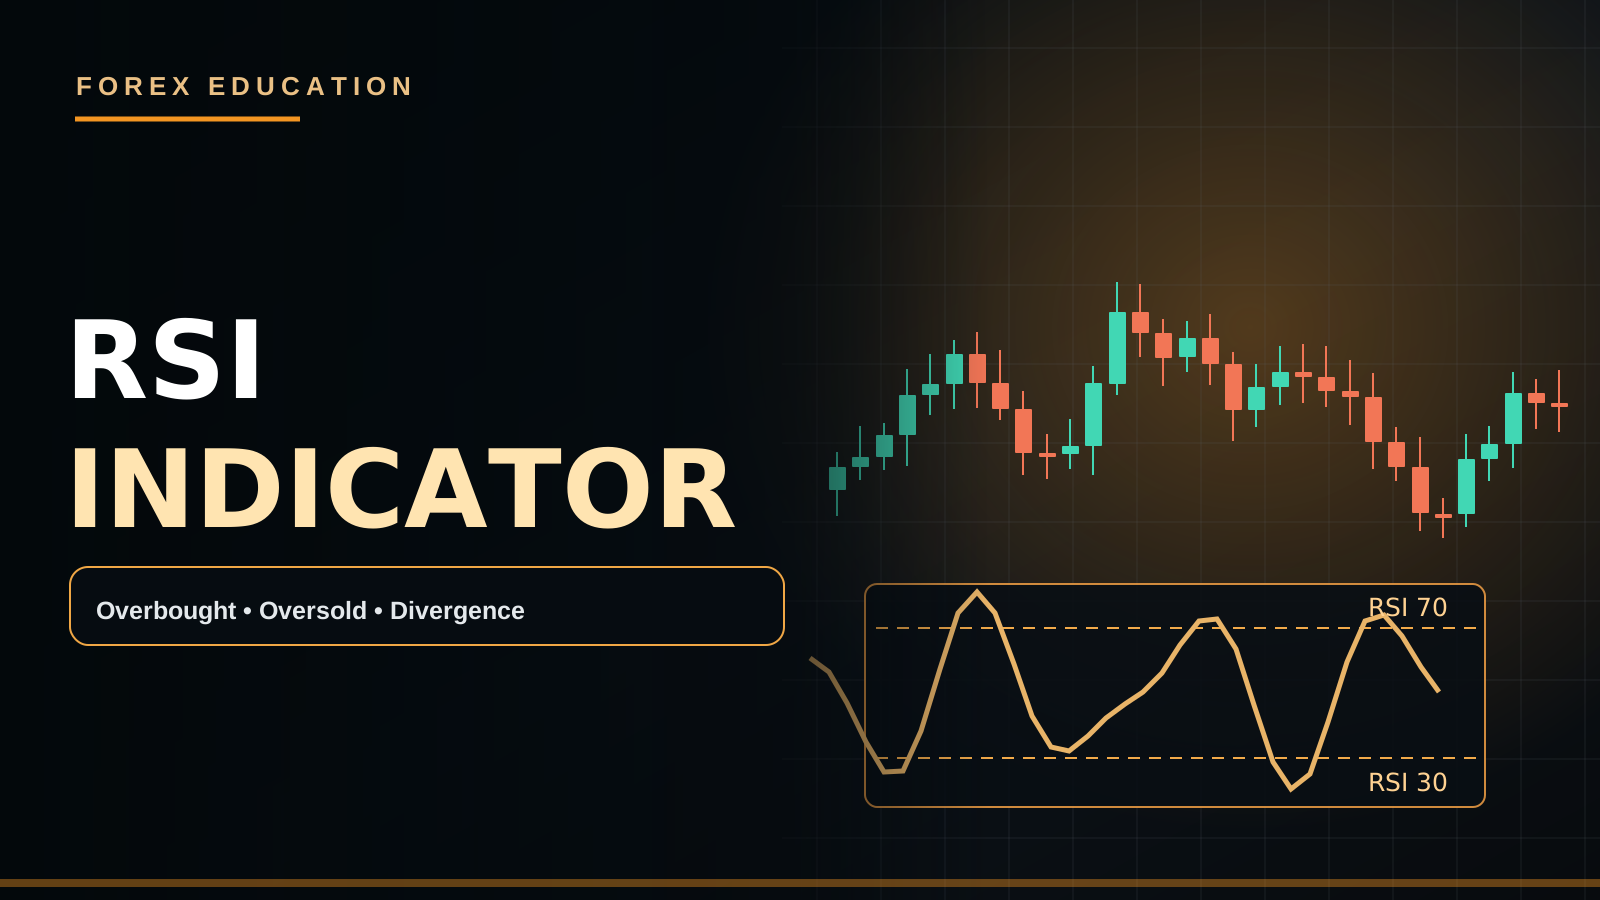
INTRODUCTION — THE RELATIVE STRENGTH INDEX
RSI is a momentum oscillator developed by J. Welles Wilder to summarize the relationship between recent average upward and downward price changes. It typically moves between zero and one hundred. The commonly used default period is fourteen bars, but that is a convention, not proof that fourteen is always optimal. RSI can highlight momentum conditions, shifts and potential divergences. It does not identify buyers' and sellers' real order-book sizes and should not be treated as a guaranteed reversal signal.
RSI FORMULA AND THE CORE CALCULATION
A simplified formula is RS = Average Gain / Average Loss, followed by RSI = 100 - 100 / (1 + RS). Wilder's original smoothing method updates the average gains and losses over time rather than recalculating a completely unrelated fourteen-candle set on each bar. If Average Gain equals Average Loss, RS is one and RSI is fifty. If positive changes dominate, RSI rises; if negative changes dominate, it falls. RSI measures directional momentum using past price movements, so it necessarily lags price to some degree.
WHY RSI 70 IS CALLED OVERBOUGHT
A reading above seventy often gets labeled Overbought, while below thirty is labeled Oversold. These are common thresholds rather than mechanical probabilities of immediate reversal. In a strong uptrend RSI can stay above seventy and price can continue climbing. In a sustained downtrend it can remain under thirty. Calling every RSI 75 candle Sell means trading against momentum without regard to H4 structure, support/resistance or economic events.
RSI 30 AND OVERSOLD CONDITIONS
An RSI reading below thirty indicates downward changes have recently dominated under the chosen calculation. It does not mean the asset has become objectively cheap. Gold can keep falling when real yields rise or unexpected data strengthens USD. A trader studying a bullish reversal can wait for price to reach a pre-marked H1 Demand Zone, then look for a completed M5 rejection and a change in local structure. RSI may add context, but it cannot replace a valid entry thesis.
THE 50 LEVEL AS MOMENTUM CONTEXT
RSI near fifty suggests recent average upward and downward movements are relatively balanced. Moving above fifty may align with increasing bullish momentum; crossing below may indicate more bearish pressure. However, repeated crossings during a tight range can cause frequent false signals. Some strategies use RSI 50 as a trend filter after H1 market structure is already established. Avoid interpreting a small oscillation from 49 to 51 as a guaranteed meaningful breakout.
BULLISH DIVERGENCE
A commonly described bullish divergence occurs when price creates a lower low but RSI creates a higher low. This indicates that the latest price low may have formed with weaker downward momentum according to the oscillator. It is a warning worth investigating, not proof that price must reverse. Define the two swing lows consistently and use completed indicator values. In a strong downtrend, divergence can persist through multiple further price lows.
BEARISH DIVERGENCE
A bearish divergence may appear when price forms a higher high but RSI forms a lower high. The latest price push can be losing momentum relative to an earlier move. This is most relevant when combined with a significant H1/H4 Supply area or previous-day high. But an advancing market can continue rising despite bearish divergence. A Sell should still require a completed price-action confirmation and structural invalidation according to the trader's written method.
HIDDEN DIVERGENCE AND CONTINUATION
Some traders look for hidden bullish divergence when price forms a higher low but RSI forms a lower low within an uptrend, or hidden bearish divergence when price forms a lower high but RSI rises to a higher high within a downtrend. The idea is possible trend continuation rather than a classic reversal warning. The definitions and results depend on precise swing selection. Do not retrofit swings after observing which trades won.
RSI IN RANGING VERSUS TRENDING MARKETS
During a well-defined H1 range, momentum oscillators can move repeatedly between Overbought and Oversold conditions as price tests the boundaries. A trader might combine RSI extreme readings with confirmed resistance or support reactions. During a strong directional trend, the same thresholds can remain extreme for longer. Classify the market condition first. A strategy suitable for a range can fail badly when an NFP surprise initiates strong continuation.
RSI WITH MULTIPLE TIMEFRAMES
A practical workflow might establish bias on H4, mark Support/Demand or Supply on H1, assess the completed RSI reading on M15 and wait for M5 candle confirmation. An M5 RSI move above fifty does not automatically reverse a bearish H4 trend. Different indicator timeframes average different sequences of price changes. Keep a fixed hierarchy rather than switching between M1 and H1 RSI signals until one supports a preferred trade.
A NUMERICAL RSI EXAMPLE
Suppose the smoothed average gains are 0.60 units and average losses 0.30 units for an illustrative calculation. RS = 0.60/0.30 = 2. RSI = 100 - 100/(1+2) ≈ 66.7. That reading suggests recent upward changes outweighed downward changes, but it is not over the conventional seventy threshold. It also does not imply a 66.7% probability that the next candle will be bullish. Momentum level and outcome probability are fundamentally different quantities.
RSI SETTINGS AND OVERFITTING
A shorter RSI period such as seven can react faster but produce more noisy swings; a longer period such as twenty-one generally responds more slowly. Altering period and thresholds after every loss can overfit historical price data. Test a fixed rule across different Forex pairs, volatility regimes and trading sessions with realistic spread and commission. Never claim that a default setting is universally profitable without a measured sample of trades.
ENTRY, STOP LOSS AND TARGET
For a bullish setup, RSI might recover from a lower extreme as price rejects H1 Demand. The trader waits for a completed M5 bullish engulfing or a confirmed local CHoCH. Stop Loss belongs beyond structural invalidation rather than at an RSI number. Position Size comes from Equity, allowed monetary loss and pip/tick value. Target can be previous resistance or an opposing zone. The trade is invalid if price action fails even if RSI stays supportive.
NEWS AND FALSE MOMENTUM SIGNALS
High-impact releases can rapidly change RSI values as price spikes. An oscillator that looks oversold during a falling Gold news candle may become even more oversold before a meaningful reversal. Bid/Ask spread and slippage can also widen. If the method excludes CPI, NFP or FOMC, observe that rule. RSI is an interpretation of recent prices, not an independent economic forecast.
A DIVERGENCE IS NOT A STRUCTURE BREAK
Suppose XAUUSD forms a lower price low while M15 RSI creates a higher oscillator low. Some educators call that bullish regular divergence. Price has still created a lower low; unless price later closes above an important lower high, bearish swing structure may remain intact. A trader who buys the first divergence while price continues making lower lows is anticipating a reversal before price has confirmed one. Distinguish momentum weakening from actual direction change. Use a stop defined by the chart, not a line drawn between two RSI lows.
RSI FAILURE SWINGS
Wilder also described RSI failure-swing ideas based on the oscillator's own turning points. A bullish failure-swing interpretation may involve RSI moving below the usual oversold area, recovering, pulling back without returning to a new oscillator low and then breaking a prior RSI peak. This can suggest improving momentum, but the indicator pattern alone still does not confirm that an H1 price level will hold. A bearish counterpart can develop at upper momentum extremes. Define the indicator swing levels precisely and test full completed readings rather than selectively labeling successful historical turns.
BULLISH AND BEARISH MOMENTUM RANGES
Experienced traders sometimes study whether RSI tends to remain in relatively higher ranges during sustained uptrends and lower ranges during downtrends. For example, a strong bullish phase may see RSI pullbacks repeatedly hold above the conventional oversold threshold, while bearish phases can struggle to sustain readings above the centerline. These are observations, not universal fixed bands. The threshold behavior depends on timeframe, volatility and market regime. Checking H4 structure prevents the mistake of assuming every RSI 40 reading is weak regardless of trend.
A COMPLETE RSI TRADE-JOURNAL CASE
A hypothetical EUR/USD H4 uptrend pulls back into H1 Demand. M15 RSI declines toward forty rather than below thirty, then turns upward. M5 prints a bullish engulfing close above local resistance. A proposed Buy uses a Stop Loss below the meaningful rejection swing and targets a previous H1 high. If the target is only twelve pips away but SL requires thirty, the trader can reject the trade even though RSI and the candle align. Record RSI values from completed bars, the original H1 zone and the actual costs. A stopped trade is not automatically evidence that RSI is useless; examine the entire validated sample.
WHY USING RSI WITH MACD CAN BE REDUNDANT
RSI and MACD both derive information from past price changes, though they process it differently. If both appear bullish, they are not two fully independent proofs that buyers will win. An EMA crossover may also be reflecting the same price impulse. Decide what each tool contributes: RSI might track momentum strength, MACD might summarize fast-versus-slow moving-average momentum, and H1 Supply/Demand supplies a distinct historical location. Adding three indicators with the same information can increase complexity without improving expectancy.
A ROBUST RSI BACKTEST CHECKLIST
Specify indicator period, source price, thresholds, timeframe, whether divergence counts only at confirmed price swings, which H4 conditions qualify, exact M5 candle trigger, Stop Loss and TP. Record all valid signals even if they were inconvenient to trade. Evaluate different regimes separately and include commissions. Change one rule at a time so you can see whether a modification genuinely helps. A strong reported win rate from a few carefully chosen divergence screenshots is not proof of a repeatable strategy.
PIPSEPAISA FREE COURSES
Study price action, market structure, indicators and trading confirmation in the Free Forex Technical Analysis Course with Sir Sajid Khan Ghori. To understand the market data and central-bank forces behind Gold and Forex moves, explore the Free Forex Fundamental Analysis Course with Sir Ghulam Abbas. Open Courses on www.pipsepaisa.com for registration. Education is not a guarantee of results.
CONCLUSION AND RISK DISCLAIMER
RSI helps measure relative recent bullish and bearish momentum. The seventy/thirty thresholds, RSI fifty level and divergence patterns should be interpreted in context rather than used as automatic Buy or Sell buttons. Combine a defined price zone, higher-timeframe structure, completed confirmation and calculated loss budget. No Confirmation = No Trade. All examples are educational, and leveraged Forex trading involves capital risk.
Read in Roman Urdu
INTRODUCTION — RSI INDICATOR KYA HAI?
Relative Strength Index yani RSI ek popular Momentum Oscillator hai jo J. Welles Wilder ne develop kiya. Ye recent bullish aur bearish price changes ki average relationship ko measure kar ke zero se hundred tak reading show karta hai. Common Default Period 14 Candles hai, lekin iska matlab 14 har Symbol aur Timeframe ke liye mathematically best ya guaranteed profitable nahi. RSI Momentum, Overbought/Oversold aur Divergence ke clues de sakta hai, lekin actual global institutional order-book positions directly show nahi karta.
RSI FORMULA KAISE WORK KARTA HAI?
Simplified formula mein RS = Average Gain / Average Loss hota hai. Phir RSI = 100 - 100/(1+RS). Wilder ke original approach mein Gains aur Losses ki smoothed averages update hoti hain. Agar Average Gain aur Average Loss equal hon to RSI near 50 hota hai. Gains relatively strong hon to RSI higher hota hai aur Losses dominate karein to RSI lower. Ye Indicator past Price Movements se calculate hota hai, is liye future Candle ki guaranteed prediction nahi. Calculation samajhna sirf green/red colors dekhne se zyada useful hai.
RSI 70 OVERBOUGHT KA REAL MEANING
RSI 70 se upar ho to commonly Overbought label milta hai. Lekin Overbought ka matlab turant Sell signal nahi. Strong Uptrend mein RSI 75, 80 ya us se upar bhi remain kar sakta hai aur Market new Higher Highs banati rehti hai. Agar trader har RSI 70 par Sell leta hai to Trend ke against repeated losses ho sakte hain. H4 Structure, H1 Supply/Resistance, Trend Strength aur Current Economic News ka context zaroor dekhna chahiye.
RSI 30 OVERSOLD KYA HAI?
RSI 30 se neeche ho to recent bearish movement relatively strong rahi hoti hai. Iska matlab Asset guaranteed cheap ho gaya, aisa nahi. Gold Real Yields rise hone ya USD unexpectedly strong hone se decline continue kar sakti hai. Agar Bullish Reversal study karni hai to H1 Demand pehle mark karein, Price Zone tak aaye, M5 Rejection ya CHoCH Full Candle Close de. RSI ek extra Momentum Clue ho sakta hai, primary structural confirmation ka substitute nahi.
RSI 50 MIDLlE LEVEL
RSI near 50 ka matlab average upward aur downward price movement relatively balanced hai. 50 ke upar sustain hona bullish momentum aur neeche bearish pressure ka context de sakta hai. Lekin sideways Range mein RSI 49 se 51 aur wapas 48 regularly change ho sakti hai, jisse false crossover signals bante hain. Kuch Strategies H1 Trend confirm karne ke baad M15 RSI 50 filter use karti hain. Small Cross ko guaranteed big Breakout na samjhein.
BULLISH DIVERGENCE
Bullish Divergence mein Price Lower Low banati hai lekin RSI indicator Higher Low bana sakta hai. Ye suggest karta hai latest lower Price Low ke dauran Downward Momentum previous move se relatively weak thi. Lekin ye immediate Buy proof nahi. Strong Downtrend mein price multiple Lower Lows bana sakti hai jabke RSI Divergence existing ho. Two Swing Lows ka selection consistent rakhein aur Completed Indicator Values use karein. H1 Demand + M5 confirmed bullish shift extra evidence de sakta hai.
BEARISH DIVERGENCE
Bearish Divergence mein Price Higher High banaye aur RSI us corresponding swing par Lower High de. Ye latest rally ki slowing momentum ka clue ho sakta hai. Agar H1 Supply ya Previous Day High ke qareeb pattern bane to trader possible bearish scenario observe kar sakta hai. Lekin strong Uptrend RSI Divergence ke bawajood continue kar sakti hai. Sirf RSI red divergence line dekh kar Sell na lein; M5 Candle Close, Structural SL aur Reward Space assess karein.
HIDDEN DIVERGENCE AUR TREND CONTINUATION
Hidden Bullish Divergence ka common model hai Price Higher Low banati hai magar RSI Lower Low. Ye H4 Uptrend ke andar continuation context ka possible clue hai. Hidden Bearish Divergence mein Price Lower High banaye jabke RSI Higher High. Lekin ye pattern labels Trading Theory ke framework hain, guaranteed continuation nahi. Apne Swing Matching Rules pehle fix karein. Backtesting ke waqt losing examples mein RSI points retrospectively shift mat karein.
RSI RANGE AUR TREND MEIN DIFFERENT BEHAVE KARTA HAI
H1 Sideways Range mein RSI Upper/Lower Extremes kai baar aa sakte hain jab Price Support aur Resistance test karti hai. Trader RSI overbought ko H1 Resistance ke saath aur oversold ko H1 Support ke saath combine kar sakta hai. Strong Trend mein RSI extreme readings longer duration tak reh sakti hain. Range Strategy strong NFP trend mein fail ho sakti hai. Pehle Market Regime classify karein, phir Indicator interpretation choose karein.
MULTIPLE TIMEFRAME RSI WORKFLOW
H4 ko overall Bias ke liye use karein. H1 par Demand/Supply Zones mark karein. M15 RSI Completed Reading observe karein. M5 par actual Entry Trigger, Engulfing Close, Higher Low/Lower High ya CHoCH confirm karein. M5 RSI 50 ke upar move hone se H4 Bearish Trend automatically reverse nahi hoti. Har timeframe different Candle History par calculate hota hai. Different charts se selectively signal choose karna biased Analysis hai.
NUMERICAL RSI CALCULATION
Maan lein illustrative Smoothed Average Gains 0.60 aur Average Losses 0.30 units hain. RS = 0.60/0.30 = 2. Formula se RSI = 100 - 100/(1+2) ≈ 66.7. Is se recent Upward Price Changes stronger nazar aati hain, lekin RSI 66.7 ka matlab next Candle 66.7% probability se bullish hogi, ye incorrect interpretation hai. Momentum Reading aur Statistical Probability alag concepts hain.
RSI PERIOD SETTINGS
RSI 7-period relatively fast reaction de sakta hai magar more noisy signals bhi. RSI 21 comparatively smooth aur slow ho sakta hai. Har Loss ke baad RSI Period ya Overbought Threshold change karne se Historical Backtest artificially impressive ban sakti hai, isay Overfitting kehte hain. Ek fixed Method alag Years, Trading Sessions aur Market Conditions mein test karein. Commission/Spread include karein aur Demo Practice se real execution differences note karein.
ENTRY, STOP LOSS AUR TP
Maan lein H1 Demand par Gold reject karti hai, RSI Oversold se recover ho rahi hai, aur M5 completed Bullish Engulfing local Structure ke upar close kar deti hai. Ye possible Buy Analysis hai, guaranteed Signal nahi. Stop Loss actual Rejection Swing ke beyond rakhein, RSI level par nahi. Risk Percent se Lot Calculate aur TP Previous H1 Resistance tak evaluate karein. Agar RR poor hai ya confirmation missing hai to Trade Skip.
HIGH IMPACT NEWS AUR RSI
CPI, NFP aur FOMC par sudden Gold/USD Moves RSI ki values rapidly change kar sakti hain. Falling News Candle mein RSI 20 par ho to bhi market aur neeche ja sakti hai. Wide Spread aur Slippage orders ko affect kar sakti hain. Indicator economic surprise ka independent prediction tool nahi. Agar aapki Strategy News Avoid karti hai to RSI Oversold hone ke bawajood entry avoid karein.
RSI DIVERGENCE AUR MARKET STRUCTURE SAME NAHI
Gold Price H1 par Lower Low banaye aur RSI corresponding Higher Low show kare to Bullish Divergence possible hai. Lekin Price abhi bhi actual Lower Low form kar chuki hai. Agar important Lower High ke upar completed close nahi aayi to bearish Structure technically intact ho sakti hai. Sirf RSI line upward hone par Buy lena reversal anticipate karna hai, confirmed reversal nahi. M5 CHoCH, H1 Demand aur proper Swing Low Invalidation help kar sakte hain. SL kisi oscillator number ke neeche nahi, actual chart structure ke beyond plan karein.
RSI FAILURE SWING KYA HAI?
Wilder ke RSI Framework mein Failure Swing concept bhi discuss hota hai. Ek possible Bullish RSI Failure Swing mein Oscillator Oversold Region se recover kare, phir pullback mein new RSI Low na banaye aur baad mein previous RSI Peak break kare. Ye Momentum Improvement ka indication ho sakta hai. Lekin iska matlab guaranteed H1 Demand Hold nahi. Bearish Failure Swing upper range ke around opposite behavior de sakta hai. Swing Levels aur Completed RSI Values clearly define karein. Winning screenshots ko retrospectively patterns assign karna proper Backtesting nahi.
RSI BULLISH RANGE VS BEARISH RANGE
Kuch traders observe karte hain ke strong Uptrend ke dauran RSI comparatively higher bands mein fluctuate karti hai aur Downtrend mein lower bands. H4 Bullish Phase mein RSI Pullback 40 ke qareeb hold kar sakti hai, jabke bearish phase mein 50/60 ke qareeb momentum reject ho sakta hai. Lekin ye Fixed Universal Limits nahi. Symbol, Timeframe aur Current Volatility ke mutabiq readings change hoti hain. H4 HH/HL ke context ke baghair 'RSI 40 = weak market' conclude karna oversimplification hai.
COMPLETE RSI BUY JOURNAL EXAMPLE
Maan lein EUR/USD H4 Uptrend mein hai aur H1 Demand par pullback karti hai. M15 RSI 40 ke around ja kar upward recover hoti hai. M5 par completed Bullish Engulfing local Resistance ke upar close deti hai. Possible Buy Setup mein SL meaningful rejection low ke beyond aur Target previous H1 High ho sakta hai. Agar logical SL 30 Pips magar next Resistance sirf 12 Pips upar hai to RR poor hone ki wajah se No Trade sensible hai. Journal mein M15 RSI Closed Reading, actual Spread, H1 Zone aur Candle Close ka time record karein.
RSI AUR MACD KO DOUBLE CONFIRMATION NA SAMJHEIN
RSI, MACD aur EMA teeno Past Price Data par based indicators hain, lekin calculations different. Agar teeno Green/Bullish nazar aayein to ye zaroori nahi teen independent institutional Buying Evidence mil gayin. Ho sakta hai same Bullish Impulse teeno tools reflect kar rahe hon. RSI Momentum Strength, MACD Fast/Slow Average Relationship aur H1 Demand Historical Reaction Area ko separate roles dein. Zyada Indicators ka matlab automatically zyada accurate setup nahi.
RSI BACKTEST CHECKLIST
RSI Period 14 ya 7? Input Close? Overbought/Oversold Threshold? Divergence sirf Confirmed Swing par? H4 Trend Filter? M5 Engulfing Close ya CHoCH? Stop Loss Swing ke beyond ya fixed? TP Opposing Zone ya Fixed RR? Economic News allowed? Ye sab rules pehle likhein. Har matching setup include karein, including losing trades aur signals jo trade nahi hue. Commissions aur Slippage consider karein. Ek hi cheez badal kar Results compare karein taa ke Overfitting ka risk kam ho.
PIPSEPAISA FREE COURSES
Sir Sajid Khan Ghori ke Free Forex Technical Analysis Course mein Chart Structure, Price Action, Indicators aur Trading Confirmation seekhein. Sir Ghulam Abbas ka Free Forex Fundamental Analysis Course Gold/Forex ke Economic Data aur Central-Bank context ko samajhne mein help kar sakta hai. Enrollment ke liye www.pipsepaisa.com ke Courses Tab mein instructions follow karein. Education profit guarantee nahi.
CONCLUSION AUR RISK DISCLAIMER
RSI past Price Movement ke bullish/bearish momentum ka Indicator hai. RSI 70/30 Levels, 50 Midline aur Divergences ko automatic Buy/Sell Buttons na samjhein. Process: H4 Trend → H1 Level → RSI Momentum → Completed M5 Confirmation → Structural SL → Controlled Lot. No Confirmation = No Trade. Ye Educational Guide hai, personal Financial Advice nahi. Leverage se Capital Loss ka risk hai.
Educational content only. Trading involves risk. Always use independent analysis and appropriate risk management.