
Support and Resistance in Forex: Levels, Zones, Breakouts and Retests
PipSePaisa • Forex Education & Research
INTRODUCTION
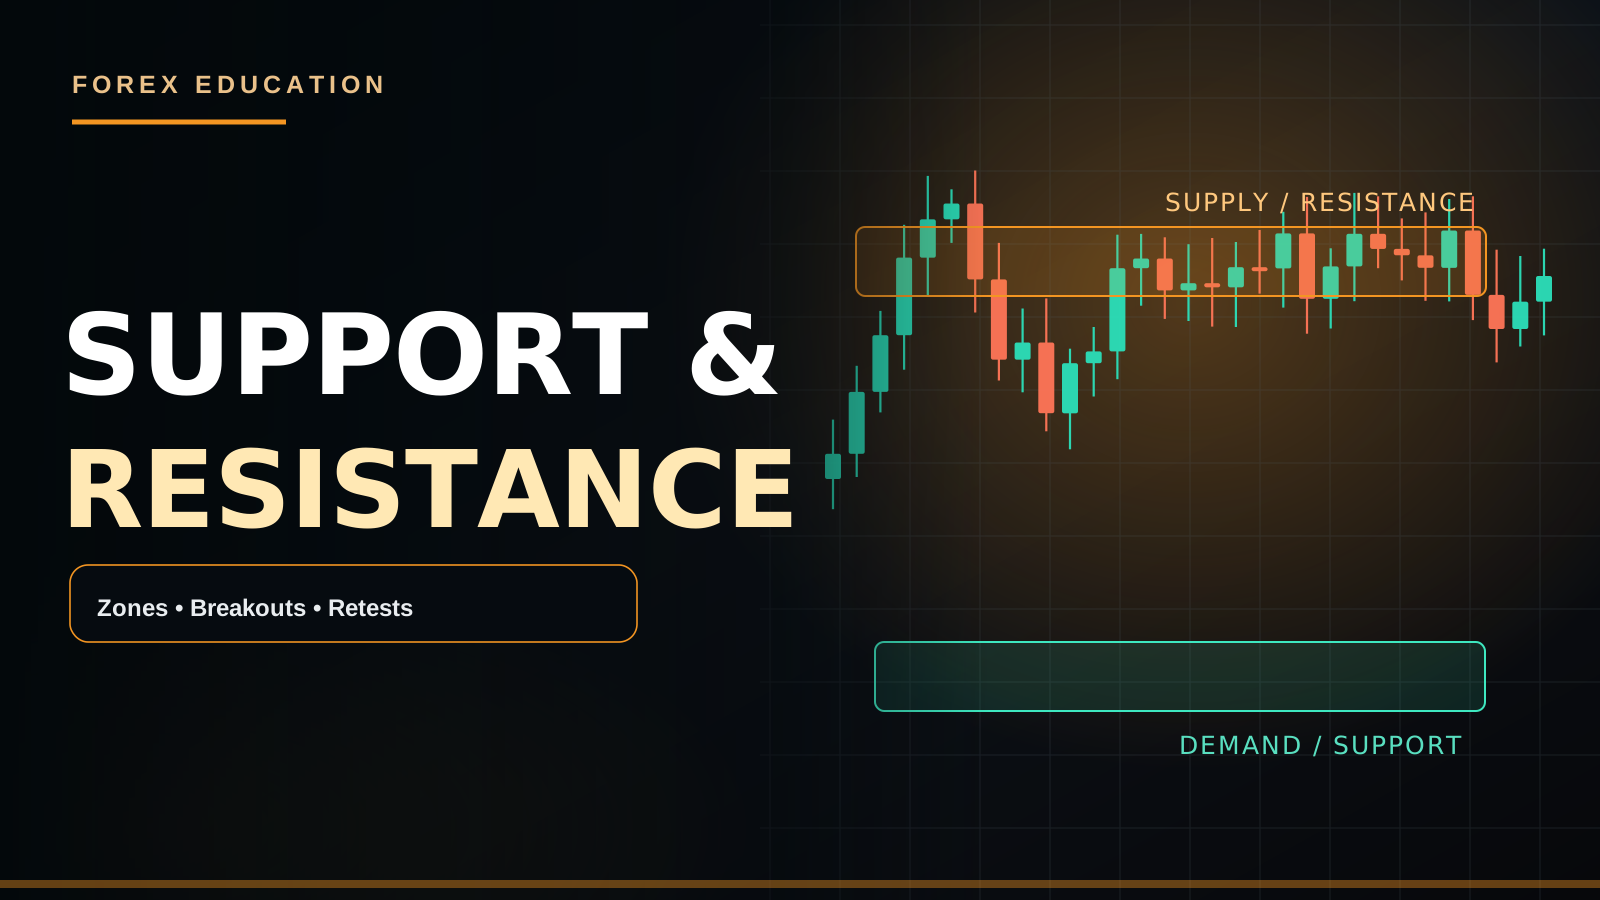
Support is an area where buying interest has previously slowed a decline; resistance is an area where selling interest has previously slowed an advance. Neither is an invisible wall. The practical task is to assess where a reaction might occur, how convincing that reaction is and at which point the idea becomes invalid.
1. FIND MEANINGFUL AREAS
Start on a higher timeframe such as H4 or H1. Mark repeated swing highs and lows, prior consolidations and zones where price decisively departed. Prefer a small band that captures several reactions over a single exact quote. A level that was significant last week can weaken after repeated testing and changes in fundamentals.
2. DISTINGUISH A TOUCH FROM CONFIRMATION
Price entering a support zone is an observation, not a buy signal. Possible confirmation includes a rejection followed by a candle close, a change in lower-timeframe structure or a successful retest after a break. Evaluate candle size, liquidity conditions and whether the trade would be directly against an established trend.
3. BREAKOUT AND RETEST FRAMEWORK
Imagine EUR/USD has repeatedly stalled between 1.0980 and 1.1000. A candle closes above 1.1000, then a pullback holds near the previous resistance area. A trader could watch for a higher low and renewed bullish momentum. If price quickly closes back inside the range, the breakout thesis weakens. The exact levels here are illustrations, not live signals.
4. PLAN RISK AND REWARD
For a hypothetical bullish rejection from 1.0980–1.1000, invalidation may lie beyond the actual swing low—not at an arbitrary five-pip distance. Calculate whether the next opposing zone leaves enough room for your planned reward relative to the stop. Factor spread and price gaps into the decision.
5. LEVEL QUALITY CHECKLIST
Ask: How many meaningful reactions happened? Was price trending or ranging? Has the zone already been consumed by repeated tests? Is a high-impact economic release imminent? Does the lower-timeframe candle genuinely close beyond the trigger? Multiple factors increase context but never guarantee a bounce.
COMMON ERRORS
Drawing dozens of lines, treating one wick as a breakout, placing a stop exactly at an obvious round number without context, and repeatedly fading a strong trend often cause poor decisions.
FAQ
Do support and resistance switch roles? Sometimes a broken resistance becomes support on a retest, but it is not automatic. Which timeframe is best? Higher timeframes often provide context; lower timeframes can refine timing but create more noise.
SUPPORT AND RESISTANCE ARE PRICE AREAS
If support is drawn at 100, buyers may appear between 98 and 100 rather than precisely at 100. A zone should capture the meaningful range of previous reactions while remaining narrow enough for useful invalidation. A line alone is a reference, not a prediction. Use H4 and H1 swings before adding noisy lower-timeframe details.
HOW A LEVEL IS FORMED
Repeated buying near a region may create an observable support area, while repeated selling around prior highs creates possible resistance. Traders watch these areas, but repeated tests can weaken them. Previous day highs/lows and session extremes may also attract stop orders and breakout orders. A visible price pattern does not prove hidden order inventory.
THREE DIFFERENT REACTIONS
A rejection may include a wick through resistance followed by a close back below it. A genuine breakout may close decisively above resistance and then build a higher low. A liquidity sweep may move briefly beyond an old high, trigger some orders and return inside the earlier range. Do not treat these outcomes as identical. Confirmation requires observing how price behaves after the level is touched.
BREAKOUT AND RETEST EXAMPLE
Suppose EUR/USD repeatedly stalls near 1.1000. A candle closes beyond 1.1000 and price returns to 1.0995–1.1000. If an M5 higher low forms and price reclaims the area, a continuation scenario becomes plausible. If price falls back into the prior range and fails to reclaim the boundary, the breakout thesis weakens. Levels are illustrative.
ENTRY, SL AND TARGET
First mark H1 support/resistance. Second check the H4 direction. Third wait for a completed M5/M15 confirmation. Fourth place invalidation beyond the relevant swing, not exactly on an obvious horizontal line. Fifth calculate position size from the permitted loss. Finally check that the opposing zone allows sufficient reward. A perfect reaction with poor risk-to-reward can still be a bad trade.
NEWS AND COMMON ERRORS
CPI or NFP may push price straight through a historical level with slippage and wide spreads. Avoid buying every support touch, drawing excessive lines, moving levels after entry or assuming the fifth touch must reverse. Waiting is a legitimate strategy decision.
FAQ
Can broken resistance become support? Sometimes, but only price behavior can confirm it. Are round numbers guaranteed levels? No. Is a completed candle important? It avoids reading an unfinished shape as final.
STATIC LEVELS, DYNAMIC LEVELS AND THEIR DIFFERENCE
Static support and resistance come from recognizable horizontal price areas such as old swing lows and highs, previous-day extremes or consolidation boundaries. Dynamic references change over time: rising trendlines and moving averages are common examples. Horizontal structure is directly tied to known historical transactions; a moving average is a calculation over selected prices. Neither forces an order to execute. Distinguish the type before saying price "respected support."
A CONSISTENT DRAWING METHOD
On H4, highlight two or three significant reactions, then move to H1 to refine the overlapping band. Note whether wicks or candle closes formed the major boundary. A practical zone might span 1.0980–1.1000 rather than 1.1000 alone. Do not expand the zone indefinitely until every subsequent loss appears to have occurred "inside" it. The area needs a defined upper edge, lower edge and invalidation rule. Very wide areas might require smaller volume or no trade.
THE DIFFERENCE BETWEEN WEAK AND STRONG REACTIONS
A sharp reversal with follow-through may deserve more attention than a tiny pause followed immediately by continuation. But apparent reaction strength depends on volatility, trend, spread and current news. Three quick tests in a single hour do not necessarily have the same significance as reactions spread across several days. Treat level quality as a checklist, not a single magic score. Test your personal definition on historical charts rather than adding new criteria only after losses.
SUPPORT THAT FAILS IS USEFUL INFORMATION
Suppose price approached demand around 1.0980–1.1000, produced a weak wick, then closed clearly below 1.0980. The absence of support is itself new information. A trader might wait to see whether the old zone becomes resistance on retest or whether price regains it. Repeatedly buying each lower tick because the prior price was "cheap" converts a conditional level into an uncontrolled averaging strategy.
FALSE BREAKS AND SWINGS
Consider an H1 previous high at 1.1050. Price trades to 1.1060 but closes the candle at 1.1042. The move may have been a temporary liquidity sweep. Yet if the next candles build higher lows above 1.1050, the earlier wick is no longer adequate evidence for a bearish scenario. Follow-through matters more than attaching a label after one bar. Distinguish an M5 failed break from an actual H4 structural reversal.
BREAKOUT RETEST AS AN OBSERVABLE STRATEGY
First, require a meaningful H1 boundary. Second, wait for a completed close beyond it. Third, observe whether a pullback holds near the previous boundary. Fourth, seek a lower-timeframe structural trigger. Fifth, place invalidation beyond the retest swing and evaluate distance to the next opposing zone. If retest does not occur, the conservative strategy may simply miss a move. Do not chase a late breakout merely to avoid missing out.
SUPPORT, RESISTANCE AND TREND DIRECTION
In an established uptrend, demand around a prior higher low may align with bullish continuation. A resistance rejection within that uptrend can instead be a temporary pause. In a downtrend, rallies toward former support that now acts as resistance may be relevant. But a central-bank surprise can invalidate the scenario rapidly. A level never overrules material new information.
HOW TO PLACE THE STOP AND TARGET
If a long entry is triggered after a completed rejection from an H1 support band, a stop might sit beyond the actual structural rejection low. Then choose a target near prior resistance, taking spread and commissions into account. If the target is only 15 pips away while structural risk is 30 pips, a trader needs evidence that such low reward relative to risk fits the tested system. A superficially accurate level is not automatically a worthwhile trade.
QUIZ AND SELF-REVIEW
When price touches a line but M5 has not closed, is there confirmation? No. When resistance is broken, must it become support? No. Does a high-impact NFP release respect old levels? Not necessarily. Can a level remain relevant without giving a trade? Yes. Keep a screenshot of every marked band before the market arrives so your performance review is honest.
CONCLUSION
Think in probabilities and zones. Mark context, wait for evidence, define invalidation and avoid early entries.
CONTINUE LEARNING WITH PIPSEPAISA
Free Forex Technical Analysis Course — Sir Sajid Khan Ghori. Want to join? Message our team on WhatsApp or visit the Courses tab at www.pipsepaisa.com to enroll.
Free Forex Fundamental Analysis Course — Sir Ghulam Abbas. Want to join? Message our team on WhatsApp or visit the Courses tab at www.pipsepaisa.com to enroll.
EDUCATIONAL RISK NOTICE
Examples are hypothetical, not live signals or personal financial advice. Leveraged trading carries substantial risk, including loss of capital.
Read in Roman Urdu
INTRODUCTION
Support woh area hai jahan pehle buyers ne girti price ko slow kiya tha. Resistance woh area hai jahan sellers ne rising price ko rokne ki koshish ki thi. Ye exact guaranteed reversal points nahi hote; aksar ek price zone hota hai.
1. LEVELS KAISE MARK KAREIN
H4 ya H1 par clear swing highs, swing lows aur consolidation areas dekhein. Jahan se strong movement start hui ho us range ko mark karein. Sirf ek patli line ke bajaye meaningful zone identify karein. Bar-bar test hone se level ki reliability change ho sakti hai.
2. CONFIRMATION KYUN ZAROORI HAI
Price support par aa gayi to Buy lazmi nahi. Rejection candle ka close, M5/M15 structure shift ya breakout ke baad retest useful clues ho sakte hain. Trend aur news ko ignore na karein.
3. BREAKOUT RETEST EXAMPLE
Maan lein EUR/USD 1.0980 se 1.1000 ke darmiyan range mein hai. Candle 1.1000 ke upar close hoti hai, phir retest par buyers defend karte hain. Higher low milne par bullish scenario consider ho sakta hai. Agar price dobara range ke andar close kare to breakout weak hai. Ye sirf educational example hai.
4. STOP LOSS AUR TARGET
Stop ko actual invalidation swing ke beyond plan karein. Next resistance tak distance check karein. Agar reward ke muqablay risk bohat zyada hai to trade skip karna behtar ho sakta hai.
5. QUALITY CHECKLIST
Kya level clear hai? Kitni meaningful reactions aayi hain? Market range hai ya trend? Kya important economic news qareeb hai? Entry candle close hui hai ya abhi ban rahi hai?
COMMON MISTAKES
Bohat sari lines banana, wick ko confirmed breakout samajhna aur har touch par entry lena avoid karein.
FAQ
Kya broken resistance support ban sakti hai? Kabhi kabhi, lekin hamesha nahi. Best timeframe? H4/H1 se context aur lower timeframe se entry timing mil sakti hai.
SUPPORT AUR RESISTANCE EXACT LINE NAHI
Agar 100 par Support line hai, zaroori nahi price 100 se hi upar reverse kare. Buyers 98–100 ke area mein active ho sakte hain. Isi liye meaningful reaction area ko zone ki surat mein mark karein. H4/H1 ke swings dekhein aur chart par bohat zyada random lines na lagayein. Line ek reference hai, guaranteed reversal nahi.
LEVEL KAISE BANTA HAI?
Jab historical price kisi area se repeatedly bounce kare to Support possible hoti hai. Repeated selling area Resistance ban sakta hai. Lekin jitni baar level test ho, utni baar hold ki guarantee nahi. Previous Day High/Low aur session extremes par stop ya breakout orders ho sakte hain, lekin exact hidden orders chart se prove nahi hotay.
REJECTION, BREAKOUT, LIQUIDITY SWEEP
Rejection mein wick resistance ke upar ja sakti hai lekin candle neeche close karti hai. Genuine breakout mein candle zone se bahar close ho kar new structure banati hai. Liquidity Sweep mein price old high/low cross karke range mein return kar sakti hai. Har wick ko breakout aur har breakout ko reversal mat samjhein.
BREAKOUT RETEST EXAMPLE
Maan lein EUR/USD 1.1000 ke neeche bar-bar reject hoti hai. Phir candle 1.1000 ke upar close kare aur price 1.0995–1.1000 retest kare. M5 par Higher Low aur bullish close aaye to possible continuation evaluate ho sakti hai. Agar price range ke andar wapas close kare to breakout idea weak hai. Ye live trading signal nahi.
ENTRY KE 6 STEPS
H1 level mark karein; H4 bias check karein; M5/M15 completed confirmation ka wait karein; actual structural invalidation mark karein; us distance ke mutabiq lot size calculate karein; nearest opposing zone tak target space check karein. Agar RR poor hai to trade skip karein. Sirf level hit hone se entry nahi.
NEWS AUR MISTAKES
CPI/NFP ke waqt historical level direct break ho sakta hai, spread aur slippage bhi barh sakti hai. Har touch par order, dozens of lines, aur losing trade ke baad level shift karna avoid karein.
FAQ
Broken Resistance Support ban sakti hai? Kabhi, guarantee nahi. Round number hamesha hold? Nahi. Candle close important? Haan, unfinished candle shape change kar sakti hai.
HORIZONTAL AUR DYNAMIC LEVELS
Support/Resistance ki do common forms hoti hain. Static Level purane Swing High, Swing Low, Previous Day High/Low ya consolidation se mark hoti hai. Dynamic Support/Resistance mein Moving Average ya Trendline jaisay references ho sakte hain jo waqt ke saath move karte hain. Moving Average ek calculation hai, koi hidden wall nahi. Price us reference ke around react kar sakti hai ya easily break bhi kar sakti hai. Dono ko ek hi cheez samajh kar guaranteed Bounce na expect karein.
ZONE DRAW KARNE KA CONSISTENT METHOD
Pehle H4 chart par do ya teen significant market reactions identify karein. Phir H1 par unka overlapping area refine karein. Dekhein actual level Wick se define ho raha hai ya Candle Body close se. Example mein 1.0980–1.1000 ek possible Support Zone ho sakta hai; sirf 1.1000 ki exact line nahi. Zone ko itna wide na karein ke har losing trade baad mein usi ke andar fit ho jaye. Upar aur neeche boundaries clear rakhein. Wide zone ke saath structural SL wide ho sakta hai, is liye lot size adjust ya trade skip karna hoga.
REACTION KI QUALITY KAISE JUDGE KAREIN?
Agar price kisi area se sharp rejection de aur multiple candles us direction mein follow-through dein to response meaningful ho sakta hai. Lekin volatility aur market condition important hai. Ek ghante mein teen chhoti wick reactions aur teen different days ke strong reversal swings same weight nahi rakhte. Trend Direction, News Calendar, Zone ki Freshness aur Nearby Opposition dekhein. '3 touches = guaranteed breakout' ya '5 touches = guaranteed hold' jaisa rule mat banayein.
SUPPORT FAIL HONE PAR KYA KAREIN?
Maan lein H1 Support 1.0980–1.1000 hai. Price weak wick banati hai, phir 1.0980 se neeche strong Candle Close deti hai. Ye batata hai ke historical buying area current situation mein defend nahi hui. Aap wait kar sakte hain ke kya price old Support ko neeche se retest kar ke Resistance bana rahi hai, ya dobara level reclaim hota hai. Har lower price par Buy add karna sirf is liye ke 'pehle Support thi' dangerous averaging ban sakti hai.
LIQUIDITY SWEEP VS GENUINE BREAK
Agar H1 previous high 1.1050 hai aur price 1.1060 tak wick de kar candle 1.1042 par close kare, to possible Liquidity Sweep hai. Lekin agar aglay candles level ke upar Higher Lows banayein to breakout scenario stronger ho sakta hai. Sirf ek wick dekh kar pakka Sell decide nahi karna. M5 par false break aur H4 par important structural reversal ko alag weight dein.
BREAKOUT RETEST STRATEGY STEP BY STEP
Pehla step H1 par relevant boundary mark karna. Second step completed candle close beyond zone. Third step price ke former boundary ke qareeb retest ka wait. Fourth step M5/M15 par CHoCH, rejection ya other clear trigger. Fifth step retest swing ke beyond Stop Loss aur nearest opposing zone tak potential target. Agar retest na mile to conservative strategy trade miss kar sakti hai, lekin rule tod kar late entry lena theek nahi. Missed Trade account loss nahi.
TREND KE SAATH SUPPORT RESISTANCE
Strong H4 uptrend mein Previous Higher Low aur Demand Zone se bullish response possible hai. Lekin usi uptrend mein H1 Resistance par temporary selling bhi mil sakti hai. Downtrend mein purana broken Support kabhi retest par Resistance act kar sakta hai. Isay Market Structure ke context mein dekhein. Fed, CPI ya NFP ki surprise information technical scenario ko rapidly change kar sakti hai.
STOP LOSS AUR TARGET KA REAL PLAN
H1 Support rejection ke baad Buy setup mile to Stop Loss relevant swing low ke beyond plan karein. TP old Resistance ya next opposing Supply ke qareeb evaluate karein. Agar logical SL 30 pips ho aur next resistance 15 pips away ho, to Risk/Reward weak hai. Sirf correct Support identify kar lena sufficient nahi; good trade ke liye suitable Entry, SL, TP, Spread aur probability context bhi chahiye.
SELF-CHECK QUESTIONS
Price level touch hui lekin M5 close nahi? Abhi setup confirmation incomplete. Resistance break hui to kya hamesha Support? Nahi. High impact NFP level ko respect karegi? Guarantee nahi. Kya strong Support dekh kar bhi trade skip kar sakte hain? Bilkul. Chart level mark karte waqt before-and-after screenshots rakhein taa ke baad mein levels retrospectively adjust na hon.
LEVEL KI VALIDITY KAB KHATAM HOTI HAI?
Support/Resistance permanent lines nahi. Strong New Economic Data, Market Trend Shift aur repeated break/retests se historical level ki relevance change ho sakti hai. Agar H1 Support ka full Zone decisively break ho jaye aur price neeche hold kare, to usay purana guaranteed Buy Level samajh kar baar baar trade na lein. Broken Support retest par Resistance act kar sakti hai, lekin is role-reversal ko bhi completed candles se confirm karein. Har Session ke start par major zones revisit karein aur reason ke baghair drawings change na karein.
TARGET SPACE IMPORTANT HAI
Maan lein Support par M5 bullish engulfing close mil gayi, lekin next Resistance bas 12 Pips upar hai aur logical SL 25 Pips hai. Setup price reaction show kar rahi ho sakti hai, lekin planned risk ke muqablay reward limited hai. Is liye 'Level successful' aur 'Trade financially sensible' same baat nahi.
CONCLUSION
Support aur Resistance mein sab se important cheez context, confirmation, invalidation aur risk management hai.
PIPSEPAISA KE FREE COURSES
Sir Sajid Khan Ghori ka Free Forex Technical Analysis Course join karna hai? PipSePaisa team ko WhatsApp par message karein ya www.pipsepaisa.com ke Courses tab se enroll karein.
Sir Ghulam Abbas ka Free Forex Fundamental Analysis Course join karna hai? WhatsApp par message karein ya Courses tab se enrollment karein.
RISK DISCLAIMER
Ye examples sirf education ke liye hain, live signals ya personal financial advice nahi. Leveraged trading mein capital lose ho sakta hai.
Educational content only. Trading involves risk. Always use independent analysis and appropriate risk management.