
Breakout vs Fakeout Trading: Confirmation, Volume and Retest Rules
PipSePaisa • Forex Education & Research
INTRODUCTION
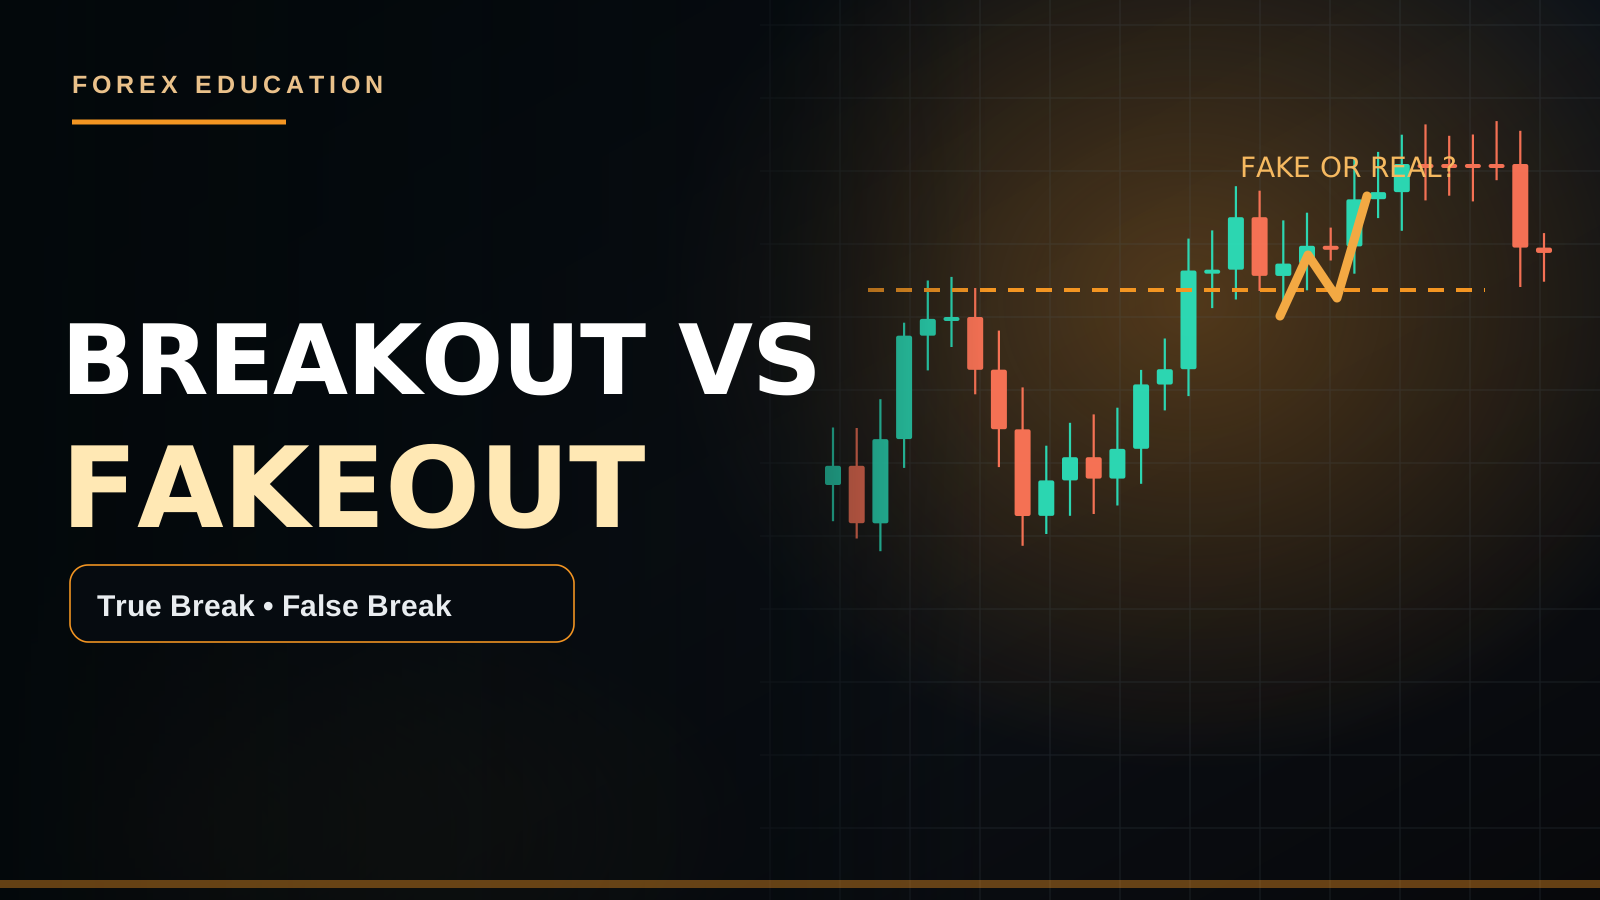
A breakout occurs when price moves beyond a recognized range or key structure level. A fakeout, or false breakout, occurs when price briefly moves through that area but fails to sustain the move and returns inside. Both are normal market outcomes; no single indicator can perfectly distinguish them in advance.
1. DEFINE THE RANGE
Identify at least two meaningful reactions around a boundary on H1 or H4. Draw an area rather than relying solely on an exact decimal. Distinguish a breakout of a minor intraday candle from one that changes significant market structure.
2. REQUIRE A COMPLETED CLOSE
A candle wick above resistance does not automatically validate a bullish breakout. A close outside the zone is stronger evidence, especially if it is decisive relative to recent candle ranges. Very large candles may nevertheless leave unattractive risk-to-reward if chased.
3. WATCH FOR RETEST BEHAVIOR
After a bullish breakout, price may revisit the former resistance area and hold above it. A clear higher low and renewed buying can strengthen continuation bias. If price rapidly closes back below the broken level and retest fails, it may be a fakeout.
4. VOLUME AND VOLATILITY
In centralized exchange products, volume expansion can add context to breakout quality. Spot FX volume is fragmented; a platform's tick volume is not a complete measure of global market activity. During high-impact news, volatility spikes can produce both genuine breaks and rapid reversals.
5. EDUCATIONAL SETUP
Assume GBP/USD trades between 1.2700 and 1.2740. An M15 candle closes above 1.2740, then a pullback holds near 1.2735–1.2740. A possible continuation setup would still require an entry trigger, SL under relevant structure and enough space to a target. If the price closes back into the range, the thesis weakens.
6. FAILURE PATTERNS
Failed breakouts often appear around obvious round-number liquidity, at the wrong side of higher-timeframe supply/demand or just before economic releases. Avoid using breakout as a synonym for certainty.
FAQ
Is a retest guaranteed? No; valid breakouts sometimes continue without one. Does a fakeout always reverse far? No; price may simply return to consolidation.
THE DIFFERENCE BETWEEN A BREAK AND A FALSE BREAK
A breakout means price moves beyond a recognized area and may establish acceptance on the other side. A fakeout means price goes beyond a boundary but fails to sustain that move. In real time you cannot know with certainty which it is; confirmation is evidence that accumulates through completed candles and follow-through.
START WITH A MEANINGFUL RANGE
Identify at least two H1 or H4 swing reactions around support and resistance. A single M1 candle high rarely carries the same context as a prior-day range boundary. Mark a band instead of an infinitely precise line, and check whether the area overlaps higher-timeframe Supply or Demand.
WICK BREAK VS CANDLE CLOSE
A wick above 1.1000 may be a stop sweep, while an H1 candle closing firmly beyond it offers stronger breakout evidence. A large candle still may be extended, giving poor entry economics. Always consider where the Stop Loss would go and how far the next opposing zone is.
RETEST METHOD
If EUR/USD closes above an H1 resistance band, a pullback into the band that holds and forms a lower-timeframe higher low may support a continuation scenario. If price quickly closes back inside and retests the underside unsuccessfully, the earlier breakout may have been false. Waiting can reduce hasty trades but may miss moves that do not retest.
VOLUME AND ORDER FLOW LIMITATIONS
In centralized futures, reported volume offers information about actual exchange trading. In spot forex, platform tick volume measures price-update activity rather than total worldwide FX volume. A volume spike can provide context but cannot perfectly distinguish legitimate breakouts from fakeouts.
BUY AND SELL CHECKLIST
Define the boundary. Wait for a completed candle beyond it. Assess higher-timeframe trend and nearby opposing zones. On retest, look for M5/M15 structural confirmation. Place the stop beyond the relevant swing and calculate volume from planned risk. Do not chase a breakout if price is already near the next opposing level.
FAQ
Are retests compulsory? No. Does every fakeout create a full reversal? No, it can return to range. Can CPI/NFP create false-looking moves? Yes, volatility may be extreme.
DEFINE THE RANGE BEFORE IT BREAKS
A breakout is meaningful only relative to a clear reference boundary. Mark an H1 or H4 consolidation with repeated swing reactions. If price has barely traded around a random candle high, a move of two pips through it has little value as a major breakout signal. A good pre-breakout drawing includes the upper and lower boundaries, an estimate of normal volatility and the next opposing Supply/Demand area. Draw the range before the candle breaks it to reduce hindsight bias.
THE DIFFERENCE BETWEEN WICK AND ACCEPTANCE
Suppose resistance is 1.1000. Price trades momentarily to 1.1008 but closes back at 1.0994. This could be a failed break or liquidity sweep. If price closes above 1.1000 and subsequent candles hold above it with higher lows, a genuine breakout interpretation becomes more plausible. Neither behavior proves what every institution did. Market acceptance is inferred from sustained trading and structure, not a single print beyond a line.
BREAKOUT WITHOUT RETEST
Some strong moves continue after a decisive candle closes outside a range without revisiting the old boundary. A conservative retest-based trader can miss those moves. This is not necessarily a strategy defect; every entry method trades off frequency, price quality and confirmation. Chasing an extended move just to participate can create poor reward-to-risk when the next resistance is already close.
BREAKOUT RETEST STRATEGY
First confirm the H1 boundary using multiple reactions. Second require a completed candle close beyond it. Third wait for a pullback. Fourth check whether the old boundary holds as a possible role-reversal level. Fifth seek M5/M15 confirmation, such as a higher low and bullish close after an upside break. Sixth place Stop Loss beyond the retest structure. Seventh compare target room with planned risk and costs.
A FAKEOUT STRATEGY IS DIFFERENT
A failed-breakout trader may watch price sweep an old high, close back inside and then break a local M5 low. This does not imply the market will collapse; it may simply return to the range midpoint. Stops and targets should reflect the actual failed-break geometry. Shorting every upper wick without waiting for failure confirmation can lead to repeated losses during a sustained uptrend.
VOLUME: CENTRALIZED VS SPOT DATA
An exchange-traded futures contract provides volume for trades on that exchange. Retail spot Forex is decentralized, and a broker's tick volume usually counts price changes or quote activity rather than worldwide total traded units. A spike in tick volume can reflect increased activity without proving that a bullish breakout is institutionally supported. Any volume threshold should be defined and tested using the same data source.
FALSE BREAKS AND NEWS
A large CPI or NFP surprise can carry price beyond multiple levels and then reverse when other report components become known. News-related spreads and slippage make tight breakout stops vulnerable. Some strategies explicitly exclude minutes around a major release and trade only after a new range forms. A supposedly clean breakout that occurs when the market is extremely illiquid deserves extra scrutiny.
A SELL BREAKOUT CASE STUDY
Imagine GBP/USD ranges from 1.2700 to 1.2740. An M15 candle closes below 1.2700, and a later retracement stalls near 1.2700 with a lower high. A possible short continuation setup may emerge if M5 confirms lower structure. Place invalidation beyond the meaningful retest high rather than automatically exactly five pips above 1.2700. Next support determines potential target room.
A BUY FAKEOUT CASE STUDY
Assume price breaks beneath H1 support 1.0980, briefly trades to 1.0972, then closes back above 1.0980. If a later M5 bullish CHoCH occurs, the trader may evaluate a failed-break scenario. But if H4 is in a strong downtrend and an NFP release just strengthened USD, the price may break lower again. Confirmation is a conditional clue, not certainty.
SYSTEMATIC BACKTEST QUESTIONS
Do you require a body close outside the entire zone? How long can price take to retest? What invalidates the breakout if it never retests? What volume metric is used? Are CPI/NFP releases excluded? Do you take only direction-aligned trades? What target selection method is used? Answer these questions before collecting performance numbers.
FAQ
Is every breakout with a retest reliable? No. Can a breakout succeed without higher volume? Yes. Does a fakeout have to reverse to the other side of the range? No. Can a Buy Limit substitute for a Buy Stop in breakout trading? No, they express different execution ideas.
CONCLUSION
Mark a meaningful boundary, distinguish wick from close, evaluate retest and broader context, and size every attempt as a trade that could fail.
PIPSEPAISA FREE COURSES
Sir Sajid Khan Ghori — Free Forex Technical Analysis Course. Want to join? Message the PipSePaisa team on WhatsApp or open the Courses tab at www.pipsepaisa.com for enrollment.
Sir Ghulam Abbas — Free Forex Fundamental Analysis Course. Message on WhatsApp or visit the Courses tab to enroll.
RISK NOTICE
Educational examples are hypothetical; leveraged trading can cause capital loss. Not financial advice.
Read in Roman Urdu
INTRODUCTION
Breakout tab hota hai jab price important range ya structure se bahar nikalti hai. Fakeout mein price temporarily bahar jati hai aur wapas range mein aa jati hai. Dono possibilities normal hain.
1. RANGE MARK KAREIN
H1/H4 par support aur resistance ki meaningful reactions dekhein. Exact line ke bajaye zone banayein. Chhoti candle ka break aur major structure break same nahi hote.
2. CANDLE CLOSE
Sirf wick resistance ke upar chali jaye to breakout confirm nahi. Zone se bahar completed candle close stronger clue hai. Lekin huge breakout candle chase karna poor RR de sakta hai.
3. RETEST
Break ke baad price former resistance par wapas aa kar higher low banaye to continuation ka clue mil sakta hai. Agar candle wapas range ke andar close ho jaye to breakout weak ho sakta hai.
4. VOLUME AUR NEWS
Exchange market ka volume context de sakta hai. Spot Forex tick volume pure global volume ka measure nahi. High-impact news par false moves aur slippage barh sakti hain.
5. EXAMPLE
GBP/USD 1.2700–1.2740 range mein ho. M15 candle 1.2740 ke upar close kare aur retest 1.2735–1.2740 ke paas hold ho. Entry se pehle SL aur TP ka distance check karein. Wapas range mein close aaye to idea fail ho sakta hai.
6. MISTAKES
Har wick break par entry, news ignore karna aur nearby higher-timeframe supply ko miss karna avoid karein.
FAQ
Kya har breakout retest deta hai? Nahi. Kya fakeout se hamesha big reversal hota hai? Nahi.
BREAKOUT AUR FAKEOUT MEIN FARQ
Breakout tab hota hai jab price important Support/Resistance se bahar move kar ke wahan sustain kare. Fakeout mein price boundary cross kar ke jaldi wapas range ke andar aa jati hai. Real time mein 100% sure hona possible nahi; candle close aur follow-through evidence provide karte hain.
MEANINGFUL RANGE MARK KAREIN
H1/H4 par do ya zyada important reactions se boundary identify karein. Random M1 candle high ko previous-day major high jaisi importance na dein. Exact line ke bajaye zone mark karein aur higher-timeframe Supply/Demand bhi check karein.
WICK AUR COMPLETED CLOSE
1.1000 resistance ke upar sirf Wick aa kar wapas neeche ho to sweep ya fakeout possibility ho sakti hai. H1 candle strong close de to genuine breakout ki evidence zyada hai. Lekin bohat giant candle chase karne se SL aur RR poor ho sakta hai.
RETEST METHOD
EUR/USD H1 Resistance ke upar close de, phir same area retest kare. M5/M15 Higher Low aur bullish confirmation milay to continuation evaluate kar sakte hain. Agar price range ke andar wapas close ho aur level regain na kare to breakout thesis weak hai. Retest ka wait karne se kuch genuine moves miss bhi ho sakti hain.
VOLUME KI LIMITATION
Futures market ka volume actual exchange trading show kar sakta hai. Spot Forex mein Tick Volume global total volume nahi hota. Volume spike extra clue hai, guaranteed fakeout filter nahi.
STEP-BY-STEP CHECKLIST
Boundary mark, candle close wait, H4 bias check, nearest opposing zone observe, M5 retest confirmation dekhein, logical SL aur lot calculate karein. Agar price target ke paas already pohanch gayi hai to trade chase na karein.
FAQ
Kya har breakout retest dega? Nahi. Har fakeout major reversal? Nahi, range mein return bhi ho sakta hai. CPI/NFP par confusing spikes? Haan.
RANGE BREAK SE PEHLE IDENTIFY KAREIN
Breakout tab meaningful hoti hai jab reference boundary clear ho. H1/H4 par aisi consolidation ya range mark karein jahan multiple meaningful highs/lows bane hon. Random M1 candle high se sirf 2 Pips upar move ko major breakout na samjhein. Zone ki Upper Boundary, Lower Boundary, normal volatility aur nearest opposing Supply/Demand pehle note karein. Price break dene se pehle chart screenshot save karein taa ke baad mein Range ko adjust kar ke perfect na dikhayein.
WICK AUR ACCEPTANCE MEIN FARQ
Maan lein Resistance 1.1000 hai. Price short time 1.1008 tak jati hai lekin candle 1.0994 par wapas close ho. Ye Failed Break ya possible Liquidity Sweep ho sakti hai. Agar candle 1.1000 ke upar close kare aur aglay candles level hold kar ke Higher Lows banayein, genuine Breakout interpretation stronger hoti hai. Koi single Wick ye prove nahi kar sakti ke kis institution ne kya orders place kiye. Sustained candle structure important hai.
RETEST NA MILE TO KYA?
Kuch strong breakouts confirmation close ke baad direct continuation deti hain aur old Resistance/Support par retest nahi karti. Retest strategy wala trader aise moves miss karega. Ye zaroori nahi ke strategy ki mistake ho. Conservative method fewer but clearly defined entries deta hai. Extended candle chase karna poor RR de sakta hai agar nearest opposite zone already qareeb ho. Missed Opportunity account loss nahi.
BREAKOUT RETEST KE 7 STEPS
Step 1 H1 boundary repeated reactions se confirm karein. Step 2 completed Candle Close beyond Zone. Step 3 price ke Pullback ka wait. Step 4 check karein old Resistance possible Support ya old Support possible Resistance act kar raha hai. Step 5 M5/M15 Higher Low/Lower High aur relevant confirmation close dekhein. Step 6 retest swing ke beyond Stop Loss. Step 7 Nearest Opposing Zone tak target distance aur Spread calculate karein. Har step strategy ke rules ka hissa hona chahiye.
FAKEOUT STRATEGY ALAG HAI
Fakeout trader price ke old High ko Sweep karne, range mein wapas close hone aur M5 par bearish structure break ka wait kar sakta hai. Lekin iska matlab guaranteed full reversal nahi; price sirf range midpoint tak return bhi kar sakti hai. Sirf long Upper Wick par blind Sell strong uptrend mein fail ho sakti hai. Stop Loss sweep extreme aur structure ke beyond plan karein.
VOLUME DATA KI LIMITATION
Futures Exchange ka traded Volume us exchange ki transactions count karta hai. Spot Forex decentralized hai; broker ka Tick Volume usually Quotes ya Price Changes ki activity show karta hai, total worldwide Forex lots nahi. High Tick Volume active market ka clue ho sakta hai, lekin institutional breakout guarantee nahi. Agar Volume Filter use karte hain to consistent data source aur numerical criteria se backtest karein.
NEWS AUR FALSE BREAKOUT
CPI ya NFP major price surprise create kar sakti hai. Price multiple H1 levels cross kar sakti hai, phir Wages/Revisions ya Yield Reaction ke baad wapas aa sakti hai. News spreads wide aur slippage serious ho sakti hai. Kuch disciplined strategies major release ke aas paas No Trade rule use karti hain aur stable post-news Range banne ka wait karti hain. Thin Liquidity breakout ko extra caution se evaluate karein.
SELL BREAKOUT EXAMPLE
GBP/USD 1.2700 se 1.2740 ki range banati hai. M15 candle 1.2700 ke neeche complete close de aur retracement mein 1.2700 ke paas Lower High bane. M5 bearish structure confirm kare to possible continuation Sell consider ho sakti hai. SL meaningful retest high ke beyond aur TP next Support ke context mein rakhein. Exact arbitrary 5 Pips stop zaroori nahi.
BUY FAKEOUT EXAMPLE
Price H1 Support 1.0980 ke neeche briefly 1.0972 tak jaye magar phir 1.0980 ke upar close kare. M5 bullish CHoCH mile to failed-break Buy scenario evaluate ho sakta hai. Lekin agar H4 strong bearish aur new NFP data unexpectedly Dollar supportive hai to lower breakout continuation bhi possible hai. Confirmation odds ka clue hai, guarantee nahi.
BACKTEST CHECKLIST
Kya Full Body Close zone ke beyond compulsory hai? Retest kitni candles ke andar accepted hai? Retest miss ho to No Trade? Volume ka exact indicator kya? CPI/NFP News allowed? H4 Trend Filter? Stop aur TP ka calculation? Jab rules fixed honge tab historical results meaningful hongi. Har chart par criteria change karna strategy testing ko invalidate karta hai.
FAQ
Har retest successful? Nahi. Volume high na ho to breakout impossible? Nahi. Fakeout always opposite range boundary tak jati hai? Nahi. Buy Limit aur Buy Stop same trade? Nahi, execution logic different hai.
BREAKOUT KI STRENGTH KO CONSISTENT TAREEQAY SE MEASURE KAREIN
Agar aap H1 Range ka Upper Boundary mark kar rahe hain to pehle decide karein valid Breakout Close Zone se kitna clearly bahar hona chahiye. Kuch Strategies Candle Body ka large portion outside zone require karti hain, jabke kuch simple Close accept karti hain. Ye rule pehle specify karein. Candle Kitni Huge thi? Kya next Supply Zone qareeb hai? Kya Spread normal hai? Kya Retest par price level hold kar rahi hai? Is tarah meaningful breakout aur temporary wick ko distinguish karne ke liye objective conditions develop hoti hain.
FAILED BREAKOUT KE BAAD TARGET
Fakeout Sell mil jaye to guarantee nahi market poori Range cross karegi. Range Midpoint ya opposite Support tak logical target choose kiya ja sakta hai. Agar aapki tested Strategy partial TP use karti hai to weighted results correctly note karein. Stop Sweep Extreme ke beyond ho sakta hai, lekin tight SL ki wajah se Second Sweep hit bhi kar sakti hai. Har successful Historical Screenshot ko dekh kar giant reversal assume mat karein.
CONCLUSION
Breakout trading mein patience, completed close, retest evidence aur risk control zaroori hain.
PIPSEPAISA FREE COURSES
Sir Sajid Khan Ghori ka Free Forex Technical Analysis Course join karne ke liye WhatsApp par message karein ya www.pipsepaisa.com ke Courses tab par enroll karein.
Sir Ghulam Abbas ke Free Forex Fundamental Analysis Course ke liye bhi WhatsApp ya Courses tab use karein.
DISCLAIMER
Examples sirf education ke liye hain, live signals nahi. Leveraged trading mein loss ho sakta hai.
Educational content only. Trading involves risk. Always use independent analysis and appropriate risk management.