
On-Balance Volume (OBV): Volume Momentum, Divergence and Forex Limitations
PipSePaisa • Forex Education & Research
INTRODUCTION
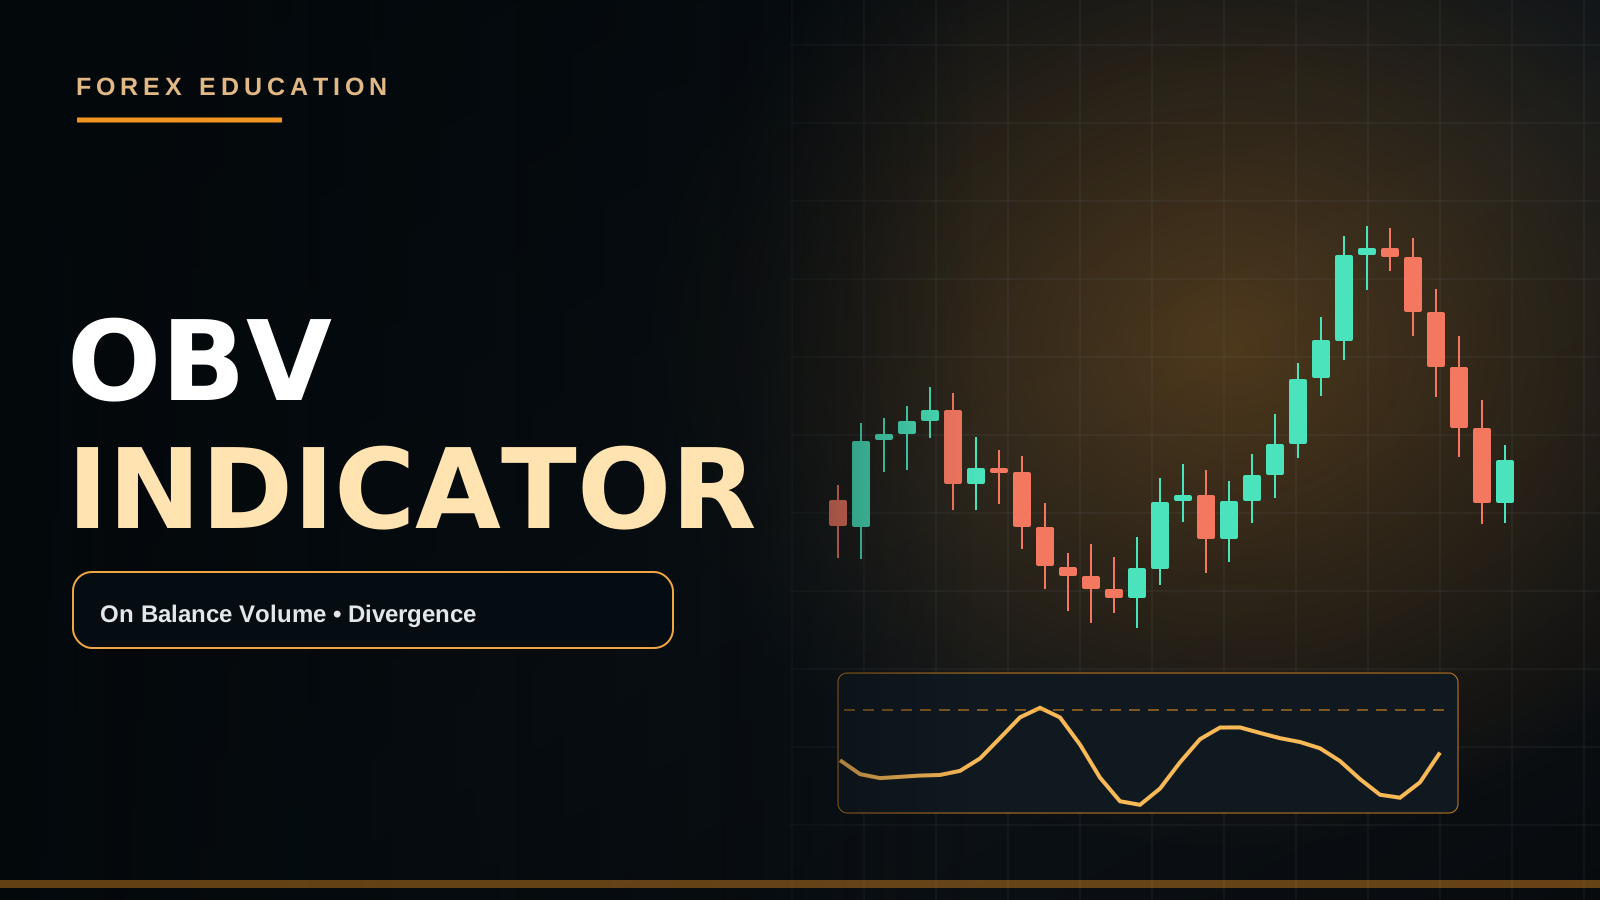
OBV adds volume on candles that close higher and subtracts volume on candles that close lower. The resulting cumulative line is used to study participation patterns. For spot FX, available volume may represent broker tick activity rather than worldwide traded contracts.
PRACTICAL MARKET EXAMPLE
If EUR/USD makes a fresh high but broker OBV does not, some traders see weaker participation. However, broker quote updates and different data sources may distort the comparison.
IMPORTANT LIMITATIONS
OBV divergence does not prove a reversal and cannot show hidden institutional intention.
THE BASIC ON-BALANCE VOLUME RULE
On-Balance Volume is a cumulative running total. If the latest closing price is above the preceding close, the bar's represented volume is added. If the close is below the previous close, it is subtracted. If the close is unchanged, OBV is generally left unchanged. The absolute numeric value depends on the starting history, so traders often focus on direction and pattern rather than treating a specific OBV number as an important price. This is a volume-based chart transformation, not a forecast of future candles.
A NUMERICAL OBV EXAMPLE
Suppose OBV begins at zero. The next completed candle closes higher on recorded volume 120, so OBV becomes +120. The following candle closes lower with volume 80, producing an OBV of +40. A third candle closes higher with volume 200, resulting in +240. The indicator rises because the more recent higher-closing bars carried greater represented activity than the lower-closing bar. These calculations do not prove whether that activity came from one bank, many retail orders or a broker's price-update count.
WHAT OBV ADDS TO PRICE ANALYSIS
OBV is intended to compare activity with price movement. If both the instrument and OBV form new highs, some analysts describe participation as confirming the price trend. If price makes a higher high but the OBV line forms a lower high, they might investigate divergence. Such observations can help formulate questions, but they cannot establish whether a trend will reverse. The volume sample must reflect the market being analyzed, and the trader still needs meaningful H1/H4 structural context.
SPOT FOREX TICK VOLUME LIMITATION
Retail Forex is decentralized, so platform volumes are frequently tick counts or other broker-defined metrics rather than a single worldwide transaction tape. A tick count can rise when quote activity accelerates; it need not correspond exactly to the number of lots traded globally. Since OBV adds or subtracts the platform's volume field, a broker-specific dataset can create a broker-specific OBV curve. Comparing two Forex platforms without comparing volume definitions may produce misleading disagreements.
FUTURES DATA AS AN ALTERNATIVE
Currency futures on a centralized exchange provide executed volume for that contract and venue. OBV calculated from futures can therefore reflect a more clearly defined traded-volume source. However, the futures market is not identical to the entire spot market, and contract rolls, session windows and currency-pair quotation conventions matter. A trader might study futures OBV as supporting information for spot EUR/USD, but must not assume exact one-to-one equivalence or identical entry prices.
GOLD FUTURES AND CFD OBV
Gold Futures OBV reflects the exchange's selected volume feed, while retail XAUUSD OBV might use the broker's tick volume. Gold futures and CFD prices often correlate, but their volume histories are different. If a user claims OBV shows institutional Gold accumulation, the chart alone cannot verify that attribution. A rising indicator indicates a pattern in the selected price and volume data; it does not reveal the identities or investment intentions of all buyers.
BULLISH OBV DIVERGENCE
A possible bullish divergence can occur when price creates a lower low while OBV produces a higher low. This may indicate that the lower close was accompanied by relatively different represented activity. But a strong bearish trend can keep making new lows regardless of divergence. The usefulness of the observation depends on consistent swing selection, data quality and whether H1 Demand or other structural Support is nearby. A completed M5 bullish structure shift may provide additional confirmation if required by the method.
BEARISH OBV DIVERGENCE
If price forms a higher high while OBV forms a lower high, traders sometimes describe that as bearish divergence. However, a bullish price breakout may continue even when the indicator fails to match the previous peak. Avoid drawing arbitrary OBV trendlines only after observing a profitable short. A robust test specifies which price highs and OBV highs can be compared, and how many bars apart they may be. The signal should not override an intact H4 uptrend and strong higher lows.
OBV TRENDLINE BREAKS
Some traders draw lines across OBV peaks or troughs and compare the indicator's break with price movement. A broken OBV trendline may reflect changed volume distribution before the price chart shows a major structural change, but this is a historical relation, not reliable foreknowledge. If the indicator is noisy, small changes in feed data can alter the line. Define trendline anchors before the outcome becomes visible and check whether price itself has reached a meaningful location.
EUR/USD LONG CASE STUDY
Assume EUR/USD H4 is bullish and an H1 pullback arrives at Demand. Price briefly sweeps a previous low but closes back above it. M15 OBV starts to recover, and M5 completes a bullish engulfing and CHoCH. The setup's logic comes from H4 context, H1 location and the completed price trigger; OBV may add participation context. SL should be below a relevant rejection extreme, not below the oscillator. If the nearest Supply is close, the trade may be skipped regardless of a rising OBV.
GBP/USD SHORT CASE STUDY
GBP/USD rallies into H1 Supply inside a broader downtrend. Price makes a temporary higher intraday high, while OBV fails to confirm a new high under a fixed swing definition. An M5 lower high and bearish candle close beneath local Support could help confirm a candidate Sell. But if Bank of England data suddenly strengthens GBP, the trade thesis can fail. Historical OBV divergence is not protection against new economic information.
OBV AND ACCUMULATION CLAIMS
Trading commentary often says 'smart money is accumulating' when OBV rises. This interpretation can be tempting because an increasing cumulative line appears to represent growing demand. Yet the indicator simply applies a signed addition or subtraction of the chosen volume input according to closing direction. It cannot distinguish market makers, banks, algorithmic traders or retail participants, and it cannot map all hidden orders. Describe what the data shows without claiming more.
OBV VERSUS VOLUME PROFILE
OBV accumulates signed volume by candle direction over time. Volume Profile redistributes represented activity across price levels. These tools answer different descriptive questions and cannot be substituted mechanically. An OBV increase does not mean that a price has become a new Point of Control, and a Value Area Low does not imply OBV must turn upward. Pair the indicator choice with the exact trading question it is intended to address.
MARKET NEWS AND INDICATOR REACTION
During NFP or CPI, price can move quickly and broker tick activity may surge. OBV can respond sharply because one large higher- or lower-closing candle adds or subtracts the entire represented volume for that bar. This can create a dramatic-looking step in the indicator after the actual economic repricing has begun. Treat such spikes cautiously, monitor Bid/Ask spread and consider whether the strategy is allowed to trade during high-impact releases.
AN OBV BACKTEST PLAN
Fix the chart's volume source, bar period, exact definition of signal, price swing selection, H4 market regime, H1 zone and M5 confirmation. Record whether OBV was aligned or divergent at the time of entry, not after the winning move completed. Compare net expectancy with the same setup using price structure alone. Include many trades across different sessions, and account for commission and slippage. Positive historical correlation between OBV and price is not a guarantee of future trading profit.
FREQUENT QUESTIONS
Does OBV show all Spot Forex contracts? No. Can two brokers have different OBV? Yes. Does a rising OBV mean institutional buying is confirmed? No. Can bearish OBV divergence fail? Yes. Is OBV a price level for Stop Loss? No. Can OBV be used alone as a guaranteed Buy/Sell signal? No. Its value depends on data quality and the system around it.
THE CUMULATIVE-SCALE PROBLEM
Because OBV is cumulative, the absolute value displayed today depends on how far back the chart data begins. Loading a longer or shorter history can shift the scale even when the recent shape is similar. A threshold such as 'OBV above 100,000 means Buy' is not portable across brokers, symbol volumes or chart histories without careful normalization. Relative swing patterns can be more meaningful than arbitrary absolute cutoffs, but they still must be tested and compared against the underlying market's price structure.
A FAILURE SCENARIO
Suppose Gold prints lower lows in a strong USD-positive macro environment while tick-based OBV shows a bullish divergence. A trader repeatedly buys because the indicator looks strong, yet H1 Demand breaks and price continues lower. The trading error is treating the divergence as an instruction rather than a conditional clue. A clear rule would require a confirmed H1/M5 bullish structural event and a stop level. If that event never occurs, remaining flat is a disciplined result even though the oscillator suggested momentum divergence.
PIPSEPAISA FREE COURSES
For structured technical analysis education, explore the Free Forex Technical Analysis Course with Sir Sajid Khan Ghori. To understand the economic context behind Forex and Gold, explore the Free Forex Fundamental Analysis Course with Sir Ghulam Abbas. Visit www.pipsepaisa.com and select Courses for enrollment instructions. Courses and trading content cannot guarantee profit.
RISK DISCLAIMER
This is for education only. No indicator, chart pattern or economic release guarantees a trading outcome. Always calculate potential account loss, consider spreads and slippage, and wait for completed confirmation before trading.
Read in Roman Urdu
INTRODUCTION
On-Balance Volume (OBV) Up-Close candles par Volume add aur Down-Close par subtract karta hai. Cumulative Line participation pattern study karti hai. Spot Forex mein Tick Volume global traded lots ke equal nahi.
PRACTICAL EXAMPLE
EUR/USD New High banaye magar Broker OBV High confirm na kare to relative activity weak lag sakti hai. Lekin Tick Data aur Broker Feed differences result ko affect kar sakte hain.
LIMITATIONS
OBV Divergence guaranteed Reversal ya hidden Institutional Intent ka proof nahi.
OBV KA BASIC FORMULA
On-Balance Volume ek Cumulative Indicator hai. Agar New Candle ka Close previous Close se upar ho to recorded Volume add hoti hai. Close neeche ho to Volume subtract hoti hai. Close equal ho to usually OBV unchanged rehta hai. Absolute OBV number initial history par depend karta hai, is liye Traders often Indicator ki Direction aur Pattern compare karte hain. Ye Selected Price/Volume Data ka calculation hai, Future Candles ka exact forecast nahi.
OBV NUMERICAL EXAMPLE
Starting OBV Zero hai. Next Candle higher Close karti hai aur Volume 120 record ho to OBV +120. Agli Candle lower close karti hai with Volume 80, OBV +40 reh jata hai. Third Candle higher close with Volume 200, OBV +240 ho jayega. Indicator rise is liye karta hai ke Higher-Close Bars par represented volume relatively greater thi. Is calculation se kisi particular Bank ya Retail Trader ki Order Identity prove nahi hoti. Broker Tick Count aur Exchange Volume different ho sakte hain.
OBV PRICE ANALYSIS MEIN KYA ADD KARTA HAI?
OBV ka purpose Price Movement ke saath Volume-based participation pattern compare karna hai. Agar EUR/USD Higher High banaye aur OBV bhi New High banaye to kuch Traders Confirmation describe karte hain. Agar Price New High lekin OBV Lower High de to Divergence investigation possible hai. Lekin ye future Reversal guarantee nahi. Data Feed quality, H1/H4 Trend aur actual Supply/Demand Zone ka context dekhna hoga.
SPOT FOREX TICK VOLUME LIMITATION
Spot Forex decentralized Market hai. Retail Platform ki Volume aksar Tick Volume hoti hai yani price/quote updates ka Count ya Broker-Specific Metric. Ye globally traded EUR/USD Lots ka exact consolidated record nahi. OBV directly wahi Volume input add/subtract karti hai jo Platform available karti hai. Agar do Forex Brokers ke Feed different hain to OBV Curve bhi differ kar sakti hai. Different charts compare karte waqt Volume Source aur Session Definition samjhein.
FUTURES VOLUME ALTERNATIVE
Centralized Currency Futures Exchange traded volume us Venue par recorded Transactions ko show karti hai. Futures OBV therefore clearer executed-volume dataset provide kar sakti hai. Lekin Futures Market entire Spot Forex Market ke identical nahi. Contract Roll Dates, Exchange Trading Sessions aur Currency Quotation Conventions bhi matter karti hain. Futures OBV ko Spot EUR/USD ke liye context ki tarah use karein, exact direct Bank Orders ka global record nahi.
GOLD FUTURES VS CFD OBV
Gold Futures ka OBV Exchange Volume use kar sakta hai, jabke Retail XAUUSD CFD Chart Broker Tick Volume par based ho sakti hai. Prices generally correlated ho sakti hain lekin Volume Histories different hain. Rising OBV ka matlab selected Data mein Up-Close Bars ki represented Volume add hui. Ye sab Buyers ki Identity ya institution accumulation intention verify nahi karta. Claims accurate rakhna Professional Education ka hissa hai.
BULLISH OBV DIVERGENCE
Price Lower Low aur OBV Higher Low banaye to possible Bullish Divergence. Ye latest price decline ke relative volume-direction behavior mein change ka clue de sakta hai. Lekin H4 Bearish Trend abhi strong ho to Price aur lower ja sakti hai. H1 Demand/Support aur M5 Bullish CHoCH ka wait karna conservative confirmation ho sakta hai. Divergence Swing Points ko consistent rule se select karein. Historical Winner dekh kar OBV Lows retrospectively adjust na karein.
BEARISH OBV DIVERGENCE
Price Higher High banaye aur OBV Lower High show kare to Bearish Divergence discuss hoti hai. Lekin Strong Bullish Trend multiple Higher Highs ke saath continue kar sakti hai. H4 Supply, Previous Day High, M5 Bearish Rejection aur Lower High confirmation ka context important hai. Sirf OBV Lower High par Sell karna aggressive speculative method hai. Indicator divergence ko price structure se separate samjhein.
OBV TRENDLINE BREAK
Kuch Traders OBV Indicator ke Peaks/Troughs par Trendline draw karte hain. OBV Line Break Price Structure Change se pehle appear ho sakti hai, lekin ye guaranteed leading signal nahi. Broker Tick Data differences aur Noisy activity Line Break create kar sakti hain. Trendline Anchors pehle define karein. Result aane ke baad adjustment karna biased Backtesting hai. Actual H1 Support/Resistance reaction aur M5 completed close phir bhi necessary ho sakti hai.
EUR/USD LONG CASE
EUR/USD H4 Bullish hai. H1 Price Demand par Pullback kare aur Previous Low ke neeche short Sweep de kar recover ho. M15 OBV upward recover hoti hai. M5 Bullish Engulfing aur CHoCH completed Close deti hai. Possible Trend Continuation Buy evaluate ho sakti hai. SL meaningful Sweep/Rejection Low ke beyond. OBV Participation Context hai, Entry Trigger actual Price Structure se aaya. Nearest Supply close ho to No Trade.
GBP/USD SHORT CASE
GBP/USD H4 Downtrend mein H1 Supply par rally karti hai. Price Temporary New High banaye lekin OBV under defined Swing Rule High confirm na kare. M5 Lower High aur Bearish Candle local Support ke neeche close kare to possible Sell Scenario. Lekin BoE Unexpected Economic Data se GBP abruptly stronger ho sakti hai. OBV Divergence fundamental surprise se protection nahi. Proper SL aur Risk Budget important hain.
ACCUMULATION CLAIMS KI LIMITATION
OBV rise kare to Trading Community kabhi kehti hai Smart Money Accumulation kar rahi hai. Lekin OBV ka Rule sirf higher/lower close ke mutabiq Volume add/subtract karna hai. Ye Market Makers, Banks, Funds aur Retail Participants ki separate identities nahi batata. Hidden Limit Orders bhi directly show nahi. Observable Price-Volume Pattern ko accurately describe karein, unsupported Guaranteed Institutional Entry ka claim nahi.
OBV VS VOLUME PROFILE
OBV Candle Direction ke saath Volume time ke across accumulate karta hai. Volume Profile selected Interval ki represented activity Price Levels par distribute karti hai. Dono tools different analytical questions solve karte hain. OBV rising ka matlab POC up move hogi, guaranteed nahi. Value Area Low Touch hone ka matlab OBV automatically bullish ho jayegi, ye bhi guaranteed nahi. Tool choose karte waqt purpose clear rakhein.
NFP CPI KE WAQT OBV
High Impact News par Price strong direction mein Candle close kar sakti hai aur Broker Tick Activity surge ho sakti hai. OBV us bar ki entire represented Volume add ya subtract karti hai, jisse dramatic Indicator Step nazar aa sakta hai. Lekin repricing already Price par ho chuki hoti hai. Wide Spread aur Slippage trade execution ko affect kar sakti hai. News Avoid Rule ho to indicator spike ke pressure mein trade na lein.
OBV BACKTEST CHECKLIST
Broker/Futures Volume Source, Timeframe, OBV Divergence Rule, Swing Selection, H4 Trend, H1 Zone, M5 Confirmation, SL/TP aur News Filter likhein. Entry ke waqt Indicator Data record karein, later Historical Chart ka perfect shape nahi. With OBV aur Without OBV same Strategy Net Expectancy compare karein. Realistic Commission/Spread include karein. Market Regimes change hoti hain, Past Edge Future Profit Guarantee nahi.
FAQ
OBV global Spot Forex Volume? Nahi. Brokers different OBV? Haan. Rising OBV = confirmed Institutional Buying? Nahi. Divergence fail? Haan. OBV price-based SL level? Nahi. OBV automatic profitable Buy/Sell signal? Nahi.
CUMULATIVE OBV SCALE PROBLEM
OBV Running Total hai, is liye displayed Absolute Number chart ke History Start Point par depend karta hai. Agar aap Indicator ko bohat purane Data ke saath load karein to OBV scale different ho sakti hai. Sirf 'OBV above 100000 = Buy' jaisi simple universal threshold alag Brokers aur Symbols par reliable nahi. Tick Volume ke total Counts platform-specific ho sakte hain. Relative OBV Highs/Lows ya Slope compare karna helpful ho sakta hai, lekin Swing Selection aur Price Structure ke saath. Absolute Value ko Dollar Volume ya traded Contracts ki guarantee na samjhein.
BULLISH DIVERGENCE FAIL EXAMPLE
Gold strong USD-positive Economic Data ke baad H1 Lower Lows bana rahi hai. Broker Tick OBV Bullish Divergence show karti hai lekin H1 Demand decisively break hoti hai. Trader sirf Divergence ke naam par repeated Buy karta hai aur Stop Losses hit hoti hain. Problem Indicator ka guaranteed wrong hona nahi, balki Divergence ko unconditional Entry samajhna hai. Agar aapka Plan H1 Demand Hold + M5 Bullish CHoCH require karta hai to dono absent hone par No Trade. Market ko reverse karna compulsory nahi.
OBV BACKTEST MEIN FAIR COMPARISON
Ek hi Broker Feed aur Timeframe par OBV Divergence + M5 Confirmation Model ko Price-Only H1 Demand Model se compare karein. Kya OBV Early Warning deti hai? Kya woh Successful Entries delay kar ke RR weak kar deti hai? Kya high-impact News Days mein False Divergences zyada hain? Win Rate alone nahi, Average Winner/Loss in R, Costs aur Drawdown bhi calculate karein. Historical Chart par indicator line adjust karna ya losing examples exclude karna misleading hai.
OBV AUR RISK MANAGEMENT
OBV 200 se 400 ya 1000 se 2000 jane par Lot proportional barhana logical nahi. Absolute Indicator Units broker dataset se linked hain, Risk Budget se nahi. Buy Entry H1 Demand aur M5 Bullish Close par consider ho to SL structural Swing Low ke beyond rakhein. Account Equity Risk se Volume determine aur Nearest H1 Supply tak possible Target compare karein. Spread/Commission ke baad reward sensible nahi to No Trade. OBV additional context hai, Capital Protection ka replacement nahi.
PIPSEPAISA FREE COURSES
Sir Sajid Khan Ghori ke Free Forex Technical Analysis Course mein Price Action, Market Structure aur Confirmation seekhein. Sir Ghulam Abbas ke Free Forex Fundamental Analysis Course mein Gold aur Forex ke Economic Data ka concept samjhein. www.pipsepaisa.com par Courses Tab se Enrollment Instructions check karein. Course Profit ki guarantee nahi.
DISCLAIMER
Ye sirf educational content hai. Koi Indicator, Pattern ya News guaranteed signal nahi. Structural Stop Loss, Account Risk, Spread aur Completed M5 Confirmation ka wait karein. No Confirmation = No Trade.
Educational content only. Trading involves risk. Always use independent analysis and appropriate risk management.