
Bull and Bear Flags and Pennants: Forex Trend-Continuation Pattern Guide
PipSePaisa • Forex Education & Research
INTRODUCTION
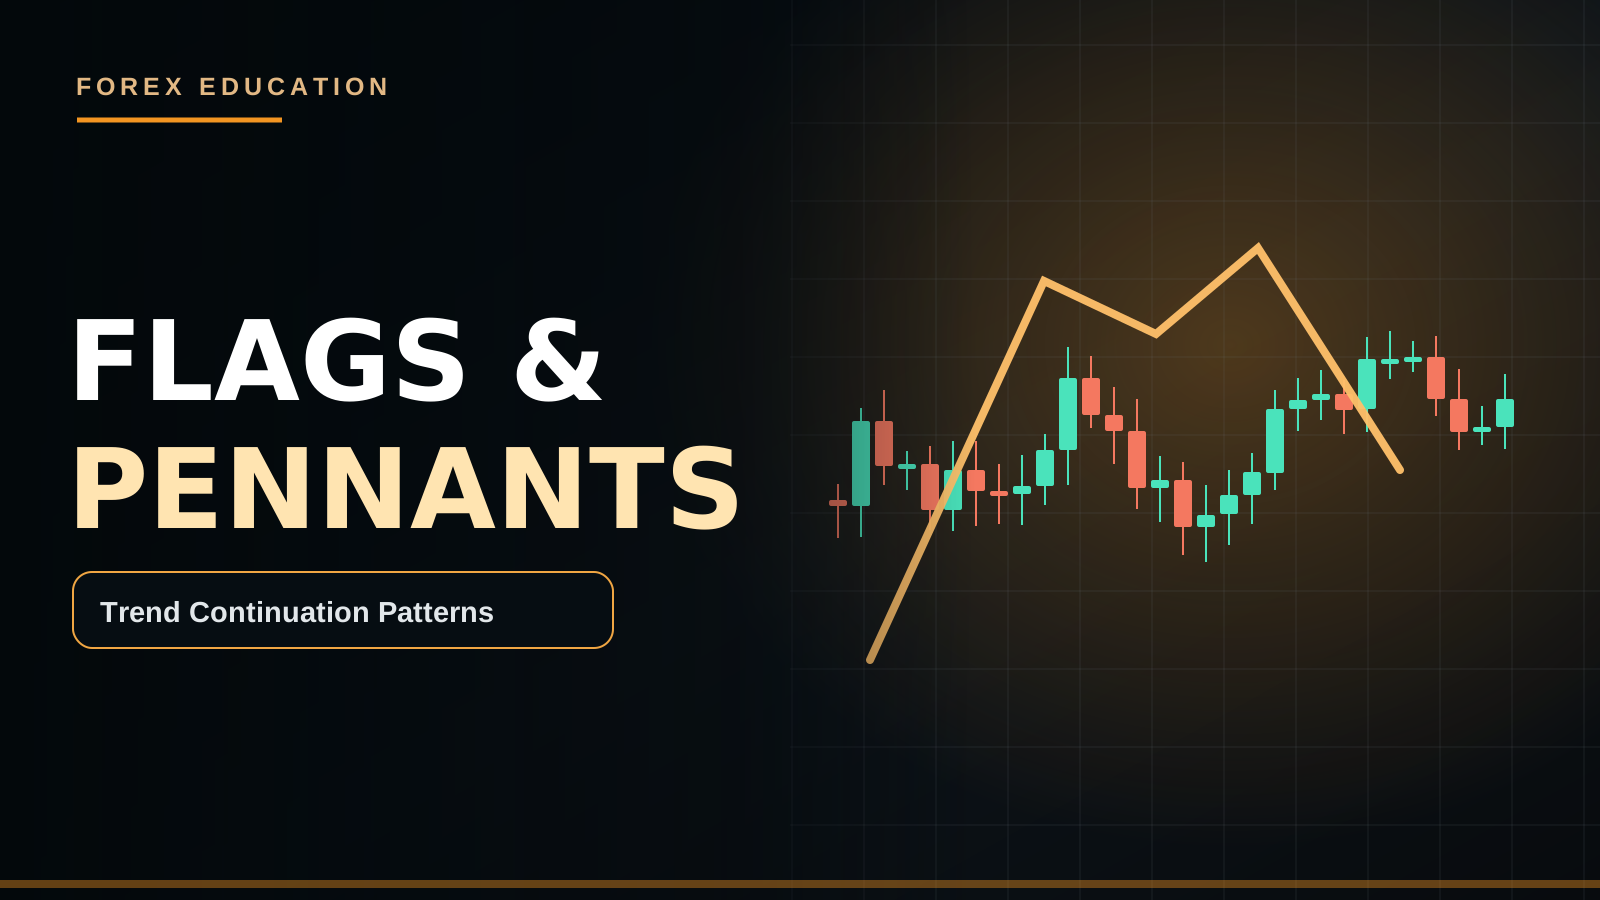
Flags and pennants describe a sharp directional pole followed by a smaller countertrend or contracting consolidation. They are often used as possible continuation frameworks, but any consolidation can still become reversal or range expansion.
PRACTICAL MARKET EXAMPLE
Gold rallies rapidly, then forms a shallow descending flag on M15. A bullish continuation trader might wait for a completed break above the flag plus appropriate H1 target space rather than buying every minor bounce.
IMPORTANT LIMITATIONS
Flagpole measurement targets are hypothetical projections, not binding future prices.
THE POLE AND THE PAUSE
Flags and Pennants are often categorized as continuation formations. They begin with a relatively sharp directional move called the flagpole, followed by a smaller consolidation or corrective structure. A flag commonly resembles a channel sloping against the preceding move, while a pennant is more triangular and contracting. The core hypothesis is that price may resume in the pole's direction after a pause, but reversal and range expansion are possible too. The name does not transform a pattern into a guaranteed signal.
BULL FLAG GEOMETRY
A Bull Flag can form after a strong advance. Price then pulls back or drifts sideways inside a short descending or nearly horizontal channel. This might be a healthy correction within a broader H4 uptrend, or it might be the first phase of a larger reversal. Look for whether major higher lows remain intact and whether the pattern is forming near H1 Supply. An upside break of the flag's upper boundary needs follow-through rather than a single unfinished candle.
BEAR FLAG GEOMETRY
A Bear Flag follows a strong decline and often shows a relatively shallow upward or sideways correction. It may appear on M15 after an H1 breakdown. The bearish continuation idea strengthens if price fails to reclaim previous support and a completed bearish candle breaks the flag's lower boundary. But if economic news shifts rate expectations, the upward correction can become a real reversal. A flag label does not mean sellers control every subsequent candle.
PENNANT CONSTRUCTION
A Pennant commonly contains lower highs and higher lows following a strong pole, making a small converging formation. The trader should distinguish it from a large Symmetrical Triangle that has no clear preceding impulse. A very long consolidation that retraces most of the pole may no longer match the intended compact continuation definition. Establish a maximum retracement depth, duration and minimum initial displacement before reviewing performance. Rules that change after a winner appears introduce hindsight.
FLAGPOLE MEASUREMENT
Some continuation systems estimate a target by measuring the flagpole's height and projecting a similar move from the eventual breakout. For instance, a sixty-pip bullish pole might produce a projected sixty-pip upside move. That is a geometric target, not a promise. H1 Resistance after twenty pips may stop the rally. Traders should evaluate the next actual historical supply, account costs and the required structural Stop Loss instead of assuming the market must fulfill the projection.
GOLD BULL FLAG EXAMPLE
Suppose XAUUSD advances quickly during London trading, then forms a mild descending M15 channel. H4 market structure is bullish, and the correction remains above a meaningful higher low. A completed M15 candle breaks the flag's upper boundary, followed by an M5 bullish Higher Low. A trader may evaluate a Buy if the stop beneath the correction low is affordable and the previous-day high or H1 Supply leaves adequate room. An extended breakout candle can make the entry too late.
GBP/USD BEAR FLAG EXAMPLE
Imagine GBP/USD H1 declines from 1.2800 to 1.2700 and then rebounds slowly to 1.2740 in a narrow M15 upward channel. A completed break of the channel's lower boundary may be a bearish continuation clue. M5 Lower High and bearish close can provide additional execution timing. But if the next H1 Demand begins at 1.2680, the remaining target is limited. The trader should compare potential reward with risk before taking the Sell.
PENNANT AFTER A NEWS CANDLE
A large CPI or NFP candle can resemble a powerful flagpole, followed by a small consolidation as spreads normalize. But the initial move may reflect mixed or revised data and reverse after additional market interpretation. Not every post-news Pennant continues in the first direction. A strategy that excludes major release windows may wait for the market to establish new structure after volatility settles. The same shape behaves differently when macro uncertainty and slippage are unusually high.
HOW LONG IS A VALID FLAG?
Flags vary in duration, and there is no one compulsory number of candles across all timeframes. An M5 flag lasting fifteen candles represents a different amount of market time than an H1 flag lasting fifteen bars. Define the relationship between the pole and the correction so the strategy remains reproducible. A consolidation lasting days after a five-minute pole may belong to an entirely different market regime. Avoid forcing unrelated ranges into a continuation pattern merely to increase signal count.
RETRACEMENT DEPTH
A shallow pullback may be consistent with stronger continuation pressure, while a deep correction can challenge the pole's original direction. Yet no universal Fibonacci percentage guarantees success. Some systems reject flags that retrace more than half the pole, but this is a chosen heuristic to test rather than an exchange rule. Look at confirmed Higher Lows or Lower Highs and whether the important H1 structure has already broken. Price behavior should take precedence over a fixed decorative percentage.
BREAKOUT AND RETEST
A completed candle close beyond a pre-drawn flag boundary provides more objective information than an intrabar wick. A subsequent retest holding that boundary may support continuation under a defined system. But powerful moves can continue without retesting, so a retest strategy may miss winners. Direct breakout entries may offer more participation but worse slippage and larger stop distances. Both have tradeoffs that must be tested using the same market period and execution assumptions.
FALSE FLAGS IN A RANGE
A price impulse in the middle of an H4 trading range may be followed by a compact correction that resembles a Bull Flag. If the supposed continuation target runs directly into the range's upper boundary, reward potential may be small. The shape can also be a temporary breakout that returns to the range midpoint. Labeling every miniature impulse-and-pause pattern as A++ can encourage overtrading. A clear H4 trend filter can help determine whether a continuation model fits the regime.
SUPPLY/DEMAND AND FLAG CONFLUENCE
A Bull Flag resting above an H1 Demand Zone or previous breakout level can provide a meaningful observation region. A Bear Flag rallying into old H1 Support-turned-Resistance can supply a comparable bearish location. Still, confluence does not guarantee the next move. If price decisively breaks the higher-timeframe zone, the continuation hypothesis should be reassessed. Confirmation, location and risk remain separate components of the same trade plan.
MULTIPLE TIMEFRAME EXECUTION
H4 establishes broader directional bias. H1 identifies the original impulse and important opposing levels. M15 displays the flag or pennant correction. M5 offers a completed engulfing candle, local BOS/CHoCH or retest trigger if the strategy requires it. Entering on an unfinished M5 candle can produce a false impression of confirmation. If the trigger closes too far from the correction low, the logical Stop may become too wide for the target. Skipping is permitted.
STOP LOSS AND LOT SIZE
For a Bull Flag, stop placement may be beneath the meaningful correction low or another rule-defined invalidation. For a Bear Flag it may lie above the correction high. A fixed five-pip stop irrespective of volatility can get triggered during ordinary fluctuation. Calculate Lot Size from Equity Risk and actual price distance. For XAUUSD, check broker Contract Size and Tick Value. Do not increase volume because the chart has a clean pole and a compact flag.
BACKTEST AND FAQs
Define pole magnitude, flag duration, retracement depth, boundary method, full close/retest, H4 trend alignment, entry timeframe, Stop/TP and news exclusion. Include failed patterns and formations without a breakout. Measure net R after spread and commission. FAQ: Must every Flag continue? No. Is a Pennant a guarantee after NFP? No. Can a Bear Flag turn bullish? Yes. Is the pole-height projection certain? No. Can a full confirmation still lose? Yes. No Confirmation = No Trade.
FALSE BREAKOUTS AT PREVIOUS HIGHS
The flag's breakout line may sit directly beneath a previous-day high where other traders have placed Buy Stops or protective orders. Price can push through that area temporarily, then reject, even if the original flag looked constructive. Consider whether the break was accepted with completed candles and whether a realistic structural target remains beyond the nearby obstacle. A continuation trader can recognize a strong pole but decline the entry when liquidity references and target space make the late breakout unattractive.
PIPSEPAISA FREE COURSES
For structured technical analysis education, explore the Free Forex Technical Analysis Course with Sir Sajid Khan Ghori. To understand the economic context behind Forex and Gold, explore the Free Forex Fundamental Analysis Course with Sir Ghulam Abbas. Visit www.pipsepaisa.com and select Courses for enrollment instructions. Courses and trading content cannot guarantee profit.
RISK DISCLAIMER
This is for education only. No indicator, chart pattern or economic release guarantees a trading outcome. Always calculate potential account loss, consider spreads and slippage, and wait for completed confirmation before trading.
Read in Roman Urdu
INTRODUCTION
Flags/Pennants mein pehle strong directional Flagpole move hoti hai, phir smaller Countertrend Channel ya triangular Consolidation. Continuation possible hai lekin guaranteed nahi.
PRACTICAL EXAMPLE
Gold strong rally ke baad M15 par shallow descending Flag bana sakti hai. Bullish Breakout ke completed close aur H1 Supply Target Space ke baghair Blind Buy nahi.
LIMITATIONS
Flagpole Size se derived Target Projection guaranteed TP nahi.
FLAGPOLE AUR CORRECTION
Bull/Bear Flags aur Pennants commonly Trend Continuation Patterns consider ki jati hain. Pehle strong directional Flagpole move, phir smaller Consolidation ya Countertrend Pullback hota hai. Flag often Channel Shape aur Pennant small contracting Triangle jaisi hoti hai. Theory ye hai ke Correction ke baad Original Trend continue ho sakti hai. Lekin Market Reversal ya Sideways Range bhi bana sakti hai. Pattern Naam Guaranteed Profit Strategy nahi.
BULL FLAG GEOMETRY
Bull Flag strong upward move ke baad banti hai. Price small descending ya sideways Channel mein Pullback kar sakti hai. Ye H4 Uptrend ka healthy correction bhi ho sakta hai ya deeper bearish shift ka start. H1 Higher Low intact hai? Nearest H4 Supply kitni door? Flag Upper Boundary ke upar completed Candle Close hui? Ye questions important hain. Sirf Channel dekh kar first Green Candle par Blind Buy na karein.
BEAR FLAG GEOMETRY
Bear Flag strong decline ke baad shallow upward ya sideways correction hai. M15 par H1 Breakdown ke baad possible formation mil sakti hai. Lower Boundary ke neeche completed Bearish Break aur M5 Lower High confirm ho to Trend Continuation Sell evaluate ho sakti hai. Lekin BoE, Fed ya NFP News sudden market direction change kar sakti hai. Flag Label Sellers ki guaranteed permanent dominance nahi.
PENNANT PATTERN
Pennant strong Flagpole ke baad Lower Highs/Higher Lows se small contracting structure banati hai. Large Symmetrical Triangle se difference preceding impulsive move aur compact consolidation ka concept hai. Agar correction Flagpole ka most part retrace kar le ya bohat long duration ho to original compact continuation definition weak ho sakti hai. Max Duration, Depth aur minimum displacement ke Rules pehle fix karein. Winner dekh kar Pennant Labels retrospectively change na karein.
FLAGPOLE TARGET MEASUREMENT
Flagpole Height 60 Pips ho to some Trading Systems Breakout ke beyond 60-Pip Target project karte hain. Lekin ye chart Geometry hai, mandatory future price movement nahi. Nearest H1 Resistance 20 Pips par ho to wahan reversal possible. Projected Level aur actual Opposing Supply ke darmiyan difference samjhein. Stop Distance, Spread aur Risk/Reward calculate karein. 'Measured TP' label Guaranteed Win nahi.
GOLD BULL FLAG EXAMPLE
Gold London Session mein strong Rally de, phir M15 small descending Channel form kare. H4 Bullish Structure intact hai aur correction important Higher Low ke upar hai. M15 Full Candle Flag Upper Boundary ke upar close kare aur M5 Higher Low confirm kare, to possible Buy Continuation. SL correction low ke beyond, TP Previous Day High ya H1 Supply. Agar Break Candle huge ho aur Entry late, Target Space poor ho sakti hai.
GBP/USD BEAR FLAG EXAMPLE
GBP/USD H1 1.2800 se 1.2700 tak decline kare. Phir M15 narrow Upward Channel mein 1.2740 tak retrace ho. Lower Flag Boundary ke neeche completed Close aur M5 Lower High possible Sell Continuation trigger ho sakti hai. Lekin H1 Demand 1.2680 ke qareeb ho to Target limited. SL above meaningful correction High aur Lot Money Risk ke mutabiq. Sirf bearish flag drawing par automatic order nahi.
NEWS CANDLE KE BAAD PENNANT
CPI/NFP release par Large Price Candle flagpole jaisi lag sakti hai, phir short Consolidation. Lekin Data Mixed ho ya Market Yields Interpretation change ho to initial News Direction reverse ho sakti hai. Har News Pennant same direction continue nahi karti. Trading Plan News Avoid rakhta ho to Stable Post-News Market Structure wait karein. Spread Widen aur Slippage ka risk especially important hai.
VALID FLAG KITNI CANDLES?
M5 ka 15-Bar Flag aur H1 ka 15-Bar Flag chronological Time mein bohat different hain. Fixed universal duration compulsory nahi, lekin aapke Backtest Rules mein Pole aur Pullback ka relation defined hona chahiye. Five-Minute Pole ke baad days-long Consolidation ko same tiny Flag Model kehna questionable hai. Maximum Duration, Minimum Pole Strength aur Timeframe predefine karein. Is se Historical Classification consistent hoti hai.
RETRACEMENT DEPTH
Shallow Pullback some Trend Models mein stronger continuation context suggest kar sakti hai, jabke deep Correction Original Trend ko weaken kar sakti hai. Lekin koi Fibonacci Ratio guaranteed success determine nahi. Kuch traders half Pole se zyada Retracement ko reject karti hain; ye Testable Heuristic hai, Universal Exchange Rule nahi. H1 Swing Structure aur actual Demand/Supply ko priority dein.
BREAKOUT RETEST RULE
Flag Boundary ke beyond M15 Completed Candle Close Wick se stronger information de sakti hai. Retest hold aur M5 Bullish/Bearish Confirmation ka wait conservative Model hai. Lekin Genuine Strong Breakouts kabhi retest nahi deti, is liye missed trades possible hain. Direct Breakout trader comparatively earlier Entry le sakta hai magar Slippage/Wide SL risk. Dono Methods same historical sample aur costs par compare karein.
RANGE MEIN FALSE FLAGS
H4 Sideways Range ke middle mein Large Candle aur small pullback Bull Flag jaisi nazar aa sakti hai. Lekin Range Upper Boundary bilkul qareeb ho to continuation Target limited. Price false Breakout de kar Range Midpoint return bhi kar sakti hai. Har mini Impulse/Pause A++ Signal nahi. H4 Market Regime Filter aur H1 Opposing Zones important hain. Overtrading avoid karein.
SUPPLY DEMAND CONFLUENCE
Bull Flag H1 Demand ya old Breakout Support ke qareeb pause kare to possible Buy Observation Location hai. Bear Flag old Support-turned-Resistance par rally kare to possible Sell Observation. Lekin Price H1 Zone decisively break kare to original thesis invalidate ho sakti hai. Multiple Labels guaranteed orders ka proof nahi. Completed Rejection/CHoCH, Structural SL aur RR har setup mein necessary hain.
H4 H1 M15 M5
H4 Bias, H1 Flagpole aur Opposing Zones, M15 Pattern, M5 completed Entry Trigger ek Top-Down Framework ho sakta hai. M5 Open Candle green ho aur last seconds mein red close ho to early Entry violate ho sakti hai. Agar Full Confirmation Candle bohat extended close kare to SL wide aur TP close ho sakti hai. Recalculate Lot aur RR. Suitable nahi to No Trade.
STOP LOSS LOT SIZE
Bull Flag ka SL meaningful correction Low ke beyond aur Bear Flag ka Stop correction High ke beyond ho sakta hai. Har symbol mein Fixed 5-Pip SL correct nahi, volatility different hai. Equity Budget se Position Size calculate karein. Gold Contract ka Tick/Point Value check karein. Perfect-looking Flag High Leverage justify nahi. News Slippage se actual realized loss estimate se differ ho sakta hai.
BACKTEST FAQ
Pole Strength, Duration, Maximum Retracement, Boundary Rule, M15 Close, Retest, H4 Trend, M5 Trigger, SL/TP aur News Filter fix karein. Har Matching Winner/Loser record karein. Spread/Commission ke baad Net R assess karein. FAQ: Har Flag Continue? Nahi. NFP Pennant guaranteed? Nahi. Bear Flag Bullish break? Possible. Pole Height TP guaranteed? Nahi. No Confirmation = No Trade.
FLAGPOLE KA ORIGIN IMPORTANT
Flagpole Start kahan hua? H4 Demand se Bullish Displacement aayi ya H1 Range Middle mein random Candle? Origin Location continuation quality ka context de sakti hai. Agar Strong Rally H4 Supply ke bilkul neeche khatam hui aur small Bull Flag form ho rahi hai to 'Bull Flag' Label Buy ke liye sufficient nahi. Similarly Bear Flag H4 Demand ke qareeb ho to next support immediate obstacle ho sakta hai. H4 Swing Structure aur Opposing Zones ke baghair isolated M5 patterns trade na karein.
FALSE BREAK ABOVE PREVIOUS HIGH
Flag Upper Boundary previous-day High ke qareeb ho to breakout traders ke Buy Stops aur previous shorts ke protective orders possible hain. Price temporary High Sweep de kar reject bhi kar sakti hai. Completed M15 Close beyond level, Retest Hold aur M5 Structure Shift evaluate karein. Har Higher Wick ko institutional manipulation kehna accurate nahi. Strong Bull Flag bhi Fail ho sakti hai aur initial Rally Range mein return ho sakti hai.
FIRST TOUCH VS CONFIRMATION ENTRY
Flag Channel ke Lower Boundary par early Buy Limit ek aggressive Model hai. Upper Line ke beyond completed Bullish Close aur Retest Entry ek separate conservative Model. First Touch better Price de sakti hai magar early SL hit risk. Confirmation late ho kar RR weak kar sakti hai. Dono Models ke Net Results, Stop Distance, Average R aur Trading Costs compare karein. Winning History ke liye convenient method select na karein.
PRACTICAL JOURNAL EXERCISE
20 Historical H1/M15 Flags select karein. Flagpole Size, H4 Trend, Correction Depth, Flag Duration, Direction of Break, M5 Confirmation, News Time, SL/TP aur Net Result record karein. Genuine Continuations ke saath Failed Flags include karein. Jo Breakout without Retest chali gayi usay 'Missed Setup' category dein agar strategy Retest require karti thi. Sirf Perfect Chart Examples strategy edge prove nahi karte.
PIPSEPAISA FREE COURSES
Sir Sajid Khan Ghori ke Free Forex Technical Analysis Course mein Price Action, Market Structure aur Confirmation seekhein. Sir Ghulam Abbas ke Free Forex Fundamental Analysis Course mein Gold aur Forex ke Economic Data ka concept samjhein. www.pipsepaisa.com par Courses Tab se Enrollment Instructions check karein. Course Profit ki guarantee nahi.
DISCLAIMER
Ye sirf educational content hai. Koi Indicator, Pattern ya News guaranteed signal nahi. Structural Stop Loss, Account Risk, Spread aur Completed M5 Confirmation ka wait karein. No Confirmation = No Trade.
Educational content only. Trading involves risk. Always use independent analysis and appropriate risk management.