
MACD Indicator in Forex: Signal Line, Histogram, Momentum and Divergence
PipSePaisa • Forex Education & Research
INTRODUCTION
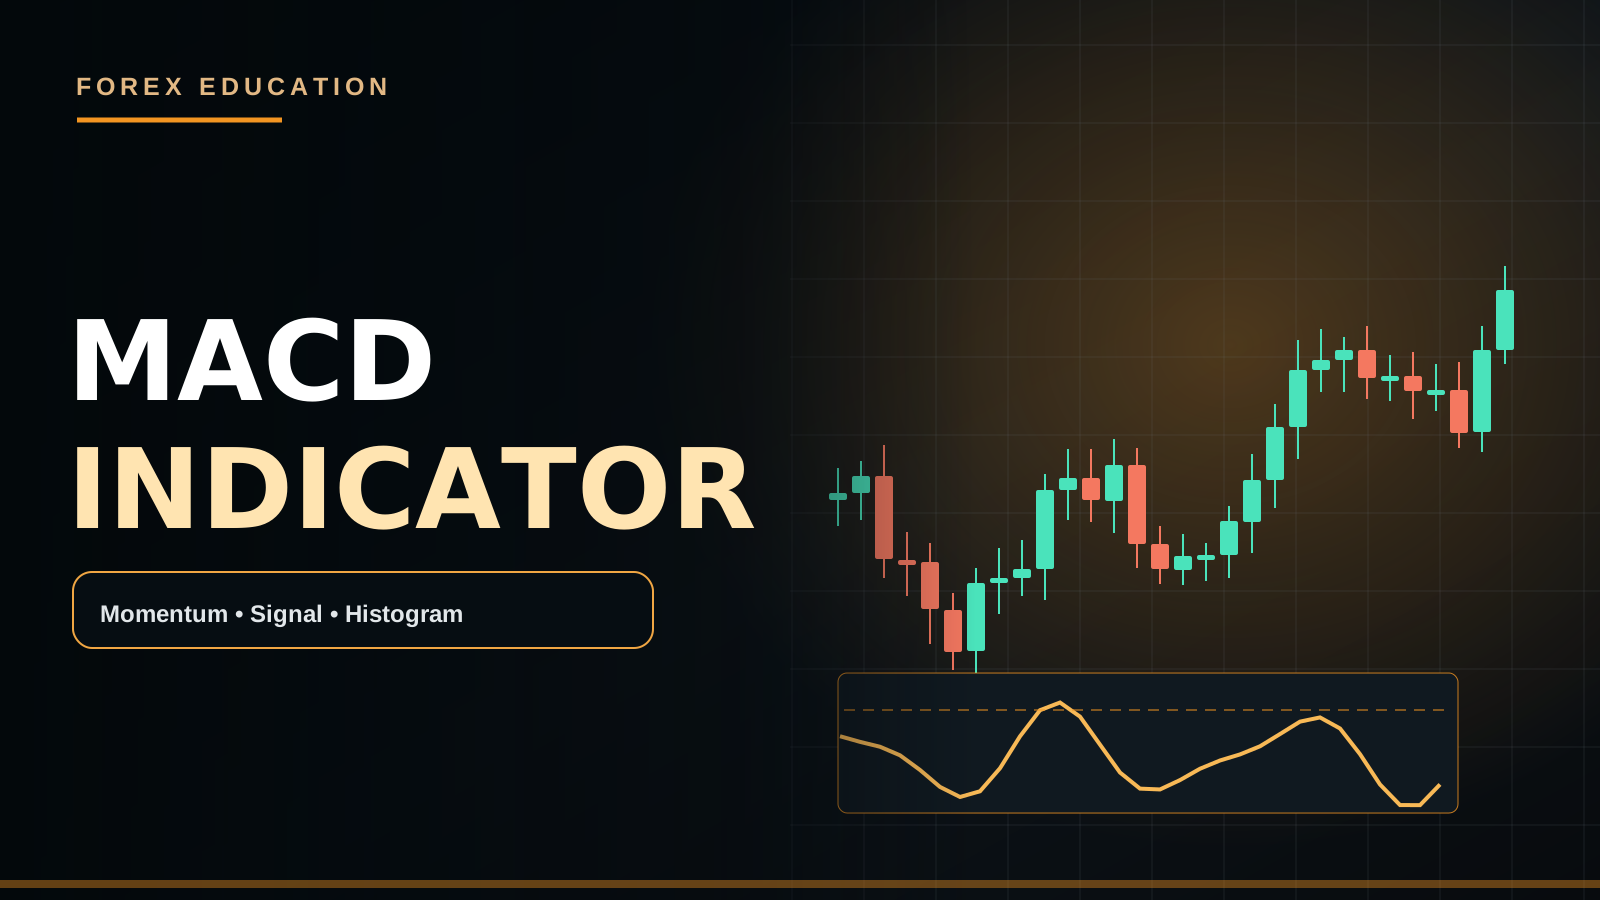
MACD compares two exponential moving averages, commonly twelve and twenty-six periods, and adds a nine-period signal line to examine changes in momentum. The histogram displays the difference between MACD and its signal. It measures transformed past prices, not live institutional orders.
PRACTICAL MARKET EXAMPLE
A bullish histogram may rise while EUR/USD remains beneath an H4 resistance zone. This divergence between short-term momentum and structural location is why buying the first green bar can be risky. Watch an H1 level and a completed M5 structural shift before considering execution.
IMPORTANT LIMITATIONS
A MACD crossover is not the same thing as price breaking an important swing. News candles and sideways markets can produce misleading repeated crossovers.
MACD CALCULATION AND THREE COMPONENTS
The MACD line is commonly calculated by subtracting the 26-period exponential moving average from the 12-period EMA. A nine-period EMA of the MACD line is then the signal line. Histogram bars represent the MACD line minus the signal line. The MACD line crossing above its signal can describe improving upward momentum, while the histogram returning toward zero can indicate that the difference between the two lines is contracting. None of these mathematical observations directly tells you where Stop Loss orders are resting.
ZERO LINE AND MOMENTUM CONTEXT
When the fast EMA is above the slow EMA, the MACD line is generally positive. When the fast EMA is below the slow EMA, MACD tends to be negative. A MACD crossover beneath zero can be part of a corrective rally inside a broad downtrend; one above zero can occur after significant bullish progress is already complete. For analysis, separate the sign of the main line, the direction of the histogram, the slope of price and proximity to important historical resistance or support.
A COMPLETE EUR/USD BULLISH EXAMPLE
Suppose EUR/USD H4 has confirmed higher highs and higher lows. An H1 pullback reaches previously marked Demand near 1.1020–1.1030. M15 MACD histogram becomes less negative as selling momentum slows. After a completed M5 bullish engulfing candle breaks local resistance, a trader may study a long scenario. Stop Loss should reflect the meaningful rejection low and the lot should be sized from the price distance. If the next H1 supply is too close, skip the trade despite a favorable MACD signal.
A BEARISH EXAMPLE IN GBP/USD
Imagine GBP/USD H4 structure is bearish and H1 price rallies into the earlier breakdown region around 1.2760. During the rally, MACD may remain positive on M5 but start producing smaller positive histogram bars. That is evidence of slowing short-term upward momentum, not a Sell by itself. A completed bearish CHoCH, a lower high and a candle close below local support can become a trigger if the trading plan uses those confirmations. If price instead closes above H1 supply, the bearish idea weakens.
HISTOGRAM COLOR IS NOT ENOUGH
Many indicator themes color positive histogram bars green and negative bars red. Other versions differentiate increasing versus decreasing positive bars. A bar that is still above zero but shorter than the previous one may mean bullish momentum has decelerated without necessarily turning bearish. Learn exactly how your platform assigns color. Taking an immediate Sell every time a green bar shortens can lead to repeated countertrend entries. Value, sign and bar-to-bar change tell different stories.
REGULAR BULLISH DIVERGENCE
Price can make a lower low while MACD forms a higher local low. Traders describe this as regular bullish divergence, suggesting the second price decline may have weaker downside momentum. But price may continue falling because of persistent macroeconomic pressure. A divergence is most informative when the corresponding price swings are well defined and located near a meaningful H1/H4 Demand area. A later completed break above the relevant lower high may provide the price-action confirmation missing from the oscillator alone.
REGULAR BEARISH DIVERGENCE
A higher price high alongside a lower MACD swing high is often called bearish divergence. It can appear after a trend has progressed significantly, especially near obvious H4 Supply. However, divergence can persist through multiple higher highs. Drawing a diagonal line between arbitrarily selected oscillator peaks after the fact makes the method look better than it was live. Fix swing rules, require completed candles and journal counterexamples as carefully as successful examples.
HIDDEN DIVERGENCE AND TREND CONTINUATION
Some traders look for hidden bullish divergence when price makes a higher low but the MACD indicator makes a lower low during an uptrend. The bearish counterpart can appear during a downtrend. These are conditional continuation ideas rather than automatic forecasts. Their interpretation changes when the H4 trend is unclear or when the 'higher low' exists only on a noisy one-minute chart. If the original trend structure has broken, the hidden divergence thesis should be reconsidered.
SIDEWAYS MARKET WHIPSAWS
MACD is particularly vulnerable to repeated signal-line crosses during narrow consolidation. The faster EMA can alternate above and below its slow counterpart while price remains trapped in a range, causing alternating Buy and Sell prompts. If a trader defines a trend-following strategy, a ranging H1 market may fail its setup criteria. Some approaches use a higher-timeframe trend filter, minimum price displacement or waiting for range breakout acceptance. Each additional filter must be measured rather than assumed to help.
MACD AND NEWS-DRIVEN PRICING
An NFP or CPI surprise can push a currency hundreds of points in a short period. MACD will respond to that price movement, but the response is after the underlying market has changed. A bullish MACD crossover immediately after a huge data candle might signal momentum while the available target is already close or spreads remain abnormally wide. Wait for price to stabilize if that is what your plan requires. Read the report's components rather than treating a chart indicator as an economic predictor.
M5 CLOSE AND ENTRY TIMING
MACD plotted on an unfinished candle may change before close, just as an M5 bullish engulfing candle can fail in its final seconds. If you require both MACD confirmation and candle close, confirm the values only after the bar is complete. An alert based on a developing histogram is not identical to a tested close-only signal. If the completed candle becomes large, recalculate the Stop Loss and nearest target rather than using the attractive early prices shown in hindsight.
STOP LOSS, TARGET AND LOT SIZE
MACD is an oscillator, so a Stop Loss cannot be logically defined as 'just below MACD zero.' A Buy may use the rejection low at H1 Demand, and a Sell may use a confirmed local high at Supply. Calculate the monetary risk for the real price distance and broker's symbol specifications. Targets belong near realistic historical opposing levels or within tested R-multiple rules. A strong signal is not permission to increase lot without changing the budget.
A TESTABLE MACD PLAYBOOK
Choose exact 12/26/9 or other settings, timeframe, source prices, crossover requirement, whether zero-line position matters, H4 bias, H1 zone, M5 confirmation trigger, Stop Loss and target. Define the permitted time between a crossover and entry. Log every matching occurrence, even if the trade would have lost. Compare a crossover-only baseline against one with meaningful price-action confirmation and realistic spread. Without this protocol, beautiful historical screenshots are not evidence of a reliable edge.
HOW MACD DIFFERS FROM RSI AND EMA
MACD is constructed from the difference of two EMAs and their signal-line relationship. RSI compares relative average gains and losses, and a single EMA describes a smoothed price level. All depend on the same underlying price history, so agreement is not multiple independent proofs of future direction. Technical context from prior Support/Demand and actual candle structure can add a different perspective. Avoid stacking so many indicators that the strategy becomes impossible to execute consistently.
FAQ: WHAT TRADERS SHOULD REMEMBER
Does a MACD Buy cross always mean the market will rise? No. Can MACD be positive while the latest candle falls? Yes. Does histogram shrinking mean an automatic reversal? No. Can a divergence fail repeatedly in a strong trend? Yes. Is a nine-period signal line universally optimal? No. Can a losing trade still have followed a valid process? Yes. Measure rule adherence and net expectancy, not the color of individual bars.
A NUMERICAL MACD READING
Suppose a hypothetical EMA 12 is 1.1050 while EMA 26 is 1.1020. The MACD line is 0.0030, equivalent to thirty pips of price difference on a typical EUR/USD quote, though the indicator is not reporting a trade profit. If its nine-period signal line equals 0.0024, the histogram is 0.0006. The histogram being positive means the MACD line is above its signal, not that the next price candle must rise. Different charting platforms may display values in points or their own precision, so read the actual formula and instrument digits.
WHEN TO SKIP A MACD SIGNAL
Avoid a crossover if the H1 trade location is undefined, if M5 confirmation remains unfinished, if a high-impact economic release is imminent and your plan excludes it, or if a meaningful H4 obstacle leaves insufficient target room. A bullish crossover can also appear after an unusually large move when the risk distance becomes too wide. An objective no-trade decision protects a strategy from being transformed into an impulsive chase. Keep a note of missed and rejected setups in the journal to distinguish discipline from a lack of opportunity.
MEASURING ACTUAL BENEFIT
To evaluate MACD, compare a baseline strategy that trades completed H1 Demand/M5 candle confirmations without MACD against the same strategy with an additional MACD filter. Record all qualifying trades, average net R, drawdown and sample size. If the indicator blocks mostly winners, adding it can reduce edge. If it filters many poor conditions, it may help. One beautiful trade is not evidence. The tool should earn its place through incremental decision value rather than name recognition.
PIPSEPAISA FREE COURSES
For structured technical analysis education, explore the Free Forex Technical Analysis Course with Sir Sajid Khan Ghori. To understand the economic context behind Forex and Gold, explore the Free Forex Fundamental Analysis Course with Sir Ghulam Abbas. Visit www.pipsepaisa.com and select Courses for enrollment instructions. Courses and trading content cannot guarantee profit.
RISK DISCLAIMER
This is for education only. No indicator, chart pattern or economic release guarantees a trading outcome. Always calculate potential account loss, consider spreads and slippage, and wait for completed confirmation before trading.
Read in Roman Urdu
INTRODUCTION
MACD Indicator typically EMA 12 aur EMA 26 ke difference aur Signal EMA 9 ko compare karta hai. Histogram MACD Line aur Signal Line ke darmiyan difference show karta hai. Ye past price momentum ka tool hai, future winning trade ki guarantee nahi.
PRACTICAL EXAMPLE
EUR/USD par Bullish Histogram increase ho, lekin H4 Resistance abhi intact ho, to sirf green bars par Buy risky ho sakti hai. H1 Zone aur M5 completed Candle/CHoCH confirm karein.
LIMITATIONS
MACD Crossover aur actual H1 Swing Break same nahi. CPI/NFP aur Sideways Range mein repeated false crosses mil sakte hain.
MACD KI CALCULATION AUR THREE COMPONENTS
MACD Line commonly EMA 12 minus EMA 26 se calculate hoti hai. MACD Line ki EMA 9 ko Signal Line kehte hain. Histogram MACD Line aur Signal Line ke darmiyan difference show karta hai. MACD Line Signal ke upar cross kare to short-term Bullish Momentum improve ho sakti hai. Histogram Zero ke qareeb aaye to dono Lines ke darmiyan difference reduce ho raha hota hai. Lekin ye mathematical Price Indicator hai, hidden Bank Orders ka actual map nahi.
ZERO LINE KA IMPORTANT CONCEPT
Fast EMA Slow EMA se upar ho to MACD generally Positive Region mein hota hai. Fast EMA Slow se neeche ho to Negative Region possible hai. Zero ke neeche Bullish Signal Cross H4 Downtrend ke andar temporary Pullback bhi ho sakti hai. Zero ke upar Crossover large bullish move ke baad late Entry bhi de sakti hai. MACD ka Sign, Histogram Size, Price Structure aur nearest H1 Support/Supply alag information hain. Sirf indicator color dekh kar Buy/Sell decide nahi.
EUR/USD BULLISH EXAMPLE
Maan lein EUR/USD H4 Higher High/Higher Low bullish hai. H1 Price 1.1020–1.1030 ke purane Demand Zone par Pullback deti hai. M15 MACD Histogram pehle negative thi magar bars gradually less negative ho rahi hain, yani downward momentum slow ho sakti hai. M5 par completed Bullish Engulfing local Resistance ke upar close karti hai. Ye possible Buy Continuation Scenario hai. Stop Loss relevant rejection Swing Low ke beyond, Lot actual Pip Distance ke mutabiq calculate karein. Agar nearest H1 Supply bohat qareeb ho to No Trade.
GBP/USD BEARISH EXAMPLE
GBP/USD H4 Downtrend hai aur H1 Price earlier Breakdown Area 1.2760 ki taraf rally karti hai. M5 MACD abhi positive ho sakti hai lekin histogram bars chhoti hone lagti hain. Ye short-term Bullish Momentum slow hone ka clue hai, immediate Sell signal nahi. Agar M5 Bearish CHoCH, Lower High aur completed Bearish Candle Close local Support ke neeche aaye to possible Sell Model evaluate ho sakta hai. H1 Supply ke upar strong close mile to bearish thesis weak ho sakti hai.
HISTOGRAM GREEN AUR RED KO SAMAJHEIN
Different TradingView/MT5 Indicator Themes mein Green/Red Colors ki Definitions different ho sakti hain. Kuch Positive Histogram ko Green aur Negative ko Red karti hain. Kuch Increasing/Decreasing Positive Bars ke shades different show karti hain. Agar Positive Bar previous se chhoti ho jaye to Bullish Momentum Decelerate ho sakti hai, magar complete Bearish Reversal confirmed nahi. Value Zero ke upar hai ya neeche, Bar Size grow kar rahi hai ya shrink, aur Price actual Structure kya hai, teeno alag dekhein.
BULLISH MACD DIVERGENCE
Price Lower Low bana rahi ho magar MACD Higher Low form kare to Regular Bullish Divergence possible hai. Ye Downward Price Momentum pehle se relatively weak hone ka clue hai. Lekin USD-positive News ya Strong H4 Downtrend mein Price aur lower ja sakti hai. Divergence ko confirmed H1 Demand aur M5 Bullish Structure Shift ke context mein assess karein. Oscillator ke do Lows Drawing ke liye same Swing Selection Rule use karein. Chart result dekhne ke baad points adjust na karein.
BEARISH MACD DIVERGENCE
Price Higher High banaye aur MACD corresponding Lower High show kare to Bearish Divergence kaha ja sakta hai. H4 Supply ya Previous Day High ke qareeb ye extra warning ho sakti hai. Lekin strong Uptrend mein multiple Higher Highs bearish Divergence ke bawajood bante reh sakte hain. Sirf Divergence dekh kar Market Sell karna aggressive speculation hai. Important Swing Low ke neeche Completed Close, M5 Lower High aur realistic target evaluate karein. Losing Examples bhi Journal mein include karein.
HIDDEN DIVERGENCE AUR CONTINUATION
Hidden Bullish Divergence mein Price Higher Low, lekin MACD Lower Low bana sakta hai, especially Trend Continuation discussions mein. Hidden Bearish Model Downtrend ke andar opposite relationship describe karta hai. Lekin agar H4 Main Trend already invalidate ho chuka ho to hidden divergence ki interpretation weak ho sakti hai. M1 ke minor High/Low aur H4 Swings ko confuse na karein. Agar Setup sirf H1 Bullish Structure mein valid hai to H4 bearish context mein rules clearly separate rakhein.
SIDEWAYS MARKET MEIN MACD WHIPSAWS
H1 Range ke darmiyan Price chhoti moves kare to MACD Signal Line repeated Bullish/Bearish Cross de sakti hai. Is se trend-following traders unnecessary entries aur frequent Stop Losses face kar sakte hain. Agar aapka model sirf H4 Trend ke saath trades leta hai to Range State par No Trade Filter useful ho sakta hai. H1 Breakout, M15 Retest aur M5 Candle Close ka objective process define karein. Har losing historical example ke baad naya filter add karke Overfitting na karein.
CPI NFP AUR MACD
NFP ya CPI Release par Currency Pair strong Candle de sakti hai. MACD bhi Price Movement ke baad adjust ho jata hai. Lekin Indicator ka Bullish Cross iska proof nahi ke next Candle bhi Bullish hogi. Agar Release par Spread Wide aur Slippage possible ho to trade execution aur costly ho sakti hai. Actual Payroll, Wage, Unemployment ya CPI Core Component samjhein. News ka macro effect Indicator se independently analyze hona chahiye.
M5 FULL CLOSE WAIT KAREIN
MACD Open Candle par Cross show kare lekin last seconds mein Candle reverse ho aur Cross disappear bhi ho sakta hai. Isi tarah M5 Bullish Engulfing bhi Close se pehle fail ho sakti hai. Agar Strategy completed MACD/Candle Close demand karti hai to unfinished Bar par entry nahi. Agar Full Close ke baad Entry Late aur Stop Wide ho jaye to RR dobara calculate karein. Missed Trade loss nahi. No Confirmation = No Trade ko consistent rule rakhein.
STOP LOSS TP AUR LOT CALCULATION
MACD Zero Line par SL place nahi hota. Buy H1 Demand se ho to SL actual relevant Rejection Swing Low ke beyond ho sakta hai. Sell Supply par ho to meaningful Swing High ke beyond. Lot Equity Risk, Pip Distance aur Symbol Pip Value ke mutabiq calculate karein. TP Previous Swing High/Low ya nearest Opposing Zone ke context mein rakhein. Sirf MACD strong hai is liye High Leverage ya Double Lot use na karein.
MACD BACKTEST PLAYBOOK
Exact 12/26/9 Settings, Timeframe, Candle Source, Zero Line Rule, Signal Crossover, H4 Bias, H1 Zone aur M5 Confirmation pehle write karein. Crossover ke kitni candles baad entry valid? News Filter? SL Swing ya Fixed? TP? Har Historical Matching Setup include karein, Winners aur Losers dono. Trading Costs aur Realistic Slippage add karein. Simple Crossover Results vs Structure Confirmation Results compare karein. Beautiful screenshots positive expectancy ka reliable proof nahi.
MACD RSI AUR EMA DIFFERENCE
MACD Fast/Slow EMAs aur Signal Average ke relationship se momentum describe karta hai. RSI recent Average Gains/Losses ko compare karta hai. Single EMA Smoothed Price Level dikhati hai. Teeno past Prices se derive hotay hain; teen bullish signals completely independent evidence nahi. H1 Supply/Demand aur Actual Swing Break useful separate context provide kar sakte hain. Too many indicators chart ko complex bana sakte hain without improving decision quality.
MACD FAQ
MACD Bullish Cross guaranteed Buy? Nahi. MACD Positive ho aur Latest Candle Red? Possible. Histogram smaller Green = guaranteed reversal? Nahi. Divergence fail ho sakti? Haan. EMA 9 Signal universally best? Nahi. SL hit hone ke bawajood process valid? Haan, agar rules follow huay. Proper Results Net Expectancy aur Journal se evaluate karein, Indicator color se nahi.
MACD NUMERICAL CALCULATION
Hypothetical EUR/USD EMA 12 = 1.1050 aur EMA 26 = 1.1020 ho to MACD Line 0.0030 banti hai, yani typical Price Quote par 30-Pip Difference. Lekin ye Trade Profit nahi; Indicator Measurement hai. Signal Line 0.0024 ho to Histogram MACD minus Signal = 0.0006 banti hai. Positive Histogram ka matlab MACD Line Signal se upar hai, not necessarily next Candle Bullish. Different Chart Platforms Values Points aur Decimal Precision mein different display kar sakti hain. Pehle Symbol Digits aur calculation samjhein.
MACD NO TRADE CONDITIONS
H1 Demand/Supply clearly identified nahi? No Trade. M5 Confirmation Candle abhi incomplete? No Trade. Major CPI/NFP Release qareeb aur aapka News Filter excludes? No Trade. H4 Supply immediate upar hai aur Target Space insufficient? No Trade. Crossover bohat large Candle ke baad aayi aur Stop Distance wide ho gayi? Risk/Reward recalculate karein. Agar sensible nahi to Skip. MACD Indicator kisi Trader ko compulsory daily profit ya entry force nahi karta. Missed Setups ko Trading Journal mein disciplined decision ke taur par note karein.
MACD ADD KARNE KA REAL BENEFIT MEASURE KAREIN
Ek simple comparison karein: H1 Demand + M5 Engulfing Close wali Strategy Without MACD aur With MACD Filter. Same Forex Pair, Timeframe, Stop, TP aur Transaction Costs use karein. Kya MACD Filter weak setups reduce karti hai? Kya woh bohat winners bhi block kar deti hai? Average R, Drawdown aur sample size dekhein. Sirf ek beautiful historical chart se indicator ka advantage prove nahi hota. Agar MACD added complexity ke bawajood Net Performance improve nahi karti, to simpler Chart System bhi valid ho sakta hai.
PIPSEPAISA FREE COURSES
Sir Sajid Khan Ghori ke Free Forex Technical Analysis Course mein Price Action, Market Structure aur Confirmation seekhein. Sir Ghulam Abbas ke Free Forex Fundamental Analysis Course mein Gold aur Forex ke Economic Data ka concept samjhein. www.pipsepaisa.com par Courses Tab se Enrollment Instructions check karein. Course Profit ki guarantee nahi.
DISCLAIMER
Ye sirf educational content hai. Koi Indicator, Pattern ya News guaranteed signal nahi. Structural Stop Loss, Account Risk, Spread aur Completed M5 Confirmation ka wait karein. No Confirmation = No Trade.
Educational content only. Trading involves risk. Always use independent analysis and appropriate risk management.