
Williams Percent Range (%R) Explained: Forex Momentum, -20/-80 Levels and Gold Trading
PipSePaisa • Forex Education & Research
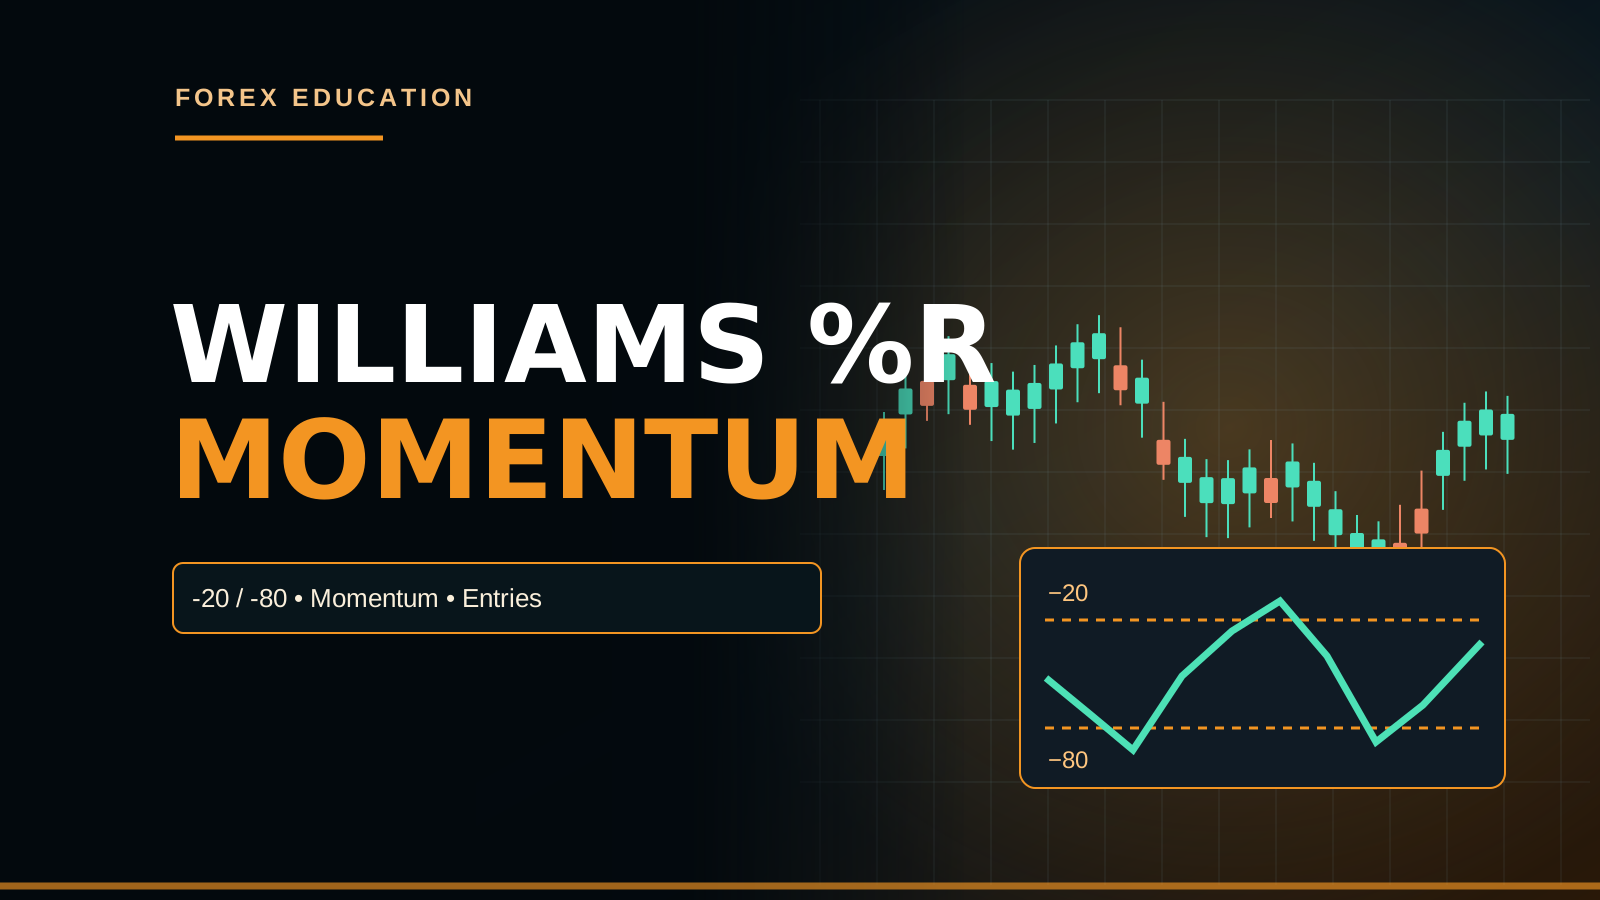
WHAT IS WILLIAMS PERCENT RANGE?
Williams Percent Range, usually written Williams %R, is a momentum oscillator attributed to Larry Williams. It compares the most recent closing price with the high-low range of a selected lookback. The output typically ranges from zero to minus one hundred, unlike the unbounded Commodity Channel Index. It can help visualize where price closed relative to recent extremes. However, the oscillator is calculated from past prices and cannot guarantee the direction of the next Forex or Gold candle. Market structure and risk management remain necessary.
HOW THE FORMULA WORKS
A common formula is Williams %R = −100 × (Highest High − Current Close)/(Highest High − Lowest Low), using the chosen observation window. Because the closing price normally lies within the observed high-low range, the value is between zero and minus one hundred under ordinary valid data. Implementations must handle cases where highest high equals lowest low. The values describe a normalized closing location, not a trading account profit percentage. An oscillator reading of minus twenty is not a promise of a twenty-percent gain or loss.
A NUMERICAL EXAMPLE
Imagine the highest high across the selected bars is 110, the lowest low is 90 and the current close is 106. Williams %R equals −100 × (110−106)/(110−90), which is −20. If the close were 94, the result would be −80. These are purely illustrative prices, not current XAUUSD levels. The same oscillator values can occur in different markets even when their price ranges and contract sizes differ. They do not automatically define a profitable Buy or Sell position.
THE -20 OVERBOUGHT ZONE
Williams %R values above minus twenty are often labeled overbought in educational charts. This means the close lies near the upper portion of the selected high-low range, not that every large buyer has exhausted funds. During a strong bullish trend, the oscillator can repeatedly remain near zero. Automatically selling at minus twenty can lead to repeated losses against trend. A contrarian approach needs a relevant H1 Supply Zone and completed bearish M5 structure before even considering a reversal hypothesis.
THE -80 OVERSOLD ZONE
Values below minus eighty are commonly described as oversold because the latest close is near the bottom of the lookback range. But bearish trends can keep the oscillator depressed while price continues making lower lows. Buying automatically after the first dip below minus eighty is a mean-reversion approach with no built-in confirmation. Some trend-following models even interpret persistent low values as bearish momentum. Decide what the oscillator means for a particular strategy before seeing the outcome.
WHY STRONG TRENDS STAY EXTREME
A momentum oscillator can remain near its upper or lower boundary while the market trends, because new closing prices continue near the most recent directional extremes. This characteristic makes Williams %R different from a simple signal that price must reverse at every threshold. A trend-following trader might interpret a long period above minus twenty as sustained upward pressure. A mean-reversion trader may wait for a structural rejection. Both ideas need separate rules and performance tests rather than switching interpretations after a loss.
THE STANDARD LOOKBACK PERIOD
Fourteen periods is a common educational Williams %R setting, but there is no universal correct length for every symbol. A fourteen-period M5 calculation covers different market time from fourteen H1 candles. Short lookbacks react quickly and can generate many crossings; longer lookbacks can smooth short fluctuations but delay some signals. Changing the period to optimize the last ten Gold trades is not evidence of robust edge. Compare parameter choices across trending and ranging samples with consistent execution assumptions.
WILLIAMS %R VERSUS STOCHASTIC
Williams %R is closely related mathematically to the fast stochastic oscillator's closing location in the recent range. Under aligned high-low windows, a common relationship is Williams %R = fast stochastic %K − 100. For example, stochastic %K of 80 corresponds to Williams %R of minus twenty. The display scales differ, so apparent inverse positioning can confuse beginners. Implementations that apply smoothing to stochastic lines need careful comparison. Using both indicators may add little independent information if they are mathematically describing the same underlying range.
WILLIAMS %R VERSUS RSI
Relative Strength Index, or RSI, typically uses averaged upward and downward price changes. Williams %R uses the close's location within the recent high-low range. Therefore they can disagree, especially when candle ranges and closes change differently. A Williams overbought reading is not equivalent by definition to RSI 70. Some combined systems require both to reach extremes, but this reduces trade frequency and may not improve net profitability. A rigorous backtest should determine whether the extra RSI condition adds incremental information.
MIDPOINT AND MOMENTUM CHANGES
The minus fifty line corresponds to the midpoint of the selected price range under the standard formula. A rise from minus eighty toward minus fifty suggests that closing prices are moving away from the recent lower extremes, but it does not establish a full bullish H4 reversal. Repeated crossings of minus fifty in a sideways market may generate noise. Some traders use the midpoint as a momentum filter rather than an entry by itself. A price-based structural change provides a separate test of the idea.
BULLISH DIVERGENCE
A potential bullish divergence occurs when price makes a lower low while the oscillator forms a higher corresponding low. Traders sometimes interpret this as reduced downside momentum. But the indicator compares closes with shifting ranges, so divergence does not necessarily signal that sellers have disappeared. A strong downtrend can continue through several apparent divergences. Confirm comparable swing points on the same timeframe and look for completed bullish structure near H1 Demand before considering a Buy. A lower oscillator extreme by itself cannot define the Stop.
BEARISH DIVERGENCE
A potential bearish divergence is sometimes defined by a higher price high alongside a lower Williams %R high at corresponding swing points. It can prompt a trader to monitor a nearby Supply Zone for evidence of rejection. However, oscillator peaks may saturate near zero during powerful trends, making the divergence interpretation difficult. A trader should not Sell solely because the oscillator did not print a new peak. Wait for actual bearish price action and check whether the next Demand Zone offers sufficient reward relative to the structural Stop.
RANGING MARKETS AND MEAN REVERSION
When H1 price clearly rotates between identified Support and Resistance areas, Williams %R may help highlight closes near range extremes. A theoretical Buy candidate could arise near H1 Demand while the oscillator recovers from a low reading and completed M5 bullish structure forms. But a range can break suddenly after news, turning a mean-reversion entry into a losing position. The trader must define range invalidation and be ready to abstain if the market begins trending. Indicator thresholds are not substitutes for those rules.
TREND-FOLLOWING USE
Trend-following traders may prefer waiting for an H4 directional bias and then observing Williams %R recover after a pullback. In an H4 bullish trend, an H1 Demand test followed by M5 price confirmation could be accompanied by the oscillator moving upward from negative extremes. This does not prove the trend is resuming, but it can provide a consistent optional filter. The trade should still be rejected if a major higher-timeframe Supply lies too close or if the stop distance exceeds acceptable monetary risk.
GOLD XAUUSD BULLISH EXAMPLE
Imagine Gold H4 structure is bullish while XAUUSD tests an H1 Demand Zone. On M5 the oscillator has been below minus eighty, then rises toward minus fifty while a bullish engulfing candle closes and a Higher Low holds. A tested strategy may evaluate a Buy with Stop beneath the relevant price swing. Gold monetary risk must be calculated from the broker's contract size and the entry-to-stop distance. An upcoming CPI release might invalidate the setup's news filter, even if the indicator looks attractive.
EUR/USD BEARISH EXAMPLE
Suppose EUR/USD H4 exhibits Lower Highs and Lower Lows and price retraces to H1 Supply. Williams %R rises near minus twenty during the pullback before falling again as M5 completes a bearish Change of Character. The trader might evaluate a Sell with Stop beyond the swing high and target near H1 Demand. But a strong ECB surprise could invalidate the short macro picture, and an unusually wide spread could make the setup unattractive. The oscillator's apparent perfect turn in hindsight is not a guaranteed live fill.
M5 FORMING-CANDLE CHANGES
Because Williams %R depends on the current close and the rolling high-low window, its latest value may move during an unfinished bar. A signal above minus twenty can disappear by the time the M5 candle closes. Traders who rely on closed-bar confirmation should measure the completed value, not a momentary tick. This is different from asserting that every Williams indicator secretly uses future data. MT5 Expert Advisors and TradingView alerts should distinguish forming and completed candles. Reliable testing must recreate the real decision time.
TRADINGVIEW AND MT5 IMPLEMENTATION
Many charting systems provide Williams %R with configurable lookback. Output differences can arise when symbols, candle construction, bar indexing and history differ. Some tools display negative values while others may transform or color them differently. Always verify the formula and input settings before transferring a strategy into an automated EA. Trading decisions use actual Broker Bid/Ask quotes rather than an oscillator level, and proper contract specifications determine monetary risk. A custom script claiming guaranteed reversal accuracy requires independent evidence.
NEWS-RELEASE VOLATILITY
CPI, NFP, FOMC and geopolitical news can cause Gold and Forex to jump through an oscillator's entire scale within minutes. Williams %R may reach an extreme because the candle itself is unusually large; that is not necessarily exhaustion. Bid/ask spreads and stop slippage may become severe. Entering into the first news spike merely because the value crosses minus eighty can create an oversized position relative to the actual structural Stop. Waiting or declining to trade remains a reasonable execution choice.
BACKTESTING WILLIAMS %R FAIRLY
A fair study compares a baseline H4 trend plus H1 Supply/Demand and M5 confirmation model with a version that additionally filters entries using Williams %R. Keep time periods, spreads, commissions, stop rules and capital risk consistent. Include rejected winners and rejected losers, not only successful reversals. Test trending, ranging and news-heavy environments. If the filter improves win rate but misses large trend profits, net expectancy can worsen. A higher percentage of winning trades does not automatically mean a better trading system.
WILLIAMS PERCENT RANGE FAQ
Is Williams %R the same as RSI? No. Is the normal Williams scale zero to minus one hundred? Yes under its usual formula. Does a reading below minus eighty guarantee an upward reversal? No. Can it stay near zero in a strong uptrend? Yes. Is it mathematically related to fast stochastic %K? Yes when configured comparably. Can a forming candle's oscillator reading change? Yes. The disciplined workflow remains H4 structure, H1 zone, optional oscillator context, completed M5 price trigger, structural Stop and risk-calculated volume.
PIPSEPAISA FREE COURSES
Explore Sir Sajid Khan Ghori's Free Forex Technical Analysis Course for price action, indicators and disciplined M5 confirmation, and Sir Ghulam Abbas's Free Forex Fundamental Analysis Course for major USD/Gold data. Current enrollment details at www.pipsepaisa.com Courses. Educational only; leveraged trading involves significant financial risks.
Read in Roman Urdu
WILLIAMS %R KYA HAI?
Williams Percent Range ya Williams %R Larry Williams se associated Momentum Oscillator hai. Ye current Close Price ko recent selected N-Bars ke Highest High aur Lowest Low ke relative calculate karta hai. Common Output zero se minus hundred tak. CCI ki tarah unbounded nahi. Indicator Gold XAUUSD, EUR/USD aur Forex Pairs par Price Momentum Position show karta hai. Lekin Next Candle future guaranteed predict nahi. H4/H1 Supply Demand aur completed M5 Confirmation zaroori.
WILLIAMS PERCENT R FORMULA
Formula Williams %R = −100 × (Highest High − Current Close)/(Highest High − Lowest Low) for selected Period. Close recent High ke near ho to Value zero ke near, Close recent Low ke near ho to -100 near. Highest=Lowest division zero edge platform handle kare. -20 reading account -20% loss ya +20% future profit nahi. Yeh mathematical price location indicator hai. EUR/USD Pip Value aur Gold Dollar Risk separate.
FORMULA NUMERICAL EXAMPLE
Hypothetical Highest High 110, Lowest Low 90 aur Close 106 ho to Williams %R = −100×4/20 = −20. Close 94 ho to −100×16/20 = −80. Ye examples Live Gold Price nahi. -20 indicator recent range top ke close ko suggest, -80 range lower area. Lekin Price Strong Trend Continue ya reverse both possible. Trading system rules and entry confirmation distinct.
MINUS 20 OVERBOUGHT ZONE
Williams %R -20 se above reading commonly Overbought label. Matlab Current Close selected Range High ke relatively near. Ye market guaranteed next Candle Sell nahi. H4 Strong Uptrend mein %R near zero several bars possible. Blind -20 par Sell against Trend risky. H1 Supply, confirmed M5 Bearish Engulfing/CHoCH aur structural SL required. Overbought label Bank distribution proof nahi.
MINUS 80 OVERSOLD ZONE
%R -80 below commonly Oversold, Price recent Lookback Low ke close. Lekin Gold Strong Sell Trend mein Indicator -90 for multiple Candles ho sakta. -80 touch = automatic Buy guaranteed nahi. H4 Downtrend aur H1 Lower Low active ho to continuation possible. Potential reversal Buy ke liye H1 Demand Reaction and M5 Full Bullish CHoCH/Engulfing. No Confirmation = No Trade.
TREND KE DORAN EXTREME LEVELS
Strong Gold Bullish Trend mein har new H1 candle high ke near close ho to %R above -20 persist. Bearish market near lows close ho to -80 below. Extreme Indicator reading reversal countdown timer nahi. Trend Following aur Mean Reversion two different strategies. Winning Screenshot ke baad logic change Bias. H4 Market Structure, H1 Zone and actual M5 Close important. Strategy type pehle decide.
LOOKBACK PERIOD 14
Williams %R Period 14 popular, but M5 N14 and H1 N14 different time window. N smaller Faster Signals more Whipsaws, N larger slower but broader range. Gold CPI News timeframe response EUR/USD quiet session se different. Last five Winning Charts par Best Period choose Overfitting. Out-of-Sample Backtest and Broker Spread include. Indicator settings all market guarantee nahi.
WILLIAMS VS STOCHASTIC
Williams %R aur Fast Stochastic %K math closely related. Same Highest High/Lowest Low Window par Williams %R = Fast %K − 100. Stochastic 80 roughly Williams -20, Stochastic 20 Williams -80. Lekin Smoothed Stochastic D Line different, exact signal matching not always. Both indicators add kar ke independent two confirmations count karna double-counting ho sakta hai. H1 Chart Location real added value.
WILLIAMS VS RSI
RSI Average Gains/Losses based, Williams Close relative recent High/Low. RSI70 aur Williams -20 mathematical same formula nahi. Dono Overbought highlight karte but different Price characteristics. H4 Strong Trend mein both extreme remain possible. Combined Filter Trade Count reduce, Win Rate automatically higher guaranteed nahi. Baseline H1 Demand + M5 CHoCH compare. Net R and Drawdown test.
MINUS 50 MIDPOINT
Williams -50 selected Highest-Lowest Range ke middle location ko represent karta hai. -80 se -50 move close low se away; but H4 Bullish Reversal guaranteed nahi. H1 Sideways Range mein frequent -50 Crosses Noise. Some Traders Directional Momentum Filter, direct Market Order nahi. M5 Full Engulfing/CHoCH and actual H1 Support levels confirm. Forex Entry after Candle Close discipline.
BULLISH DIVERGENCE
Price New Lower Low aur %R higher oscillator low under same Window, possible Bullish Divergence. Sell Momentum Weakening clue but Downtrend Reverse guaranteed nahi. Multiple Divs fail. H1 Demand zone and M5 completed Bullish CHoCH wait. H4 Lower High/Low intact ho to countertrend risk high. Swing Timestamp and Bar Completion. Structural SL relevant swing low.
BEARISH DIVERGENCE
Price Higher High but Williams %R Lower Oscillator Peak possible bearish divergence. H1 Supply ke qareeb risk warning, not automatic Sell. Trend Strong ho to oscillator near zero saturate; peaks compare tricky. M5 Bearish Engulfing/CHoCH Full Close, swing high structural SL and target H1 Demand. Divergence alone Bank Sell Orders proof nahi. No Confirmation = No Trade.
RANGE MARKET WILLIAMS
H1 Sideways Range ke bottom Demand aur Top Supply defined ho to Williams %R overbought/oversold Context helpful. Range Bottom near -80, M5 Bullish Confirmation conditional Buy; range Top -20 near M5 Bearish setup Sell possible. Lekin News Breakout range destroy kar sakta hai. Fixed SL structure beyond, nearby opposite range Target. Trend Break ho to no mean-reversion forced entry.
TREND FOLLOWING WILLIAMS
H4 HH/HL Uptrend, H1 Demand Pullback, Williams %R oversold recovery, M5 Bullish Engulfing Full Close possible trend continuation candidate. But H4 Supply near ho to target room small. Oscillator cross alone no. H4 Downtrend reverse concept for Sell. Same rules all Trades. Stop Swing, risk small lot. News Calendar check.
GOLD WILLIAMS BUY
Gold H4 Bullish, H1 P+ Buying Zone Retest, M5 Williams -80 below se -50 toward rise, completed Bullish Engulfing and Higher Low. Conditional Buy with SL Swing Low below and TP nearest H1 Supply. Gold Broker Contract Size/Equity Risk lot. CPI imminent ho to No-News Filter Entry prohibit. Oscillator improving guaranteed Gold Rally nahi. Educational only.
EUR/USD WILLIAMS SELL
EUR/USD H4 LH/LL, H1 Supply Retest, Williams near -20 during pullback then falls with M5 bearish CHoCH Full Close. Conditional Sell, SL actual Swing High above, TP H1 Demand. ECB Rate News unexpected stronger EUR create reversal. Spread wide ho to No Trade. Indicator history exact turning point live perfect fill guarantee nahi. Net R journal.
FORMING CANDLE ALERT
M5 Current Candle form ho to Williams %R latest Close changing, -20 line cross then reverse before Candle finish possible. Closed-Bar Strategy if required uses completed M5 value. Alert Once Per Bar Close important. MT5 EA Indicator Buffer index 1 previous completed bar, index 0 forming bar under standard indexing conventions. Formula future data use zaroori nahi, normal real-time updates. Hindsight winning Signal screenshot inaccurate.
TRADINGVIEW MT5 WILLIAMS
TradingView Williams %R aur MT5 iWPR Indicator chosen Period, Data Feed and Timezone align hon. Different Broker Gold OHLC, missing Candles ya Bar Index output difference. EA Signal closed bar after indicator readiness. Actual Orders Bid/Ask, Williams -20 Quote Price nahi. Contract Volume, StopLevel and Spread check. Automatic strategy with Martingale Recovery Risk still. Unverified 99% Win Claims avoid.
NEWS WILLIAMS RISK
CPI NFP Fed News par XAUUSD huge M1 Candle, Williams -80 se near zero within seconds possible. Extreme value strong Price Repricing, exhaustion guaranteed nahi. Broker Spread/Slippage. Entry chase small account high Risk. First M5 Full Close ke baad H1 zone target room evaluate. News Filter and Equity Risk. No Trade acceptable if unstable.
WILLIAMS BACKTEST
Baseline H4 Trend + H1 Zone + M5 Confirmation vs With Williams %R Filter. Same Data Period, Broker Spread, SL/TP, Lot Risk. Filter Avoided Losers and Missed Winners both record. Trending, Sideways and News Regimes. Win Rate higher but Net R lower possible if best winners missed. Statistical Sample Size and Drawdown important. Only Screenshot winners proof nahi.
WILLIAMS FAQ
Williams RSI same? Nahi. Normal Scale zero to -100? Haan. -80 guaranteed Buy? Nahi. Strong Bull Trend near zero sustain? Haan. Fast Stochastic related? Haan. Forming Bar Value change? Haan. Final Workflow H4 Structure → H1 P+ Buying/Selling Zone → Williams context → M5 Full Engulfing/CHoCH → SL/Lot/TP. No Confirmation = No Trade.
PIPSEPAISA FREE COURSES
Sir Sajid Khan Ghori ka Free Forex Technical Analysis Course aur Sir Ghulam Abbas ka Free Forex Fundamental Analysis Course ki current details www.pipsepaisa.com Courses par. Ye educational content hai, personal investment advice nahi. Capital Loss possible.
WILLIAMS INDICATOR KO OVEROPTIMIZE NA KAREIN
Gold XAUUSD ke kuch selected Winning Examples dekh kar Williams Period 7 ya 14 ko perfect number declare na karein. 2026 Trend Conditions aur older sideways Months different. Trading Costs, Commission, Overnight Swap and Spread results change kar sakte hain. Agar Strategy High Win Rate but winners small aur SL huge ho to negative expectancy. Every Losing Trade and No Fill included in Journal. One Indicator alone permanent A++ Entry Probability guarantee nahi.
WILLIAMS -20 -80 PRACTICAL CONFIRMATION
Williams -80 below aur Gold H1 Demand touch kar rahi ho, M5 Candle Full Close Bearish hi ho to Price Confirmation absent. Just Oscillator Oversold par Buy Early Entry. Actual M5 Higher Low plus Bullish Engulfing/CHoCH wait karein. Opposite Sell at H1 Supply with -20 Reading and M5 bearish Close. Structural Stop Swing beyond aur Target Opposite H1 level. Agar Stop Distance risk budget exceed to Lot reduce ya skip. News Calendar and Broker Spread always relevant.
MULTIPLE SYMBOLS SAME TIME
EUR/USD, GBP/USD aur Gold simultaneously USD Weakness Theme trade karein to Portfolio Risk correlated possible. Williams har chart oversold/overbought show kar sakta hai, lekin independent diversification prove nahi. Total Risk at all Stops calculate. Fed News par correlated losses simultaneous. Funded Account Daily Drawdown Rule and MT5 Margin check. Recovery doubling in losing series substantial risk. No Confirmation = No Trade.
Educational content only. Trading involves risk. Always use independent analysis and appropriate risk management.