
Candlestick Patterns in Forex: Anatomy, Context and Confirmation
PipSePaisa • Forex Education & Research
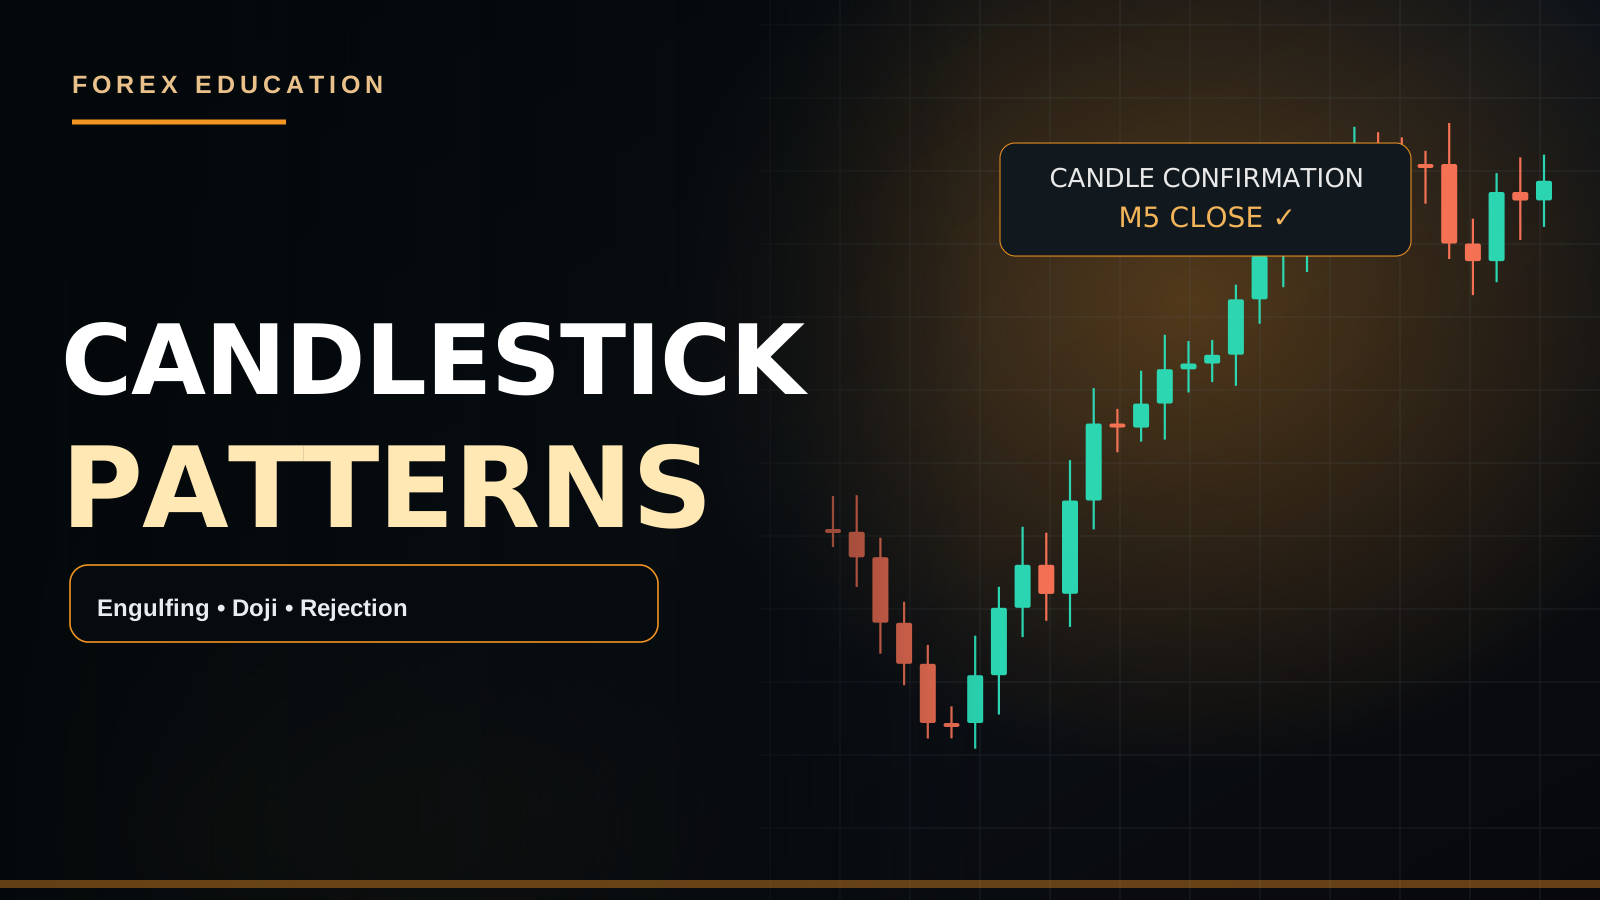
INTRODUCTION
A candlestick summarizes the open, high, low and close of a trading period. Candles show the balance of buying and selling during that period, but pattern names alone do not predict the future. Interpretation is stronger when location, higher-timeframe trend and follow-through are considered together.
1. CANDLE ANATOMY
The real body spans open to close. An upper wick records a higher traded price during the interval; a lower wick records a lower one. A long upper wick can indicate rejection from above, but could also reflect temporary volatility. A completed candle offers more reliable information than a still-forming one.
2. COMMON SINGLE-CANDLE PATTERNS
A doji has a small body relative to its range and can indicate indecision; it is not automatically a reversal. A hammer has a small body near the upper portion and a long lower wick. Its significance depends on appearing after a decline and receiving confirmation. A shooting star is the broadly opposite shape in an upward context.
3. TWO-CANDLE PATTERNS
A bullish engulfing pattern often describes a bullish body engulfing the prior bearish body. Check whether the current candle genuinely closes, where the pattern forms and whether spread or gaps distorted the body. Bearish engulfing is the inverse. Piercing line and dark-cloud cover are other context-dependent reversal structures.
4. CONTINUATION PATTERNS
Inside bars, small consolidations and rising sequences of closes can indicate pauses within trends. A strong move after consolidation still requires attention to nearby opposing zones and available reward.
5. EXAMPLE: DEMAND-ZONE CONFIRMATION
Assume EUR/USD returns to an H1 demand area. On M5, price forms a long lower wick and then a bullish candle closes above the previous candle's high. This may support a bounce hypothesis. The idea weakens if price breaks below the rejection swing low. No one pattern guarantees success.
6. ENTRY AND RISK
Select a trigger such as a closed engulfing candle, place invalidation relative to nearby structure, and check the target before entry. Skip trades where a huge confirmation candle leaves an excessively wide stop or poor reward.
7. COMMON ERRORS
Treating every doji as a reversal, analyzing unfinished candles, memorizing shapes without location, and ignoring liquidity around news are frequent mistakes.
FAQ
Which pattern is best? No pattern wins consistently in every context. Is a candle close necessary? A close avoids interpreting a still-changing shape as final.
CANDLESTICK ANATOMY IN DETAIL
A candle records the Open, High, Low and Close over a chosen interval. The body covers Open to Close; wicks show the extremes during that interval. A green candle may close above its open without proving a sustained bullish trend. A long lower wick can show price was rejected below, but interpretation changes when it occurs in the middle of a range versus at established demand.
DOJI, HAMMER AND SHOOTING STAR
A Doji has a small body relative to its full range, suggesting uncertainty. A Hammer after a decline has a long lower shadow and relatively small body near the upper end. A Shooting Star near an advance has a long upper shadow. These definitions are shapes plus context, not automatic reversal signals. Seek a subsequent completed candle and structure support.
BULLISH AND BEARISH ENGULFING
A bullish engulfing typically has a bullish real body engulfing the previous bearish real body; the bearish version reverses those conditions. A wick extending beyond another wick is not necessary for a body-engulfing definition. If the third candle closes above the prior body but remains below its wick, do not confuse body engulfing with full-range engulfing. State which rule you use before testing.
PIERCING, DARK CLOUD AND KICKER
Piercing Line generally involves a bullish reversal candle that closes meaningfully into the prior bearish body; Dark Cloud Cover is its bearish counterpart. Kicker patterns describe a sharp shift in opening and direction, but classic gaps are less common and differently interpreted in continuously traded forex than in stock markets. Context and execution still dominate the label.
DEMAND ZONE EXAMPLE
Assume Gold reaches a pre-marked H1 demand zone. An M5 candle forms a lower wick but has not closed. Waiting avoids treating a temporary shape as a settled rejection. If the candle closes and a later bullish engulfing breaks local structure, the bullish case gains context. Invalidation remains under the meaningful low, and the potential target must justify that stop.
CONTINUATION PATTERNS
Inside bars and narrow consolidations sometimes indicate pauses before a trend continues. An inside-bar breakout against a nearby H4 supply zone may fail despite an attractive candle pattern. Higher timeframe bias, news timing and the nearest liquidity area matter.
COMMON QUESTIONS
Is any one candlestick pattern guaranteed? No. Why wait for a candle close? Because open-candle bodies and wicks change. Can multiple candles create one reversal setup? Yes, but the full sequence must be defined consistently.
CANDLE CLOSES CONTAIN MORE INFORMATION THAN CANDLE SHAPES ALONE
An M5 candle records transactions or broker price changes over a five-minute interval, but during that interval its high, low and closing price are not final. A candle that looks like a strong bullish engulfing at minute three may end as a doji or bearish bar. If a strategy is tested on completed candles, taking live entries before the close creates a different strategy. Separate observation of a forming candle from confirmation of a closed one.
BODY, WICK AND LOCATION
Consider a candle with Open 1.1000, High 1.1020, Low 1.0980 and Close 1.1010. Its bullish real body spans 1.1000–1.1010, upper wick reaches 1.1020 and lower wick reaches 1.0980. A long lower wick may indicate rejection of prices below, but it says little about future direction without the prior trend and nearby level. At H1 demand it may strengthen a bullish hypothesis; directly under strong H4 supply it may be less meaningful.
DOJI AS INDECISION, NOT AN ENTRY SIGNAL
A doji describes a small real body relative to the full range. It can appear before a reversal, a continuation or a sideways pause. A doji following a long uptrend near resistance may highlight an unresolved contest, but a trader still needs subsequent evidence. If the next candle closes strongly higher and establishes new structure, a reflexive Sell because of the doji would have ignored follow-through.
HAMMER AND SHOOTING STAR
A hammer typically has a small body near the upper part of its range and a long lower shadow, most interesting after a decline. A shooting star generally has a long upper shadow in an upward context. Neither is guaranteed: a long wick can result from news-related volatility rather than stable buying or selling pressure. An actual follow-through close and sensible structural invalidation matter more than memorizing names.
ENGULFING: BODY VERSUS FULL RANGE
In a common two-candle bullish engulfing definition, the second bullish real body surrounds the previous bearish body. It is not compulsory for the bullish candle's wick to exceed every wick of the earlier bar. Traders who instead demand full-candle-range engulfing must state that clearly. On a still-forming candle, both classifications can change. Use the completed candle and a consistent definition in testing.
THREE-CANDLE REVERSAL SEQUENCES
Morning-star and evening-star structures involve an initial directional candle, a smaller transitional candle and a strong candle in the opposite direction. Classic equity-market examples sometimes include price gaps; spot Forex trades for long sessions and may show fewer comparable gaps. Do not mechanically apply a stock-chart definition without considering the market's trading hours. The location at an H1 zone and follow-through are still crucial.
PIERCING LINE VS BULLISH ENGULFING
A piercing-line pattern generally involves a bullish candle closing significantly into the previous bearish body, but not necessarily fully engulfing it. An engulfing candle's real body surrounds the previous real body. These distinctions matter when studying which examples meet a strategy's entry rule. If every partial recovery is called engulfing, backtest outcomes become hard to reproduce.
KICKER AND GAP-BASED PATTERNS
The kicker concept describes a sharp shift in market direction, often with a pronounced gap in classical definitions. Continuous Forex trading and different broker session boundaries make some equity-style gap patterns less directly comparable. The label alone does not predict return distribution. Ask whether the sudden change followed an economic surprise, liquidity discontinuity or a meaningful structural shift.
A LONG SETUP AT H1 DEMAND
Assume Gold reaches an H1 demand area after a controlled pullback. M5 first produces a long lower wick, followed by a bullish engulfing candle that closes above local structure. A candidate long may be assessed only if a structural stop below the low and a realistic target beyond entry offer acceptable planned risk. If the engulfing candle is exceptionally large and the next resistance is nearby, the setup may no longer be attractive.
A BEARISH SETUP AT SUPPLY
Suppose EUR/USD rallies into H1 supply while the broader H4 structure is bearish. M15 closes with an upper-wick rejection and M5 forms a lower high followed by a bearish real-body engulfing. That is a more contextual bearish scenario than an isolated red candle in the middle of a range. The bearish idea is weakened if price reclaims the supply and closes above the relevant swing.
TESTING WITHOUT HINDSIGHT
Collect screenshots from before the trigger forms and from after the candle closes. Label timeframe, location, trend direction, Spread, Stop Loss and target. Measure how frequently the pattern occurred without a nearby key zone versus at the zone, and compare outcomes after transaction costs. Some attractive patterns fail often; trading education must acknowledge that uncertainty rather than promising a guaranteed candle.
CANDLESTICK FAQ
Is every three-candle pattern engulfing? No. If the third candle closes above the earlier body but below its upper wick, is full-range engulfing confirmed? No, although a body-based definition might differ. Can a doji be bullish? It indicates small net progress or indecision, so broader context decides. Does 'No Confirmation = No Trade' apply? Yes, when your tested method requires a completed confirmation candle.
CONCLUSION
Candlestick patterns describe behavior. Combine the description with structure, zones, execution costs and a documented risk plan.
FREE FOREX COURSES AT PIPSEPAISA
Learn Technical Analysis with Sir Sajid Khan Ghori (Free Forex Technical Analysis Course). Want to join? Message our team on WhatsApp or go to the Courses tab at www.pipsepaisa.com to enroll.
Learn Fundamental Analysis with Sir Ghulam Abbas (Free Forex Fundamental Analysis Course). Message our team on WhatsApp or use the Courses tab for enrollment.
DISCLAIMER
This educational guide uses hypothetical examples, not trading signals or personal investment advice. Leveraged products carry substantial risk.
Read in Roman Urdu
INTRODUCTION
Candlestick ek selected time period ki Open, High, Low aur Close prices show karti hai. Candle ka naam dekh kar blind trade nahi leni chahiye. Pattern ka context aur confirmation zyada important hai.
1. CANDLE ANATOMY
Body Open aur Close ke darmiyan hoti hai; upper aur lower wick us period ke extremes show karti hain. Long upper wick selling rejection indicate kar sakti hai, lekin news volatility bhi ho sakti hai. Candle complete hone ka wait karein.
2. SINGLE CANDLE PATTERNS
Doji mein body chhoti hoti hai aur indecision nazar aa sakti hai. Hammer aksar fall ke baad long lower wick ke saath dekha jata hai. Shooting Star upward context mein warning de sakta hai. In mein se koi guaranteed reversal nahi.
3. TWO-CANDLE PATTERNS
Bullish Engulfing mein bullish candle ki body previous bearish body ko cover karti hai. Bearish Engulfing inverse hai. Pattern close hua hai? Important level par bana hai? Ye check karna zaroori hai.
4. CONTINUATION
Inside Bar aur small consolidation trend ke andar pause represent kar sakte hain. Breakout ke baad opposite zone aur reward distance check karein.
5. PRACTICAL EXAMPLE
EUR/USD H1 demand zone mein aaye, M5 par lower wick reject ho aur next bullish candle previous high ke upar close kare to possible bounce ka clue mil sakta hai. Rejection swing low break ho to idea weak ho sakta hai.
6. RISK MANAGEMENT
Entry trigger candle close ke baad plan karein. SL nearby structure ke beyond aur TP next logical area par ho. Bohat bari candle ki wajah se RR poor ho to trade skip karein.
COMMON MISTAKES
Har Doji ko reversal samajhna, open candle par entry, context ignore karna aur news ke waqt weak pattern use karna avoid karein.
FAQ
Best candle kaun si hai? Koi guaranteed best nahi. Close important kyun? Candle complete hone tak shape change hoti rehti hai.
CANDLESTICK ANATOMY DETAIL MEIN
Har candlestick ek timeframe ki Open, High, Low aur Close prices dikhati hai. Body Open aur Close ke darmiyan hoti hai; Wick us waqt ke extremes show karti hai. Green candle hone ka matlab full uptrend confirm nahi. Long lower wick buying rejection ka clue ho sakti hai, lekin same wick range ke middle mein aur H1 Demand par different meaning rakh sakti hai.
DOJI, HAMMER AUR SHOOTING STAR
Doji ki Body full range ke muqablay chhoti hoti hai, jis se indecision ka clue milta hai. Hammer fall ke baad long lower wick aur upper side chhoti body ke saath aa sakti hai. Shooting Star rise ke baad long upper wick show karti hai. Ye shapes guaranteed reversal nahi. Next completed candle aur market structure se confirmation dekhein.
ENGULFING KO SAHI SAMJHEIN
Bullish Engulfing mein bullish candle ki Real Body previous bearish body ko cover karti hai. Bearish Engulfing opposite hai. Agar next candle previous Body ke upar close kare lekin Wick ke upar na kare, to Body Engulfing aur Full Range Engulfing ka farq samjhein. Strategy mein pehle specify karein kis definition ko use kar rahe hain.
PIERCING, DARK CLOUD AUR KICKER
Piercing pattern mein bullish reversal candle previous bearish body ke andar meaningful close kar sakti hai. Dark Cloud Cover bearish counterpart hai. Kicker sharp direction change describe karta hai, lekin stock-market gaps aur 24-hour Forex market ki behavior different hoti hai. Label se zyada context important hai.
DEMAND ZONE PRACTICAL EXAMPLE
Gold H1 Demand Zone mein enter hoti hai. M5 candle lower wick bana rahi hai lekin abhi close nahi hui. Jaldi Buy karne ke bajaye candle completion ka wait karein. Agar bullish Engulfing close ho aur local swing high break ho, to bullish case stronger ho sakta hai. SL important low ke beyond aur TP realistic opposite zone par evaluate karein.
CONTINUATION PATTERNS
Inside Bar aur tight consolidation trend ke andar pause ho sakti hain. Lekin H4 Supply ke bilkul neeche bullish breakout weak ho sakta hai. News, trend aur liquidity area saath dekhein.
FAQ
Kya koi candle guaranteed kaam karti hai? Nahi. Close ka wait kyun? Candle ki final shape close se pehle badal sakti hai. Kya three-candle reversal possible hai? Haan, objective rules zaroori hain.
OPEN CANDLE AUR CLOSE CANDLE KA FARQ
M5 candlestick five-minute period ka Open, High, Low aur Close show karti hai. Lekin jab candle abhi ban rahi ho to iska High, Low aur temporary Close change hota rehta hai. Minute three par bullish Engulfing lagne wali candle minute five par Doji ya bearish ban sakti hai. Agar aapki backtested strategy Completed Candle par based hai aur Live mein open candle par entry lete hain to aap strategy rules change kar rahe hain. Is liye 'Wait for M5 Candle Close' ko serious confirmation rule samjhein.
BODY, WICK AUR LEVEL
Maan lein Candle Open 1.1000, High 1.1020, Low 1.0980 aur Close 1.1010 hai. Bullish Body 1.1000 se 1.1010 tak hai, Upper Wick 1.1020 aur Lower Wick 1.0980 tak. Long Lower Wick possible rejection show kar sakti hai, lekin future direction guarantee nahi. Agar candle H1 Demand par ban rahi hai to context alag, aur strong H4 Supply ke just neeche ban rahi hai to interpretation alag ho sakti hai.
DOJI KA REAL MEANING
Doji mein Open aur Close close hote hain, yani real body comparatively small. Iska matlab market ke buyers aur sellers ke darmiyan uncertainty ho sakti hai. Lekin Doji ke baad reversal, continuation ya sideways, teeno possible hain. Long uptrend ke baad Resistance par Doji aaye to watchlist warning ho sakti hai, immediate Sell signal nahi. Next candle strong bullish close de to Doji ke against Sell karna weak decision ho sakta hai.
HAMMER AUR SHOOTING STAR
Hammer generally falling market ke baad Small Body aur Long Lower Wick ke saath dekhi jati hai. Shooting Star upward context mein Small Body aur Long Upper Wick describe karti hai. In candles se temporary rejection nazar aa sakti hai. Lekin news-driven wick aur genuine gradual buying pressure ko differentiate karna hoga. Next Completed Candle aur structural invalidation ke baghair pattern name se trade na lein.
ENGULFING BODY AUR FULL RANGE
Common Bullish Engulfing definition mein second bullish candle ki Real Body previous bearish Body ko cover karti hai. Iska matlab ye zaroori nahi ke new candle ka Upper Wick previous candle ke har Wick ke upar ho. Agar aap Full Range Engulfing require karte hain to ye separate stronger criterion hai. Strategy mein ek definition select kar ke consistently use karein. Open Candle ki Body temporary hoti hai, is liye close ka wait karna important hai.
THREE-CANDLE REVERSAL PATTERNS
Morning Star aur Evening Star mein aam tor par pehle directional candle, phir chhoti transition candle, phir opposite direction strong confirmation candle hoti hai. Traditional Stock examples mein overnight gaps important ho sakte hain, lekin Forex market nearly continuous sessions mein trade karti hai. Is liye gaps ki frequency aur behavior different hota hai. Pattern ko blindly Stock rules se Forex par copy na karein; H1 Support/Supply aur market direction bhi dekhna hoga.
PIERCING LINE VS ENGULFING
Piercing Line mein bullish candle previous bearish Body ke andar meaningful recovery close deti hai, lekin full Real Body Engulfing zaroori nahi. Bullish Engulfing definition mein next bullish Body previous bearish Body ko surround kar sakti hai. Agar har partial green candle ko Engulfing label karenge to aapki backtesting reproducible nahi hogi. Conditions likhein: previous Body size, new candle close kahan, trend kya, level kya aur next confirmation kya.
KICKER PATTERN KI LIMITATION
Kicker pattern classical technical analysis mein sudden strong directional shift aur gap-based behavior ke saath describe hota hai. Forex mein trading hours aur broker daily session timings stock exchange se different hain. Is liye exact same gap pattern har broker par nahi milega. Sirf naam 'Bullish Kicker' dekh kar Buy aur 'Bearish Kicker' dekh kar Sell karna safe nahi. Economic surprise, structure change aur volatility ka context samjhein.
DEMAND ZONE PAR BULLISH SETUP
Gold H1 Demand Zone ki taraf pullback kar rahi hai. M5 pehle lower wick banati hai. Phir completed Bullish Engulfing local swing high ke upar close hoti hai. Ye possible Buying Confirmation ho sakti hai. Lekin SL relevant rejection low ke neeche rakh kar Risk Calculate karna hoga. Agar Confirmation Candle bohat huge hai aur nearest Resistance qareeb hai to RR weak hoga. Aisi situation mein setup skip karna bhi professional decision hai.
SUPPLY ZONE PAR BEARISH SETUP
EUR/USD H1 Supply Zone tak rally karti hai aur H4 structure overall bearish hai. M15 upper wick rejection close deti hai. M5 Lower High aur Bearish Engulfing ka completed close milta hai. Ye isolated red candle se zyada structured bearish scenario hai. Lekin agar price strong close de kar Supply reclaim kare to bearish idea weak ho sakta hai. Is liye Stop Loss ko actual swing ke beyond aur Target ko next Demand tak context mein plan karein.
CANDLESTICK BACKTEST KAISE KAREIN?
Har valid setup ka screenshot trigger se pehle aur after candle close save karein. Timeframe, H1 Zone, H4 Trend, Candle Type, Spread, SL aur TP record karein. Dekhein same pattern range ke middle mein kitni baar fail hota hai aur valid zone par kitni baar meaningful reaction deta hai. Transaction Costs include karein. Sirf winning candles select karna misleading hota hai. Strategy edge tab evaluate hoti hai jab losing examples bhi record hon.
FAQ
Kya three-candle pattern hamesha Engulfing hota hai? Nahi. Third Candle body se upar close magar wick se neeche ho to Full Range Engulfing? Nahi; Body-based definition different ho sakti hai. Doji guaranteed Buy/Sell? Nahi. Kya completed close important? Haan, agar strategy confirmation par dependent ho. No Confirmation = No Trade.
CONCLUSION
Candlestick ko zone, market structure aur controlled risk ke saath analyse karein.
PIPSEPAISA FREE COURSES
Sir Sajid Khan Ghori ka Free Forex Technical Analysis Course join karne ke liye WhatsApp par message karein ya www.pipsepaisa.com ke Courses tab mein enrollment karein.
Sir Ghulam Abbas ka Free Forex Fundamental Analysis Course bhi WhatsApp ya Courses tab se join kar sakte hain.
DISCLAIMER
Ye guide educational hai. Examples live signals ya personal financial advice nahi. Trading mein capital lose ho sakta hai.
Educational content only. Trading involves risk. Always use independent analysis and appropriate risk management.