
Bollinger Bands in Forex: Volatility Squeeze, Band Walk and Breakout Confirmation
PipSePaisa • Forex Education & Research
INTRODUCTION
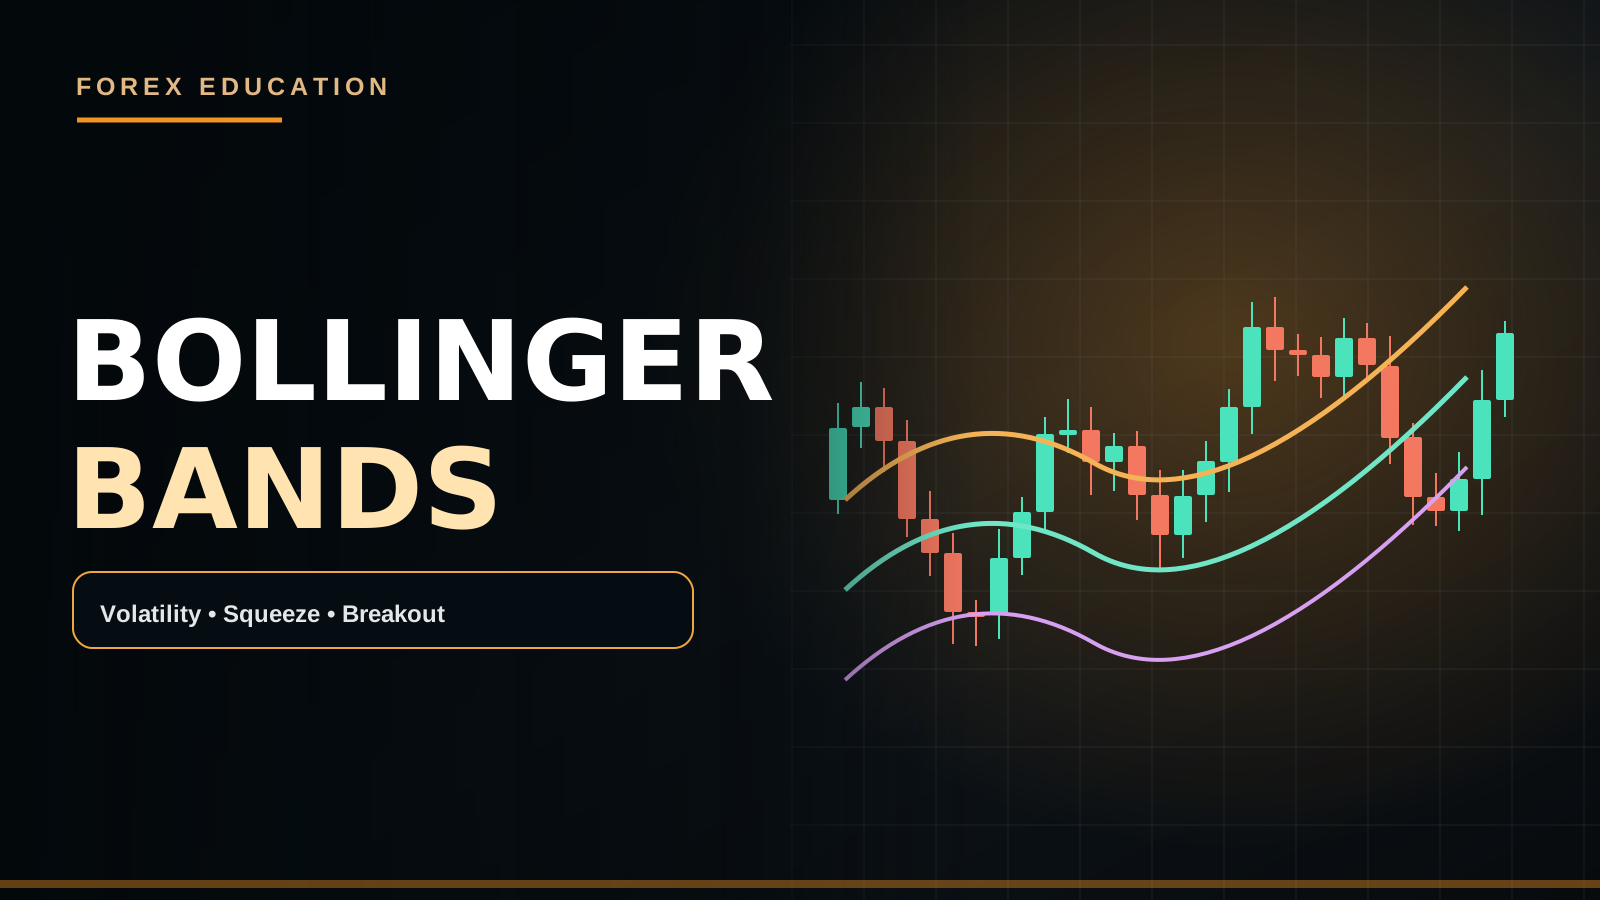
Bollinger Bands typically plot a twenty-period moving average and upper/lower boundaries based on two standard deviations. The width adapts to historical volatility, so narrowing bands signal compression, not a guaranteed breakout direction.
PRACTICAL MARKET EXAMPLE
A squeeze in EUR/USD may precede an important data release. Price could break either side or whipsaw through both; an H1 range and M15 completed close can define whether the trade hypothesis truly emerged.
IMPORTANT LIMITATIONS
Touching an upper band does not automatically mean overbought; trends can walk along a band while price continues.
THE CENTER LINE AND THE TWO BANDS
A conventional Bollinger Band setup uses a twenty-period simple moving average with an upper band two standard deviations above and a lower band two standard deviations below the mean. Standard deviation summarizes how spread out the observed prices have been relative to the average. As recent prices become more dispersed, the envelope generally widens; when movement contracts, it narrows. These parameters are adjustable, and different data series or price inputs can produce slightly different charts. The bands quantify historical variation rather than setting a law about where price must turn.
WHAT A BOLLINGER SQUEEZE MEANS
A squeeze occurs when the distance between upper and lower bands becomes relatively narrow compared with a chosen previous window. It indicates recent compressed volatility, not the direction of the next move. A short squeeze can be followed by continued sideways trading or a false breakout. If an important US release is approaching, volatility may expand suddenly after the data but its first direction may not last. The method requires a defined measurement window and a plan for breakout confirmation.
BAND WIDTH AND THE STANDARD DEVIATION PROBLEM
BandWidth can be computed as the distance between upper and lower bands relative to the middle-band value, depending on the chosen formula. If a symbol's price scale or market regime changes, raw width comparisons can be misleading. A squeeze can be defined by its historical percentile rather than declaring any narrow visual appearance valid. Avoid drawing only successful examples after the fact. Record whether the width condition genuinely met your fixed rule before the movement.
THE BAND WALK IN A STRONG TREND
When price trends powerfully upward, repeated candles can close near the upper Bollinger Band. This is sometimes called walking the band. Selling every upper-band touch can lead to repeated countertrend losses. During sustained declines, price may hug the lower band similarly. The important question is whether the market is showing continuation with higher highs or lower lows, or whether momentum is actually shifting near an important opposing zone. An oscillator cannot substitute for meaningful structural evidence.
MEAN REVERSION INSIDE A RANGE
In a well-defined H1 range, a trader might study reversion toward the middle band after a confirmed rejection near the outer band and horizontal resistance. But if price begins establishing higher lows and breaks the upper boundary, the range premise weakens. A band-reversion strategy should define when range conditions exist, what candle close confirms a return, where the stop belongs and whether the available reward outweighs spread. This method is not identical to a Bollinger breakout strategy.
AN ILLUSTRATIVE EUR/USD SQUEEZE
Suppose EUR/USD consolidates from 1.1020 to 1.1050 while its twenty-period bands contract. A bullish M15 candle closes above the upper range boundary at 1.1050, then a subsequent pullback holds that region. This could form a conditional breakout-retest setup. However, if H4 Supply begins at 1.1060, reward distance may be too limited for the logical Stop Loss. A breakout candle is not automatically an acceptable entry just because the bands expanded.
A GOLD LOWER-BAND EXAMPLE
Imagine Gold is in an H4 uptrend but pulls back toward H1 Demand. A large bearish candle touches the lower M15 Bollinger Band. Buying immediately because the lower band was reached is risky: price might be forming a new bearish leg. If selling momentum slows, H1 Demand holds and a completed M5 bullish engulfing breaks a local lower high, the setup has additional price-action confirmation. A Stop Loss still belongs at meaningful invalidation rather than at the lower-band line.
WHAT EXPANDING BANDS TELL YOU
After a strong breakout, both bands may widen as recently observed closing prices become more dispersed. Expansion describes a change that has already occurred in volatility; it does not prove a healthy continuation. A false breakout can also generate temporarily expanding bands. Pair the observation with whether price holds outside the old range, whether the next pullback succeeds, and how much room exists until an opposing supply or demand level. Price structure and net trading costs remain essential.
UPPER OR LOWER BAND TOUCH IS NOT A LIMIT ORDER
A trader who sets Sell Limits at every upper band and Buy Limits at every lower band is assuming mean reversion without checking regime. That can work poorly when a trend persists. A conservative strategy might allow countertrend band trades only after a completed H1 rejection at a major horizontal zone and M5 confirmation. A trend trader may instead buy a successful pullback to the middle band during an existing H4 uptrend. Different rules produce different risk and expectancy.
BOLLINGER BANDS WITH RSI
Combining an upper band with RSI Overbought can look like dual confirmation, but both indicators derive from past prices. They may be responding to the same strong rally. Their agreement does not independently show that sellers have appeared. Consider whether previous H1 highs were swept and reclaimed, whether M5 has formed a Lower High and whether an H4 Supply zone offers a clear invalidation point. A system should measure the added value of RSI rather than assuming more indicators guarantee accuracy.
NEWS EVENTS AND FALSE BREAKOUTS
CPI, NFP and central-bank announcements can cause a rapid volatility expansion that breaks both a range and the bands. Slippage and sudden spread changes may damage a small-risk scalping model. If the news contradicts an earlier market expectation, the first breakout candle may reverse entirely. A plan can exclude the release window and observe a fresh range afterward. Any such filter should be applied consistently when backtesting, not selectively after viewing the winning days.
A TESTABLE BREAKOUT SYSTEM
First define the Bollinger period, standard-deviation multiplier and minimum squeeze threshold. Second mark a genuine H1 price range. Third require a completed close beyond the range, not merely a wick outside the band. Fourth consider whether a retest of broken Support/Resistance is required. Fifth use M5/M15 confirmation as defined. Sixth calculate Stop Loss using the actual setup and evaluate target space. Finally journal the net R result. A missed trade can be a valid consequence of a conservative plan.
A TESTABLE REVERSION SYSTEM
Define which H1 market regimes count as sideways, how close price must be to the upper/lower band, and which horizontal zones support the trade idea. Specify whether the candle must close back inside the band. Use a stop beyond structural invalidation and target either a middle-band area or independently marked opposing structure. Measure how often a trend breakout invalidates the range thesis. Avoid merging mean-reversion winners with breakout winners as though they came from one fixed set of entry rules.
PERIOD SETTINGS AND OVERFITTING
Changing the period from twenty to ten makes the average respond faster and can increase sensitivity to recent price changes. Altering the standard-deviation factor changes how often prices touch the envelope. Neither adjustment necessarily improves trading. Compare parameters using out-of-sample data after selecting the initial model. Check several market regimes, not only the period that produced perfect textbook squeezes. Spread, commission and Stop Loss slippage must be included in performance comparisons.
BOLLINGER FAQ
Do narrow bands guarantee a large move tomorrow? No. Does touching the upper band mean Sell? No. Can bands widen during a losing fakeout? Yes. Does an expanding envelope identify whether price is bullish or bearish? Not by itself. Are all squeezes equal across different pairs? No. Can an H1 Bollinger method be used without understanding H4 direction? It can be studied, but ignoring larger structure may hide important risk.
NUMERICAL BAND CALCULATION
Suppose the twenty-period SMA of an illustrative instrument is 1.1000 and the standard deviation of its chosen price series is 0.0020. Under a two-standard-deviation envelope, the upper band would be 1.1040 and lower band 1.0960. The full width is 0.0080, or eighty pips on a typical EUR/USD quote. If volatility later falls, the standard deviation may shrink and bring the two outer bands closer. This mathematical example measures historical variation, not a prediction that 1.1040 must act as Resistance.
SQUEEZE FILTER EXAMPLE
Rather than declaring every visually tight envelope a squeeze, a testable model could mark a squeeze only when today's BandWidth is among the narrowest readings of the last fifty completed candles. That threshold is illustrative and should not be assumed optimal. The trader still must distinguish direction: the price needs a completed range break, a location with adequate target space, and perhaps a successful retest. Two-sided CPI whipsaws can break both boundaries before the market stabilizes.
A TRADE THAT LOOKS GOOD BUT IS WRONG TO TAKE
Assume Gold breaks the upper band in a bullish candle after London opens. The Stop Loss beneath the real rejection swing would require an unusually wide distance, while the previous-day high and H4 Supply lie only a short way above. Even if Price continues another small distance, the available planned reward may not justify the risk. A responsible system can recognize breakout momentum and still decline the entry. A band touch, squeeze, or expansion does not override money management.
PIPSEPAISA FREE COURSES
For structured technical analysis education, explore the Free Forex Technical Analysis Course with Sir Sajid Khan Ghori. To understand the economic context behind Forex and Gold, explore the Free Forex Fundamental Analysis Course with Sir Ghulam Abbas. Visit www.pipsepaisa.com and select Courses for enrollment instructions. Courses and trading content cannot guarantee profit.
RISK DISCLAIMER
This is for education only. No indicator, chart pattern or economic release guarantees a trading outcome. Always calculate potential account loss, consider spreads and slippage, and wait for completed confirmation before trading.
Read in Roman Urdu
INTRODUCTION
Bollinger Bands usually 20-Period Moving Average ke aas paas 2 Standard Deviations ki Upper/Lower Bands show karti hain. Bands narrow hona volatility compression ka clue hai, guaranteed bullish ya bearish breakout nahi.
PRACTICAL EXAMPLE
EUR/USD mein Bands Squeeze ho to price kisi bhi side Breakout de sakti hai. H1 Range aur M15 Completed Close se actual directional confirmation evaluate karein.
LIMITATIONS
Upper Band touch hona automatic Sell nahi; Strong Trend mein Price Upper Band ke saath multiple candles continue kar sakti hai.
BOLLINGER BANDS KI THREE LINES
Conventional Bollinger Bands mein middle 20-Period SMA hoti hai. Upper Band middle Average se 2 Standard Deviations upar aur Lower Band neeche hoti hai. Standard Deviation selected Prices ki dispersion measure karti hai. Market Price Movement larger ho to Envelope generally wide hoti hai, aur Recent Movement contract ho to Bands narrow hoti hain. Lekin Indicator historical calculations par based hai. Bands koi permanent market wall ya guaranteed reversal boundary nahi.
BOLLINGER SQUEEZE KYA HAI?
Squeeze tab hota hai jab Upper aur Lower Band ke darmiyan Distance previous period ke comparison mein relatively narrow ho. Ye low Recent Volatility ka clue hai, future Direction ka forecast nahi. Aaj Squeeze aaye to Market Bullish Breakout, Bearish Breakdown ya kuch waqt sideways reh sakti hai. Agar CPI/NFP News expected hai to Data ke baad sudden Volatility possible hai. Lekin first Candle ka direction later reverse bhi ho sakta hai. Squeeze Strategy ko fixed Timeframe aur Width Criteria ke saath test karein.
BANDWIDTH INDICATOR
BandWidth generally Upper-Lower Difference ko Middle Band ke relation se express kar sakta hai, depending formula. Har Pair ki Price Scale different hoti hai, is liye Raw Width compare karna misleading ho sakta hai. Kuch Traders historical BandWidth Percentile se Squeeze define karte hain. Sirf Chart par Lines close dikhne se A++ Setup guaranteed nahi. Actual Numerical Threshold aur Last Completed Candle Reading record karein. Historical winner dekh kar Squeeze Definition alter na karein.
BAND WALK TREND MEIN
Strong Uptrend mein Price Upper Band ke saath multiple Candles move kar sakti hai. Isay Band Walk kehte hain. Har Upper Band Touch par Sell lena Trend ke against repeatedly lose kar sakta hai. Strong Downtrend mein Lower Band ke qareeb continuation possible hai. Dekhein H4 Higher High/Higher Low ya Lower High/Lower Low sequence kya hai. Agar Trend active hai to Outer Band Touch normal momentum behavior bhi ho sakta hai. Structural confirmation ke baghair fixed reversal predict na karein.
RANGING MARKET MEAN REVERSION
H1 Range mein Price Upper Band aur Horizontal Resistance ke paas reject kare to kuch strategies Mean Reversion toward Middle Band observe karti hain. Lekin agar Price Higher Lows bana kar Range Break kare to Reversion Thesis weak ho jati hai. Range ki Definition, M5 Rejection Close, SL aur TP rules pehle se documented hone chahiye. Mid-Band Target par Spread aur Commission ke baad Reward sufficient hai ya nahi, check karein. Mean Reversion aur Trend Breakout alag models hain.
EUR/USD SQUEEZE EXAMPLE
EUR/USD H1 Range 1.1020–1.1050 ke darmiyan consolidate kar rahi hai aur Bands narrow hoti hain. M15 Bullish Candle 1.1050 ke upar complete close deti hai aur Pullback par old Resistance hold hoti hai. Ye possible Breakout Retest scenario hai. Lekin agar H4 Supply just 1.1060 par hai to available TP Distance bohat short ho sakti hai. Sirf Squeeze Breakout hone se Buy financially sensible nahi. Stop Distance aur Target Room compare karein.
GOLD LOWER BAND EXAMPLE
Gold H4 Uptrend mein hai lekin H1 Demand tak Pullback karti hai. Large M15 bearish candle Lower Bollinger Band touch karti hai. Is Touch par Blind Buy lena risky hai kyun ke Downward Momentum abhi strong ho sakti hai. Agar Selling slow ho, H1 Demand hold kare aur M5 completed Bullish Engulfing local Lower High ke upar close de to possible Trend Continuation Buy evaluate karein. SL actual rejection Low ke beyond rakhein.
BANDS EXPANSION KA MEANING
Strong Breakout ke baad Upper aur Lower Bands widen ho sakti hain. Ye recent Price Dispersion increase ka result hai. Lekin Bands Wide hone se guaranteed continuation prove nahi hoti. False Breakout mein bhi temporarily Expansion possible hai. Check karein Price old Range ke beyond hold karti hai ya wapas Range reclaim. Next H1 Opposing Zone kitni door hai? M5 Confirmation ke baad required SL kya hogi? Indicator ke saath actual Market Structure important hai.
UPPER/LOWER BAND LIMIT ORDERS
Har Upper Band par Sell Limit aur Lower Band par Buy Limit place karna ek aggressive Mean Reversion Model hai. Strong Trend mein price repeatedly outer band touch kar sakti hai aur Orders lose kar sakti hain. Conservative Reversion Model H1 Resistance/Demand, Completed Candle Rejection aur M5 CHoCH require kar sakta hai. Trend-following Model Middle Band par Pullback Buy use kar sakta hai. Ye different Strategies hain, Results aur Risk separately test honge.
BOLLINGER AUR RSI
Upper Band ke saath RSI 70 se upar ho to do Indicators bullish overextension show kar sakte hain. Lekin dono Past Price Data se calculate hote hain, independent hidden Bank Sell Orders ka proof nahi. H1 Previous High Sweep, H4 Supply aur M5 Bearish Shift alag price evidence provide kar sakte hain. RSI add karna actual Win Rate ya Expectancy improve karta hai, ye Backtest se measure karein. More Indicators automatically stronger confirmation nahi.
CPI NFP AUR FALSE BREAKS
High Impact News par Bands aur H1 Range dono fast break ho sakte hain. Spread Widen, Stop Slippage aur Rapid Reversal ka risk bhi hota hai. Agar CPI Headline aur Core mixed aayen to first USD/Gold Reaction reverse ho sakti hai. Written News Avoid Window follow karein aur stable post-news Structure form hone ka wait kar sakte hain. News Filters Historical Backtesting mein bhi same apply karein.
BREAKOUT STRATEGY STEPS
Step 1 Period 20 aur Standard Deviation 2 ya selected parameters fix. Step 2 Squeeze numerical criteria. Step 3 H1 Range Mark. Step 4 Range beyond Full Candle Close. Step 5 Retest Rule. Step 6 M5 Confirmation. Step 7 Structural SL. Step 8 Dollar Risk se Lot. Step 9 Nearest Supply/Demand tak realistic Target. Step 10 Journal result. Agar Range Break hi nahi hui to No Trade. Winning screenshot ke liye Rules retroactively change na karein.
MEAN REVERSION STRATEGY STEPS
Pehle H1 Sideways Conditions identify karein. Price Upper Band + Horizontal Resistance ya Lower Band + Support ke qareeb aaye. Candle Close wapas Band ke andar chahiye ya nahi, pehle define karein. M5 Rejection aur CHoCH rule. SL opposite extreme ke beyond, TP Middle Band ya Range Midpoint. Agar Strong Trend Breakout aa jaye to Plan invalid ho sakta hai. Reversion Results ko Breakout Strategy ke saath mix na karein.
PARAMETERS AUR OVERFITTING
Bollinger Period 20 se 10 karne par Bands recent price ko faster react kar sakti hain. Standard Deviation 2 se 1.5 karne se Band Touch frequency different hogi. Lekin har change se profitability automatically improve nahi. Different Market Regimes, Trading Sessions aur Symbols par fixed rules test karein. Original Sample aur Out-of-Sample Results compare karein. Commission/Spread include karein.
BOLLINGER FAQ
Squeeze guaranteed Big Move? Nahi. Upper Band Touch automatic Sell? Nahi. Fake Breakout par Bands Wide ho sakti? Haan. Band Expansion bullish ya bearish direction clearly batati? Nahi. Har Pair ki Squeeze same? Nahi. H4 Structure ignore karke H1 Trade guaranteed? Nahi. No Confirmation = No Trade.
BOLLINGER NUMERICAL CALCULATION
Illustrative EUR/USD 20-Period SMA 1.1000 hai aur selected Closing Prices ki Standard Deviation 0.0020. Agar Setting 2 Standard Deviations hai to Upper Band = 1.1000 + 0.0040 = 1.1040 aur Lower Band = 1.0960 ho sakti hai. Total Width 0.0080 yani typical EUR/USD Convention mein 80 Pips. Agar Price Movement decrease ho aur Standard Deviation smaller ho to Bands qareeb aa sakti hain. Lekin Upper Band 1.1040 Guaranteed Sell ya Lower Band 1.0960 Guaranteed Buy point nahi.
SQUEEZE KO NUMERICALLY DEFINE KAREIN
Sirf visually Bands narrow nazar aayen to Squeeze bolna subjective ho sakta hai. Ek example Criteria ye ho sakta hai ke current BandWidth last 50 Completed Candles mein relatively lowest readings mein ho. Ye illustrative filter hai, universal best parameter nahi. Iske baad bhi H1 Range, Breakout Direction, M15 Full Close, Retest aur Market Structure important hain. CPI Release par price dono sides break karke wapas aa sakti hai. Width Low = Guaranteed Trend Start nahi.
GOOD LOOKING SIGNAL BHI NO TRADE HO SAKTA HAI
Gold London Open par Upper Band ke upar Large Bullish Candle close karti hai. Lekin Stop Loss actual rejection Swing ke neeche bohat wide chahiye aur Previous Day High/H4 Supply close hai. Is tarah Momentum Strong hone ke bawajood Potential Reward required Risk se small ho sakti hai. Agar 1:1 se bhi kam practical Target Space hai aur tested setup suitable nahi to No Trade. Bollinger Squeeze, Band Expansion aur Upper Band Break Capital Protection ke rules cancel nahi kar sakte.
PIPSEPAISA FREE COURSES
Sir Sajid Khan Ghori ke Free Forex Technical Analysis Course mein Price Action, Market Structure aur Confirmation seekhein. Sir Ghulam Abbas ke Free Forex Fundamental Analysis Course mein Gold aur Forex ke Economic Data ka concept samjhein. www.pipsepaisa.com par Courses Tab se Enrollment Instructions check karein. Course Profit ki guarantee nahi.
DISCLAIMER
Ye sirf educational content hai. Koi Indicator, Pattern ya News guaranteed signal nahi. Structural Stop Loss, Account Risk, Spread aur Completed M5 Confirmation ka wait karein. No Confirmation = No Trade.
Educational content only. Trading involves risk. Always use independent analysis and appropriate risk management.