
Volume Profile Trading: Point of Control, Value Area and High-Volume Nodes
PipSePaisa • Forex Education & Research
INTRODUCTION
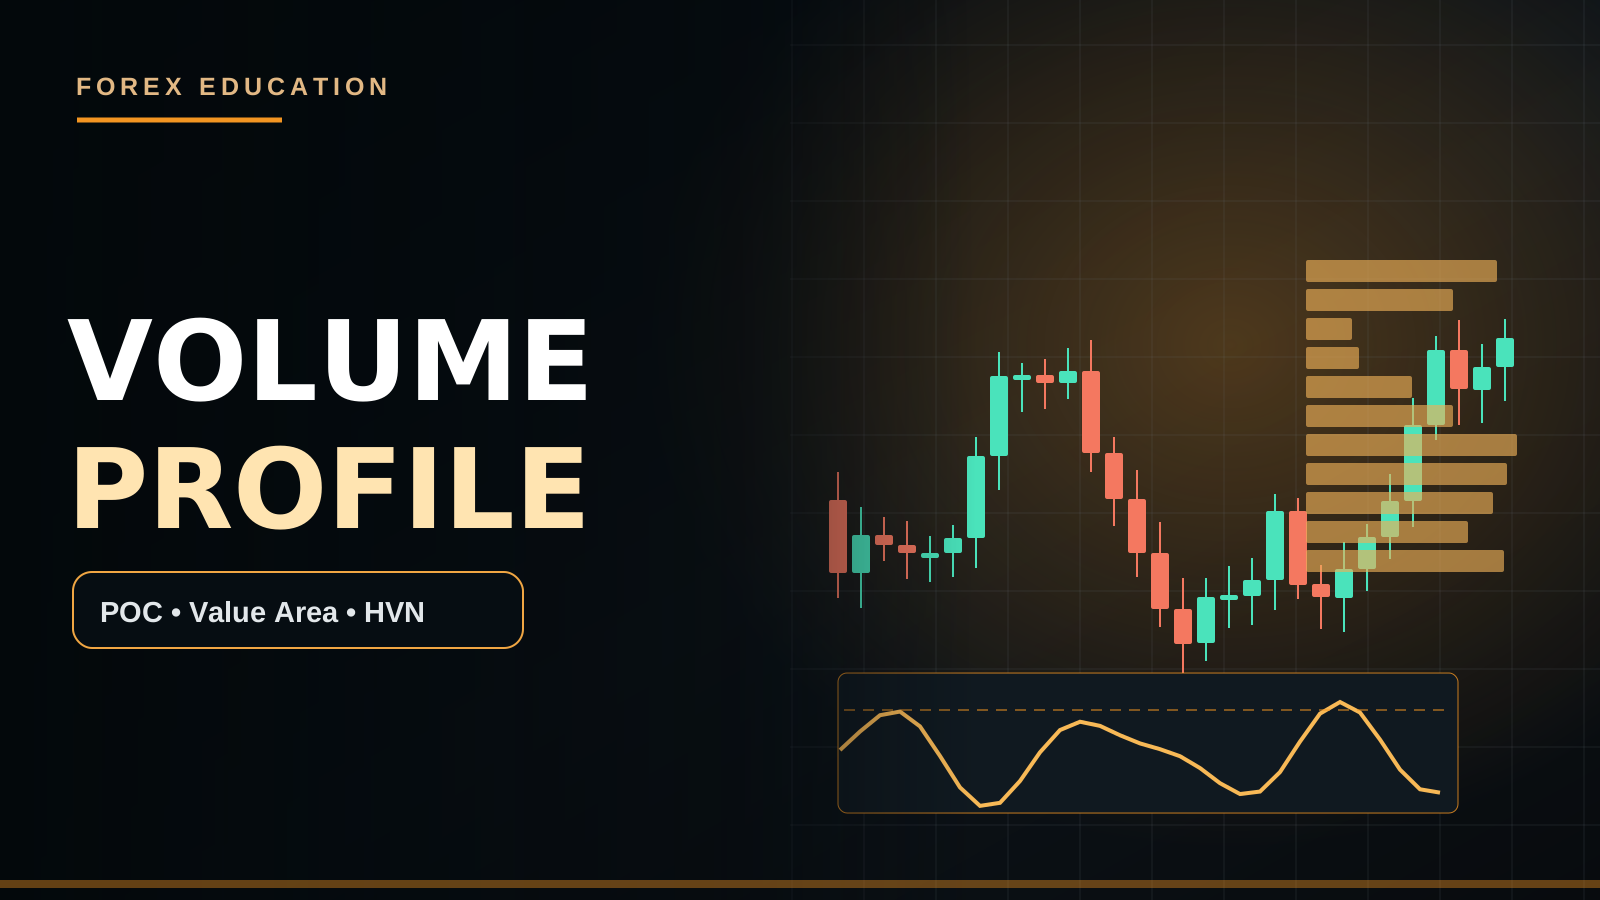
Volume Profile plots traded or estimated activity at individual price levels rather than across time bars. The Point of Control is the price with the highest represented volume in the selected sample, while value-area boundaries enclose a chosen fraction of activity.
PRACTICAL MARKET EXAMPLE
Gold futures volume profile may highlight a high-volume node where price traded heavily, but a retail spot XAUUSD broker may show a different distribution. A high-volume node can attract repeated trade or be bypassed.
IMPORTANT LIMITATIONS
POC is historical concentration, not necessarily a standing limit order. Value-area percentages and sessions must be fixed for backtesting.
WHAT VOLUME PROFILE DISPLAYS
A traditional volume histogram counts activity by time period, but a Volume Profile redistributes represented transaction volume across price levels within a selected observation window. In markets with centralized trade reporting, this can show where large portions of the observed trading occurred. The resulting horizontal bars may help identify a Point of Control, high-volume and low-volume nodes, and Value Area boundaries. It is not a prediction of where next week's volume will occur, nor a complete inventory of passive pending orders.
POINT OF CONTROL OR POC
The Point of Control is generally the price level with the highest represented volume inside the selected profile. Because a session can involve many transactions near the same price, a POC can reflect historical concentrated activity. But a historical concentration does not mean an institution still has a Buy Limit or Sell Limit at that exact level. A POC may be revisited repeatedly, become a reference for auction-style analysis or be crossed easily when macroeconomic information changes expectations. Treat the point as context.
VALUE AREA HIGH AND VALUE AREA LOW
Value Area describes a portion of the profile's volume distribution, often approximately seventy percent, though the definition and percentage are adjustable. Value Area High and Value Area Low are the upper and lower boundaries of that selected activity band. They are not the day's highest and lowest traded prices. When price trades near one boundary, a trader can observe whether it re-enters the area or establishes activity outside. There is no rule requiring price to return to the opposite boundary within the same session.
HIGH-VOLUME NODES
A High-Volume Node is an area containing relatively heavy represented trading activity. Some traders interpret it as a zone of historical agreement or frequent transaction. Price might rotate around it or react when returning, but the node itself has no guaranteed pulling power. H1 structure, current order-flow dynamics and economic developments can outweigh the historical volume distribution. Always identify whether the node was created during a typical session or a one-off event with unusual activity.
LOW-VOLUME NODES
A Low-Volume Node indicates comparatively less represented trading at a price band within the profile. Some strategies study whether price passes through such bands quickly when the market revisits them. Others examine the same regions as potential transition zones between areas of heavier activity. The future result remains conditional. A low-volume band cannot reveal hidden orders that are absent from the dataset, and a strong opposing H4 Supply/Demand area may interrupt the expected fast move.
FIXED-RANGE VOLUME PROFILE
A Fixed-Range Volume Profile calculates volume distribution between two manually selected points on the chart. The output depends on both the selected interval and the platform's data. A range spanning the last ten hours can differ substantially from one spanning the past ten days. When testing a strategy, choose the range by a rule that could have been known before entry. Choosing whichever historical rectangle produces an attractive POC near a winning trade creates hindsight bias.
SESSION VOLUME PROFILE
A Session Volume Profile generally resets its observations according to a trading-session boundary. This can be useful for centralized futures sessions. But in Forex, the opening and closing times of Asia, London and New York and the particular platform's implementation need precise definitions. If the profile is reset at a different hour, its POC and Value Area can move. Session comparisons should be made using consistent timezone-aware windows.
FUTURES VOLUME VS SPOT FOREX
Spot Forex does not have one centralized public exchange reporting the total worldwide EUR/USD transacted volume. Some retail volume profiles rely on broker tick volume, which is not the same as verified global traded notional. By contrast, exchange-traded currency futures record executed activity on that venue. Futures volume may offer useful reference information for related currency pairs but does not represent all spot transactions. Cite the data source accurately instead of calling every volume cluster institutional.
GOLD FUTURES AND RETAIL XAUUSD
A COMEX Gold futures contract provides reported exchange activity. The Gold CFD XAUUSD displayed by a retail broker can track related underlying prices but differs by broker quotation, contract size and sometimes session timing. A Gold futures Value Area High is not automatically the exact same number as an XAUUSD resistance area. Futures basis, roll events and spread conditions complicate direct comparison. Mark which product produced the profile and which product would execute the trade.
A BUY HYPOTHESIS NEAR VALUE AREA LOW
Imagine EUR/USD H4 trend is bullish and price approaches a pre-marked H1 Demand Zone that overlaps the session Value Area Low. A trader observes a completed M15 rejection and a subsequent bullish M5 CHoCH. This may be a candidate trend-continuation Buy if the Stop beyond the true swing low and realistic target offer acceptable risk-to-reward. Value Area Low is contextual; the actual entry comes from a tested price-action trigger. If price breaks demand, the idea fails regardless of historical volume.
A SELL HYPOTHESIS NEAR VALUE AREA HIGH
Suppose GBP/USD H4 structure is bearish and H1 price rallies toward Value Area High close to previously defended Supply. A short hypothesis may require M15 upper rejection and a completed M5 lower high followed by bearish engulfing. A Sell Limit left at Value Area High without confirmation is a different, aggressive method and may fail during a strong breakout. Price can build fresh acceptance above previous Value Area, so the old boundary is not a permanent wall.
POC RECLAIM AND FALSE BREAKOUT
Price may briefly trade below the prior session POC, then recover and close back above it. Some traders describe that as a reclaim, but its significance depends on where H1 structure lies. A single price cross around a central profile level can occur repeatedly during a range. Waiting for multiple completed candles and a clear higher low may give a more definite observation. Yet even a confirmed reclaim cannot guarantee continuation or positive net expectancy.
PROFILE SHAPE AND OVERINTERPRETATION
A volume distribution can have one dominant peak or several distinct high-activity regions. Some auction-market frameworks assign names to particular profile shapes. Such labels can help summarize observation, but they are not universally reliable trading signals. Two similar shapes can arise for different reasons and respond differently to news. A trader should be cautious about assuming exact institutional intent based only on the silhouette of horizontal volume bars.
CONFLUENCE WITH SUPPORT, RESISTANCE AND FVG
A POC coinciding with H1 Support or a Value Area boundary near a previously marked Supply Zone may help prioritize an observation area. But multiple calculations derived from the same historical session do not count as independent confirmations. An FVG, market-structure break or Order Block can be studied separately. Write down which actual price event must occur before entry, and do not trade merely because many rectangles and volume lines overlap.
RISK, DATA SOURCE AND BACKTESTING
To backtest Volume Profile, fix the instrument, source, price bin size, sample interval, value-area percentage and method for POC selection. Record H4 bias, H1 location, M5 confirmation, stop, target, spread and commission. Compare the same price-action strategy with and without profile information to see whether it improves net expectancy. Missing or reconstructed historical volume data can distort results. A profile-based system should not use volume values that were only available after the trade.
VOLUME PROFILE FAQ
Does POC show guaranteed unfilled bank orders? No. Can Value Area boundaries change when you change the range? Yes. Are spot Forex broker ticks equal to all global contracts traded? No. Is a high-volume node always Support? No. Can Gold futures and retail XAUUSD profiles differ? Yes. Should an M5 close rule still be respected? Yes, if the strategy requires it. All levels are analysis, not promises.
A PRACTICAL PROFILE SELECTION RULE
Before studying a Volume Profile, write down whether the analysis concerns one exchange session, a completed H1 consolidation or a larger multi-day swing. Choose the observation range before the breakout candle is known. If the range is widened to include a later winning move, the POC and Value Area might shift and make the successful historical trade appear obvious. Also select the row size or number of price bins; larger bins merge several nearby prices while smaller ones reveal more detail but can increase visual noise. Results from different resolutions are not automatically comparable.
A PROFILE TRADE THAT SHOULD BE SKIPPED
Imagine a bearish H1 setup around Value Area High, but the price has already fallen sharply and now sits just above the Value Area Low. Even if OBV and M5 candles appear bearish, the target space may be too limited relative to the logical stop above Supply. Shorting to the far side of the range after the move has happened is different from planning the entry before price reaches VAH. A completed confirmation should not become an excuse to enter late. The safest action can be remaining flat.
PIPSEPAISA FREE COURSES
For structured technical analysis education, explore the Free Forex Technical Analysis Course with Sir Sajid Khan Ghori. To understand the economic context behind Forex and Gold, explore the Free Forex Fundamental Analysis Course with Sir Ghulam Abbas. Visit www.pipsepaisa.com and select Courses for enrollment instructions. Courses and trading content cannot guarantee profit.
RISK DISCLAIMER
This is for education only. No indicator, chart pattern or economic release guarantees a trading outcome. Always calculate potential account loss, consider spreads and slippage, and wait for completed confirmation before trading.
Read in Roman Urdu
INTRODUCTION
Volume Profile selected Sample mein different Price Levels par Traded ya Estimated Volume dikhata hai. POC highest-volume Price Level hai aur Value Area selected Volume Percentage ko cover karti hai. Spot Forex Feed ka source important hai.
PRACTICAL EXAMPLE
Gold Futures ka POC Retail XAUUSD Broker Feed se different ho sakta hai. High Volume Node par Reaction possible hai, guaranteed reversal nahi.
LIMITATIONS
POC past activity ka concentration hai, guaranteed pending bank order nahi. Value Area Percentage aur Session Window consistent rakhein.
VOLUME PROFILE KYA DISPLAY KARTI HAI?
Normal Volume Bars Time ke mutabiq activity show karti hain, jabke Volume Profile selected period ki represented Volume different Price Levels par horizontal display karti hai. Centralized Futures Exchange mein actual venue traded activity ka clear record hota hai. Profile se Point of Control, High-Volume Nodes, Low-Volume Nodes aur Value Area High/Low observe kiye ja sakte hain. Ye next week Price ka guaranteed forecast ya pending bank orders ka complete inventory nahi.
POINT OF CONTROL POC
POC selected Profile ka highest represented volume wala Price Level hota hai. Iska matlab historical Sample mein is Price par comparatively zyada Transactions record hui. Lekin ye prove nahi hota ke future mein institution ka Buy Limit exactly POC par pending hai. Price POC ko repeatedly retest, cross ya completely ignore kar sakti hai depending new News aur Market Structure. POC ek Historical Activity Reference hai, permanent Support/Resistance boundary nahi.
VALUE AREA HIGH AUR LOW
Value Area selected Total Volume ka ek fraction cover karti hai, commonly around 70% though setting different ho sakti hai. Value Area High Upper Boundary aur Value Area Low Lower Boundary hoti hai. Ye actual Session High/Low ke identical nahi. Price VAH par pohanchay to Sell guaranteed nahi, VAL par aaye to Buy guaranteed nahi. Observe karein price Value Area ke andar return karti hai ya outside strong acceptance banati hai. Har Session opposite boundary tak move compulsory nahi.
HIGH-VOLUME NODES
HVN wo Price Areas hain jahan selected sample mein represented trading relatively heavy thi. Kuch Auction Analysis Methods inhen market ke agreed value zones ke tor par interpret karti hain. Price Future Retest par reaction de sakti hai ya node ke around rotate kar sakti hai, magar guarantee nahi. Current H1 Structure, New Order Flow aur Fundamental News historical distribution se stronger effect kar sakti hain. Node ordinary London Session ka hai ya exceptional News Burst ka, note karein.
LOW-VOLUME NODES
LVN selected Profile mein relatively kam represented activity wala Price Band hota hai. Kuch traders expect karte hain ke price revisit par is region se relatively fast pass ho, lekin future order availability different ho sakti hai. H4 Supply/Demand ya completed rejection moves ko interrupt kar sakti hai. LVN Low Historical Volume ka area hai, future mein no liquidity guaranteed zone nahi. Data Source aur Price Bin Calculation ko bhi samjhein.
FIXED RANGE VOLUME PROFILE
Fixed-Range Profile two selected Chart Points ke darmiyan Volume calculate karti hai. Agar trader last 10 Hours choose kare to POC ek ho sakta hai; last 10 Days choose kare to completely different. Is liye Strategy ke liye Range Selection Rule advance mein fix karein. Historical Winners dekh kar rectangle adjust karna Hindsight Bias create karta hai. Har trade par same Timeframe, Swing Selection ya Session Criteria use karna meaningful Backtesting hai.
SESSION VOLUME PROFILE
Session Profile chosen Trading Session Start par reset ho sakti hai. Centralized Futures mein official Exchange Session Hours available hote hain. Forex mein Asian, London aur New York ke defined Observation Windows important hain. Broker Timezone, DST aur Chart Provider Settings different profile results de sakti hain. Agar UK/US DST change ho to PKT/Malaysia Session Conversion bhi shift ho sakti hai. Consistent timezone-aware Session Definition rakhna necessary hai.
FUTURES VS SPOT FOREX VOLUME
Global Spot Forex decentralized hai, complete EUR/USD Traded Volume ka one centralized exchange feed nahi. Retail Platforms Tick Volume use kar sakti hain jo Broker Quote Activity ka proxy hai. Currency Futures actual Traded Volume ek Exchange par report karti hai, magar woh pure worldwide Spot Market ke equal nahi. Is liye Broker Profile ka HVN 'all institutional orders confirmed' kehna misleading hai. Source clearly identify karein.
GOLD FUTURES VS XAUUSD
COMEX Gold Futures exchange-report volume provide karti hain. Retail XAUUSD CFDs related Gold Price track kar sakte hain, lekin Quote Feed, Contract Size aur Session Hours different ho sakte hain. Futures Value Area High same exact Retail Broker Resistance price ho, zaroori nahi. Futures Basis aur Expiry Rollover bhi difference create kar sakte hain. Chart Reference Product aur actual Trade Execution Symbol separately record karein.
VALUE AREA LOW BUY EXAMPLE
EUR/USD H4 Bullish Trend hai. H1 Demand Zone aur selected Session Value Area Low overlap karti hain. M15 Rejection close de aur M5 Bullish CHoCH fully confirm ho to possible Trend Continuation Buy evaluate karein. SL relevant Swing Low ke beyond aur TP previous H1 High ya Opposing Supply par plan karein. Value Area Low sirf additional Context hai; actual Entry Trigger M5 Price Action hai. Zone decisively fail ho to Buy thesis invalid.
VALUE AREA HIGH SELL EXAMPLE
GBP/USD H4 Downtrend mein hai. H1 Price Rally kar ke VAH + previous Supply Zone tak aaye. M15 Upper Wick Rejection aur M5 Lower High/Bearish Engulfing Close mile to Sell analysis possible hai. Lekin VAH par direct Sell Limit ek aggressive method hai jo Strong Bullish Breakout mein fail ho sakta hai. Price Value Area ke upar new acceptance bhi bana sakti hai. Historical Boundary permanent Sell Wall nahi.
POC RECLAIM KA MEANING
Price Previous Session POC ke neeche short move de aur phir POC ke upar Close kare to Reclaim kaha ja sakta hai. Lekin H1 Range ke middle mein POC repeated Cross ho sakta hai. Ek small M5 Wick se Strong Trend conclude mat karein. Completed Candles, meaningful Higher Low aur H1 Support context use karein. POC Reclaim proof nahi ke future movement certain direction mein continue hogi. SL aur TP ki actual price distance calculate karni hogi.
PROFILE SHAPE OVERINTERPRETATION
Profile mein ek dominant Peak ya multiple High-Volume Areas ho sakte hain. Kuch Market Auction Theories in Shapes ko names deti hain. Lekin same-looking Shape different Fundamental News aur Trader Positioning conditions mein ban sakti hai. Shape dekh kar kisi exact Bank ke hidden Intent ko prove nahi kar sakte. POC, HVN, LVN ko measurable chart observations ki tarah use karein, guaranteed A++ Trade labels ki tarah nahi.
SUPPORT RESISTANCE AUR FVG CONFLUENCE
POC agar H1 Support ke qareeb aur Value Area Boundary H1 Supply par ho to potential reaction monitoring location clearer ho sakti hai. Lekin ek hi Historical Data se calculated multiple levels independent confirmations nahi. FVG, Order Block aur CHoCH ke actual Price-Action Rules alag define karein. Har overlapping rectangle ko institutional Buy/Sell evidence mat samjhein. Entry ke liye Completed Candle Close aur Risk-to-Reward evaluation essential hai.
VOLUME PROFILE BACKTEST
Data Source, Futures Contract ya Broker Feed, Price Bin Size, Session/Range Window, Value Area Percentage, POC Rule, H4 Trend, H1 Zone, M5 Trigger aur SL/TP record karein. Spread, Commission aur Slippage include karein. Profile-based Strategy ko same Plain H1 Structure Strategy se compare karein. Jo historical volume live decision time par available nahi tha, usay retroactively use karna invalid Backtest ho sakta hai. All Winners/Losers count karein.
FAQ
POC guaranteed pending Orders? Nahi. Range Change se VAH/VAL change? Haan. Spot Tick Volume global traded Lots? Nahi. HVN always Support? Nahi. Futures aur XAUUSD Profile different? Haan. M5 Confirmation required ho to wait? Haan. No Confirmation = No Trade.
PROFILE RANGE SELECTION RULE
Volume Profile use karne se pehle decide karein aap ek Trading Session analyze kar rahe hain, completed H1 Consolidation ya Multi-Day Swing. Observation Range price breakout se pehle define karein. Agar winning historical move dekh kar rectangle change kar diya to POC aur Value Area shift ho kar perfect reaction dikhne lagti hai. Row Size ya Price Bins bhi fix karein. Large Price Bins multiple adjacent levels merge kar deti hain, Smaller Bins zyada detail magar Noise de sakti hain. Two Profiles different resolution par necessarily comparable nahi. Consistent data source aur session timeframe professional backtesting ke liye critical hain.
PROFILE TRADE KAB SKIP KAREIN?
Maan lein GBP/USD H1 VAH par bearish reaction hui thi, magar trader price ka large fall complete hone ke baad screen dekhta hai. Ab Price VAL ke bilkul qareeb hai aur Logical SL previous H1 Supply par kaafi door. M5 Bearish Candle aur OBV Weak hona Price already extended hone ka risk cancel nahi karte. New Sell lene par nearest Target close aur Risk wide ho sakti hai. Ye original perfect VAH Entry nahi, ek late chase hai. Missed move monetary loss nahi; forced late entry actual Account Loss ban sakti hai.
PROFILE KE SAATH MONEY RISK
POC/VAH/VAL labels ke numbers se Lot Size decide nahi hoti. Real Entry Price aur Structural Stop ka Distance calculate karein, phir Broker Contract aur Pip Value ke mutabiq position size. CFD Gold mein $1 Price Move ka Monetary Impact Forex Standard Pip Convention se different ho sakta hai. Spread, Commission aur Slippage bhi account karein. VAH ek calculation hai, guaranteed institutional Sell Pressure nahi, isliye Lot double karna justify nahi. Controlled Risk aur M5 Completed Confirmation ko priority dein.
PIPSEPAISA FREE COURSES
Sir Sajid Khan Ghori ke Free Forex Technical Analysis Course mein Price Action, Market Structure aur Confirmation seekhein. Sir Ghulam Abbas ke Free Forex Fundamental Analysis Course mein Gold aur Forex ke Economic Data ka concept samjhein. www.pipsepaisa.com par Courses Tab se Enrollment Instructions check karein. Course Profit ki guarantee nahi.
DISCLAIMER
Ye sirf educational content hai. Koi Indicator, Pattern ya News guaranteed signal nahi. Structural Stop Loss, Account Risk, Spread aur Completed M5 Confirmation ka wait karein. No Confirmation = No Trade.
Educational content only. Trading involves risk. Always use independent analysis and appropriate risk management.