
Forex Pivot Points: Daily PP, R1/R2 and S1/S2 Support-Resistance Guide
PipSePaisa • Forex Education & Research
INTRODUCTION
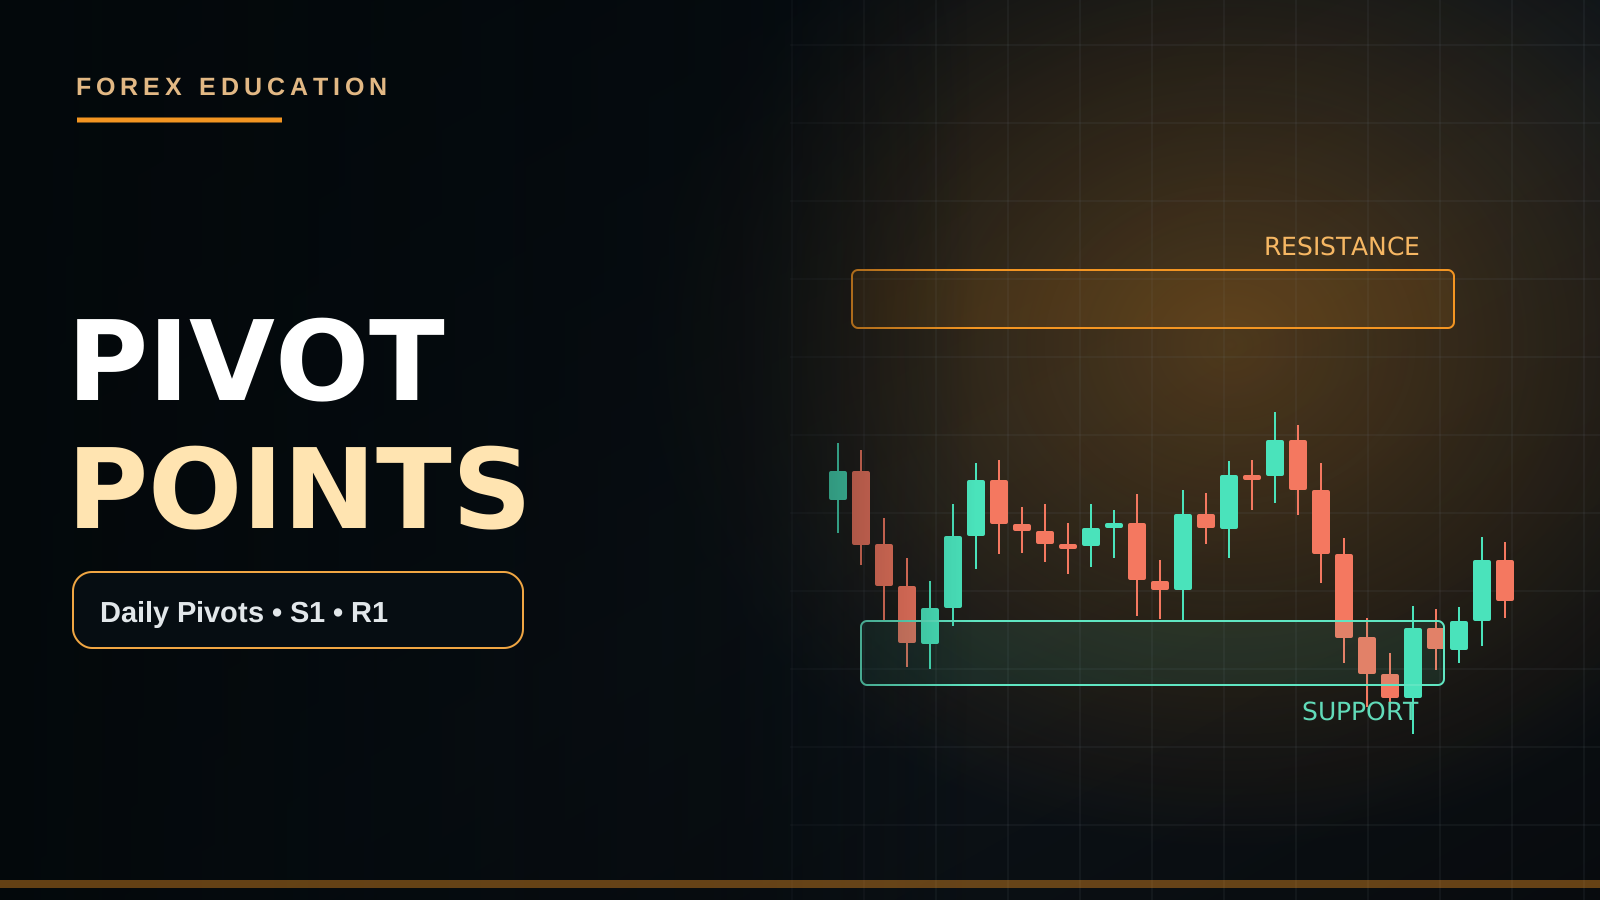
Traditional pivot points use a previous period's high, low and close to calculate a central pivot and derived support/resistance references. Classic PP is (High + Low + Close)/3, but Woodie, Camarilla and Fibonacci pivots use other formulas.
PRACTICAL MARKET EXAMPLE
If the prior day high is 1.1100, low 1.1000 and close 1.1060, central PP is approximately 1.10533. A live touch is an observation point rather than an automatic Buy or Sell.
IMPORTANT LIMITATIONS
Different broker server timezones can create different daily candles and pivot calculations.
CENTRAL PIVOT POINT FORMULA
In the classic method, the daily pivot point PP is calculated from the previous completed day's High, Low and Close using PP = (H+L+C)/3. Resistance and Support references are then derived algebraically. Classic R1 = 2×PP − L, S1 = 2×PP − H, R2 = PP + (H−L), and S2 = PP − (H−L). These are mathematical reference levels, not exchange-mandated prices. Some strategies monitor where price reacts around them; others use them to organize intraday zones.
A FULL EUR/USD PIVOT CALCULATION
Suppose yesterday's High is 1.1100, Low is 1.1000 and Close is 1.1060. PP = (1.1100+1.1000+1.1060)/3 = 1.10533 approximately. R1 = 2×1.10533−1.1000 ≈ 1.11067, while S1 ≈ 1.10067. Since the daily range was one hundred pips, R2 ≈ 1.11533 and S2 ≈ 1.09533. These levels describe calculations from yesterday's prices. They cannot guarantee EUR/USD will visit R1, bounce at S1 or reverse exactly at PP today.
PREVIOUS DAY CUTOFF MATTERS
Unlike an exchange-traded instrument with a defined daily session, spot Forex prices can be grouped into daily candles differently by brokers. One platform may use New York-close daily bars; another can use another server timezone. A changed daily close or high-low interval alters PP, R1 and S1. When building a strategy, fix the timezone convention and ensure the MetaTrader and TradingView calculations are based on comparable days. Otherwise, a trader may mistakenly conclude that the indicator is faulty.
PIVOT POINTS VERSUS SUPPORT AND RESISTANCE
A traditional horizontal Support Zone is usually inferred from previous swings, repeated price reactions or base formation. A calculated Pivot Level is derived from a formula regardless of whether price previously reacted there. When R1 aligns with an old H1 high, the coincidence can help focus attention. But the level remains an observation area, and a completed M5 rejection is different from a direct Sell Limit. Treat mathematical levels and market structure as complementary, not identical.
R1, R2 AND MULTIPLE RESISTANCE LEVELS
R1 and R2 are first and second calculated upward reference levels under a defined pivot formula. Their ordinal names do not establish expected test order or success probability. During a large CPI or NFP move, EUR/USD may break PP, R1 and R2 quickly. An intraday trader who shorts every calculated resistance without considering trend direction may face repeated losses. If a bullish trend has strong follow-through, upper pivot levels can become breakout references rather than guaranteed reversal points.
S1, S2 AND DOWNSIDE CONDITIONS
S1 and S2 are downward calculated reference levels, not permanent buying zones. If a currency is repriced downward after an unexpected central-bank announcement, price can cross several pivot supports. A more careful trader waits for price to reach a level and evaluates actual H1 Demand or a completed M5 bullish structure shift. If there is no reaction, the support hypothesis is not confirmed. A Pivot Level should not justify averaging into losing leveraged positions.
WOODIE AND CAMARILLA METHODS
Woodie Pivots, Camarilla Levels and Fibonacci Pivots use formulas that differ from the classic method. Their R1 and S1 numbers may not match. This is not necessarily a software bug. A trading plan should state exactly which pivot family and session boundaries it uses, rather than shifting between formulas to select the level nearest a successful historical reversal. Different methods need independent performance testing because a generic 'Pivot Strategy' is not one uniquely defined system.
A BULLISH PIVOT-RETEST EXAMPLE
Suppose EUR/USD H4 is bullish and H1 has previously marked Demand near the central pivot. Price dips below PP briefly, then M15 returns above with a completed close and M5 forms a Higher Low. A possible continuation Buy can be considered if the stop beyond the rejection swing and target toward R1 provide adequate net reward. But if R1 sits only a few pips away, the trade may be poor even though PP held. Setup quality requires distance, not just level confluence.
A BEARISH PIVOT EXAMPLE
Imagine GBP/USD H4 trend is bearish. An H1 rally reaches R1 near an independently marked Supply Zone. M15 prints upper-wick rejection, and M5 closes below local Support after forming a Lower High. This might fit a trend-aligned short model. The Stop Loss should sit beyond structural invalidation. If a Bank of England release is imminent, the technical reaction can be overwhelmed. Pivot R1 does not know future policy statements.
DAILY PIVOT BREAKOUTS
A trader might treat a completed H1 close above R1 as a breakout condition instead of a reversal trigger. A successful retest could suggest continuation toward a later reference, but there is no obligation for price to reach R2. Spreads, session volatility and nearby historical levels can change the risk. Be explicit about whether you trade breakouts or fades; taking both opportunistically without fixed rules makes backtesting unreliable.
PIVOT POINTS AND MARKET SESSIONS
London and New York sessions can bring greater activity around widely visible intraday levels. Quiet periods may see repeated crossings without sustained follow-through. Pivot calculations do not change simply because the session changes, but price reactions can. The US and UK shift daylight-saving clocks on different dates; if your system uses session opening ranges alongside pivots, the relative hours in Pakistan or Malaysia time can change across the year. Use timezone-aware calendars.
FIBONACCI AND PIVOT CONFLUENCE
A 50% retracement, an H1 Support Zone and a classic PP might lie in a similar band. Confluence can organize an observation location, but those three labels are not proof that institutions must buy there. Many charting tools can produce numerous nearby levels; selecting only the successful combinations after price turns creates an illusion of predictive power. Mark independent horizontal structure first and then evaluate whether the mathematical overlay adds meaningful information.
STOP LOSS AND EXECUTION RULES
Never choose a Stop Loss merely as the next pivot down without considering whether the technical hypothesis already failed earlier. Structural lows/highs define invalidation for many price-action models. Calculate account loss using entry-to-stop distance, lot size, pip value, commission and possible slippage. A Sell Limit at R1 can execute before an M5 bearish confirmation, so it does not match a strategy that demands a candle close. Choose execution rules deliberately.
BACKTESTING THE PIVOT SYSTEM
Document the exact pivot formula, previous-day cut-off, symbol, timeframe, whether you trade bounce, failed break or continuation, H4 trend filter, entry candle requirement, Stop Loss method, target, and news exclusions. Record all qualifying daily levels, not only the times R1 or S1 looked perfect. Compare net expectancy to a strategy using ordinary H1 Support/Demand without pivots. A calculated indicator earns its place only if the measured incremental performance is helpful.
PIVOT POINT FAQ
Does PP guarantee an intraday turning point? No. Do R1/R2 always get visited in order? No. Can two brokers show different daily pivots? Yes, due to cutoffs and feeds. Is Camarilla the same formula as classic pivots? No. Can price fall straight through S1 and S2? Yes. Is an M5 candle close necessary? Only if your written entry model requires it. The objective is repeatable analysis, not certainty.
THIRD SUPPORT AND RESISTANCE LEVELS
Some classic pivot implementations also display R3 and S3. Formulas vary by provider, and traders should inspect the exact indicator documentation rather than assuming every R3 line is identically calculated. Outer levels can appear far beyond a typical daily range, but exceptional volatility can still reach or cross them. The existence of an extreme R3 or S3 reference is not a prediction that the session will move that far. A trader should not force an entry simply because a chart has many named levels.
WHEN PRICE OPENS ABOVE THE PIVOT
Some intraday systems classify the opening price relative to PP as an initial directional context. Opening above PP may align with a bullish narrative, while below PP may align with bearish sentiment. But overnight news, gaps and an opening sweep can make this classification misleading. Rather than trusting opening position alone, assess how price behaves after a completed M15 candle, whether the previous-day extreme holds and whether the broader H4 structure supports a trend or range thesis.
A PIVOT-TARGET DISTANCE CHECK
Imagine an H1 bullish confirmed setup near PP with a structural Stop Loss twenty-five pips away and R1 only eighteen pips above entry. The theoretical maximum target at R1 is less than one R before costs. A trader who requires at least a tested 1:1.5 ratio should reject it. An alternative distant R2 target is not automatically realistic when R1 and historical resistance lie in the path. Use calculated pivot reference levels to estimate available room, not to justify ignoring opposing structure.
PIPSEPAISA FREE COURSES
For structured technical analysis education, explore the Free Forex Technical Analysis Course with Sir Sajid Khan Ghori. To understand the economic context behind Forex and Gold, explore the Free Forex Fundamental Analysis Course with Sir Ghulam Abbas. Visit www.pipsepaisa.com and select Courses for enrollment instructions. Courses and trading content cannot guarantee profit.
RISK DISCLAIMER
This is for education only. No indicator, chart pattern or economic release guarantees a trading outcome. Always calculate potential account loss, consider spreads and slippage, and wait for completed confirmation before trading.
Read in Roman Urdu
INTRODUCTION
Classic Pivot Point previous Period ka High, Low aur Close use karta hai. Central PP = (High+Low+Close)/3. R1/R2, S1/S2 related support/resistance reference levels hain, magar different Pivot Formulas alag numbers deti hain.
PRACTICAL EXAMPLE
Previous Day High 1.1100, Low 1.1000 aur Close 1.1060 ho to Central PP roughly 1.10533 banta hai. Level Touch direct entry signal nahi.
LIMITATIONS
Different Broker Timezones Daily Candles aur Pivot Levels change kar sakti hain.
CENTRAL PIVOT POINT FORMULA
Classic Daily Pivot Point previous Completed Day ke High, Low aur Close se calculate hota hai. Formula PP = (H+L+C)/3. Classic R1 = 2×PP − Low, S1 = 2×PP − High, R2 = PP+(High−Low), S2 = PP−(High−Low). Ye mathematical Support/Resistance References hain, Exchange ki guaranteed trading boundaries nahi. Kuch Traders in levels ke qareeb Price Reaction monitor karte hain. Lekin Pivot Formula kal ke Data se banti hai; next Candle ka sure direction predict nahi karti.
EUR/USD COMPLETE PIVOT CALCULATION
Previous Day High 1.1100, Low 1.1000 aur Close 1.1060 maan lein. PP = (1.1100+1.1000+1.1060)/3 ≈ 1.10533. R1 ≈ 1.11067 aur S1 ≈ 1.10067. Daily Range 100 Pips hai, to R2 ≈ 1.11533 aur S2 ≈ 1.09533. Ye Levels useful calculation example hain. Har Daily Price R1 hit karegi ya S1 se guaranteed bounce degi, aisa rule nahi. Price zero ya multiple reference levels cross kar sakti hai.
FOREX DAILY CANDLE TIMEZONE
Forex decentralized market hai, is liye Brokers Daily Candle Cutoff different use kar sakte hain. New York Close-based Candle aur doosre Server Timezone ke High/Low/Close mein slight difference ho sakta hai. Is se Pivot PP, R1, S1 ki calculated prices change ho jayengi. TradingView aur MetaTrader Pivot Values compare karte waqt Timezone aur Session Definition same rakhein. Different Levels nazar aayen to immediately Indicator Bug assume na karein.
PIVOT VS HORIZONTAL SUPPORT/RESISTANCE
Traditional Support/Demand market ke previously observed Swing Lows, Price Reactions ya Base se derive hoti hai. Pivot Level ek formula se calculate hota hai chahe price ne us exact number par pehle reaction na bhi diya ho. Agar R1 previous H1 High ke qareeb ho to possible Confluence hai. Lekin R1 + Resistance ka overlap automatic Sell Signal nahi. Price Zone tak aaye, M5 Completed Rejection ya CHoCH aur Structural SL ka wait karein.
R1 R2 KYA MEAN KARTE HAIN?
R1 aur R2 first/second calculated resistance references hain under chosen method. Number 1 aur 2 successful bounce ki probability ya guaranteed testing order nahi. Strong Bullish Trend ya CPI Surprise par EUR/USD PP, R1 aur R2 rapidly break kar sakti hai. Har R1 Touch par Blind Sell karna strong Trend ke against repeated losses de sakta hai. Pivot Resistance Breakout Reference bhi ban sakti hai, reversal guaranteed wall nahi.
S1 S2 KYA MEAN KARTE HAIN?
S1 aur S2 downside mathematical supports hain. Lekin unexpected USD Strength ya BoE Policy News par Price S1 aur S2 ke neeche continue kar sakti hai. Sirf S1 hit hui is liye Buy Lot double karna Risky averaging ho sakti hai. H1 Demand actually defend hui? M5 Bullish Engulfing complete Close deti hai? Nearest Resistance tak Target available hai? Ye important questions hain. Confirmation absent ho to No Trade.
WOODIE CAMARILLA FIBONACCI PIVOTS
Pivot Tools ke multiple Formula Families hain: Classic, Woodie, Camarilla aur Fibonacci. Inke R1/S1 Prices different ho sakte hain. Ye necessary nahi ke Chart Software error ho. Har Strategy ke liye exact Method aur Previous Period Cutoff decide karein. Backtest winner ke according different Formula pick karna Hindsight Bias hai. Different Pivot Systems ko independent risk/return data se compare karein.
BULLISH PP RETEST EXAMPLE
EUR/USD H4 bullish Trend mein hai. H1 Demand Central Pivot ke qareeb marked hai. Price PP ke neeche short Wick de, M15 Candle PP ke upar close kare aur M5 Higher Low confirm kare. Ye possible Buy Continuation Scenario ho sakta hai. SL relevant rejection Swing Low ke beyond, TP R1/H1 Resistance ke context mein plan karein. Lekin R1 sirf few Pips upar ho to poor Reward/Risk ki wajah se No Trade. PP Hold hona enough nahi.
BEARISH R1 EXAMPLE
GBP/USD H4 Lower High/Lower Low Downtrend mein hai. H1 Price Rally kar ke R1 aur old Supply Zone par aaye. M15 Upper Wick Rejection aur M5 Bearish CHoCH + Lower High complete ho. Ye possible Trend-Aligned Sell Analysis hai. SL actual relevant High ke beyond rakhein. Agar BoE Major News kuch minute baad hai to Technical Reaction suddenly invalid ho sakti hai. R1 Future Interest Rate Announcement predict nahi karta.
PIVOT BREAKOUT STRATEGY
Kuch Traders R1 ke upar Completed H1 Candle Close ko Bullish Breakout Condition ke taur par evaluate karte hain. Retest Old R1 Hold kare to Continuation toward higher resistance possible. Lekin Market R2 tak lazmi pohanchegi, ye guarantee nahi. Spread, Volume, H1 Structural Swings aur Opposing Supply risk affect karti hai. Breakout Strategy aur R1 Rejection Strategy alag models hain. Dono ke rules aur Backtest separately rakhein.
TRADING SESSIONS AUR PIVOTS
London aur New York active hours mein daily Pivot Levels ke around different volatility observe ho sakti hai. Asian Quiet Hours mein Price multiple times PP cross kare aur follow-through weak ho sakta hai. US aur UK DST different dates par change karte hain, is liye Pakistan aur Malaysia relative Session Timings seasonally shift ho sakti hain. Agar Pivot + Opening Range model use karte hain to Session Window fixed timezone-aware rakhein. Candle Data aur Session Labels consistent hon.
FIBONACCI AUR PIVOT CONFLUENCE
H1 Demand, Fibonacci 50% Retracement aur Classic Pivot PP same price band ke qareeb ho sakte hain. Ye observation confluence hai, Bank Orders guaranteed concentration nahi. Agar aap dozens Fibonacci aur Pivot lines draw karenge to every price par koi level mil sakta hai. Independent H1 Structure pehle mark karein, phir Pivot Overlay evaluate. Backtest mein baad mein drawn levels ko original trade reason na banayein.
STOP LOSS AUR EXECUTION
Stop Loss sirf next Pivot S1 par isliye na rakhein ke Table mein S1 likha hai. Actual Trade Thesis kis structural Low/High par invalid hoti hai, pehle define karein. Stop Distance, Lot, Pip Value, Spread aur Commission se Dollar Risk calculate karein. R1 par Sell Limit pehle rakhne se M5 Confirmation ke baghair Entry ho sakti hai. Agar Plan Full Close demand karta hai to First Touch Limit different aggressive method hai.
PIVOT BACKTEST CHECKLIST
Chosen Formula Classic/Woodie/Camarilla, Daily Cutoff, Pair, Timeframe, H4 Trend, H1 Reaction Zone, Bounce ya Breakout Method, M5 Confirmation, SL, TP aur News Filter record karein. Har Day qualifying levels aur all trades include karein. Net Expectancy ko plain H1 Demand/Supply Strategy ke saath compare karein. Agar Pivot additional useful filter nahi deti to simpler setup valid. Indicator ka popular hona actual edge prove nahi.
PIVOT FAQ
PP guaranteed Turning Point? Nahi. R1/R2 hamesha order se touch? Nahi. Brokers different Daily Levels? Haan. Camarilla vs Classic same formula? Nahi. Price S1/S2 cross? Haan. M5 Close zaroori? Agar Written Strategy demand kare to haan. No Confirmation = No Trade.
R3 AUR S3 OUTER LEVELS
Kuch Classic Pivot Indicators mein R3 aur S3 bhi show hote hain. Lekin provider ke formulas different ho sakte hain, is liye assume na karein ke har Platform ka R3 exact same calculation hai. Outer Levels previous daily range se kaafi door ho sakti hain, magar extreme volatility par market unhein reach ya cross bhi kar sakti hai. Sirf Chart mein R3/S3 label hone se price us tak lazmi pohanchegi, ye prediction nahi. Indicator ki multiple lines ka matlab automatically many high-quality trading opportunities nahi.
PRICE PP KE UPAR OPEN HO TO KYA?
Kuch Intraday Traders Session Opening Price ko Central Pivot ke relation mein compare karte hain. PP ke upar Opening initial bullish context aur neeche initial bearish context suggest kar sakti hai. Lekin Overnight Gap, News, Liquidity Sweep aur Sideways Range is interpretation ko unreliable bana sakte hain. M15 Completed Candle, Previous Day High/Low aur H4 Swing Structure dekhein. Sirf 'Open Above PP = Buy' Rule ko universal strategy na samjhein. Market opening ka Price Level initial information hai, completed Trade Setup nahi.
PIVOT TARGET DISTANCE EXAMPLE
H1 Demand ke saath PP par possible Buy confirmation mili. Meaningful Structural SL 25 Pips door hai aur R1 Entry se sirf 18 Pips upar. Agar aapki Tested Strategy minimum 1:1.5 Ratio demand karti hai to ye trade unsuitable ho sakti hai. Sirf R2 aur door hai is liye TP R2 laga kar nearest H1 Resistance ko ignore mat karein. Market R1 se reject kar sakti hai. Calculated Pivot Lines ko reward planning mein use karein, guaranteed far targets ki justification mein nahi.
PIVOT CONFIRMATION VS FIRST TOUCH
R1 par Sell Limit rakhna aur R1 Rejection ke baad M5 Bearish Engulfing Close wait karna different methods hain. First Touch early Price de sakti hai magar H1 strong bullish continuation mein loss bhi. Completed Confirmation kuch false touches filter kar sakti hai, lekin Entry late aur SL Distance larger bhi ho sakti hai. Dono Systems ko separate Backtest karein. Lot Risk aur Target Distance same criteria se evaluate karein. M5 full close required ho to first-touch pending Sell Order aapka written rule violate kar sakta hai.
DAILY PIVOT JOURNAL FORMAT
Date, Broker Timezone, Previous High/Low/Close, PP, R1/R2, S1/S2, H4 Trend, H1 Zone, London/New York Session, News Calendar, M5 Entry Close, Structural SL, Pip Risk, TP aur Actual Net Profit record karein. Har day jab koi trade setup na mila ho, usay bhi note karein. Is se pata chal sakta hai kya Pivot Filter truly useful hai ya simple Horizontal Support/Resistance equally effective. Only Winning Charts select kar ke Strategy Quality judge na karein.
PIPSEPAISA FREE COURSES
Sir Sajid Khan Ghori ke Free Forex Technical Analysis Course mein Price Action, Market Structure aur Confirmation seekhein. Sir Ghulam Abbas ke Free Forex Fundamental Analysis Course mein Gold aur Forex ke Economic Data ka concept samjhein. www.pipsepaisa.com par Courses Tab se Enrollment Instructions check karein. Course Profit ki guarantee nahi.
DISCLAIMER
Ye sirf educational content hai. Koi Indicator, Pattern ya News guaranteed signal nahi. Structural Stop Loss, Account Risk, Spread aur Completed M5 Confirmation ka wait karein. No Confirmation = No Trade.
Educational content only. Trading involves risk. Always use independent analysis and appropriate risk management.