
Moving Averages in Forex: SMA vs EMA, 20/50/200 EMA and Trend Trading Strategies
PipSePaisa • Forex Education & Research
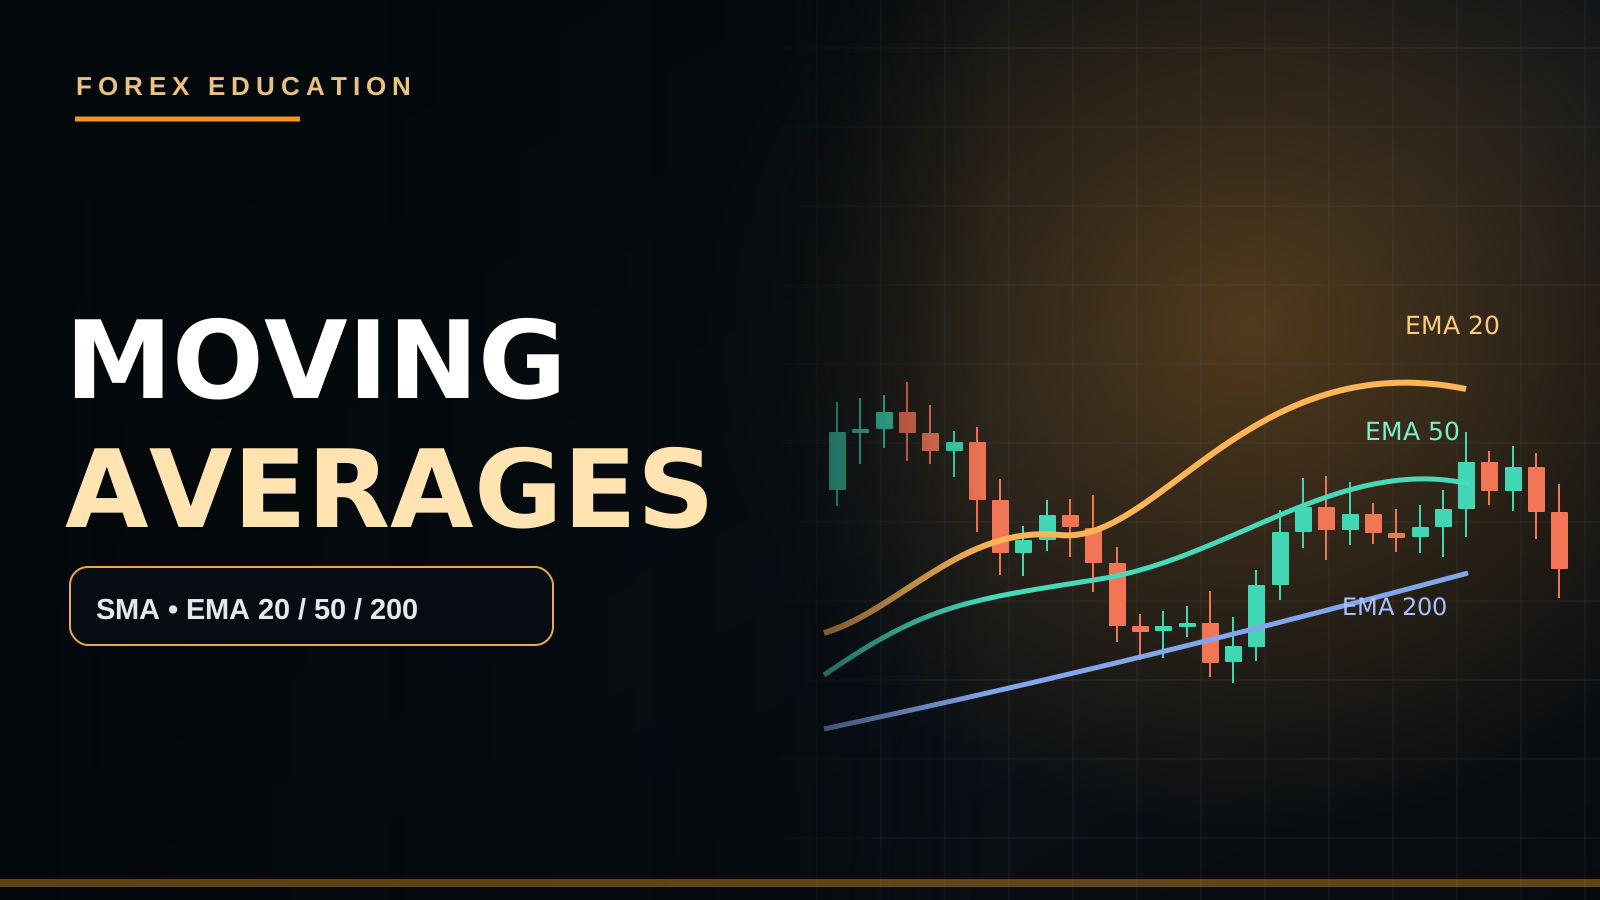
INTRODUCTION — WHAT A MOVING AVERAGE DOES
A Moving Average summarizes a chosen number of past prices into a smoother reference line. Traders use it to describe trend direction, momentum shifts, pullbacks and possible dynamic support or resistance. However, it is calculated from historical prices and cannot independently predict future candles. A smooth line may look accurate on historical screenshots because it follows past movement. Learn the differences between SMA and EMA, period selection, market structure, crossover pitfalls, entry confirmation and how to measure risk.
SIMPLE MOVING AVERAGE
A Simple Moving Average, or SMA, adds the most recent N closing prices and divides by N. If five closes are 100, 102, 101, 103 and 104, their sum is 510, so the five-period SMA is 102. As each candle closes, the oldest observation leaves the calculation and the newest joins. This equal weighting makes the line relatively straightforward to interpret. But a sudden new price move may take time to alter a longer SMA substantially.
EXPONENTIAL MOVING AVERAGE
An EMA gives relatively more weight to newer price observations, often making it react faster than an SMA with the same period. A common smoothing multiplier is 2/(N+1). For EMA 20 the multiplier is about 0.0952, while for EMA 50 it is about 0.0392. A simplified update is Current EMA = Previous EMA + Multiplier × (Current Close − Previous EMA). Exact start-up handling can differ among platforms, so very early bars may not match perfectly between data feeds.
20 EMA, 50 EMA AND 200 EMA
The twenty-period EMA is often used to observe shorter directional momentum, the fifty-period EMA as a medium-term trend reference and the two-hundred-period EMA as a longer context filter. These descriptions depend on the timeframe. EMA 200 on M5 summarizes a very different chronological period from EMA 200 on H4. A pair trading above the H1 EMA 200 can still be in a significant H4 bearish correction. Use the indicator as contextual evidence, not as a replacement for swing structure.
SLOPE AND RELATIVE POSITION
A rising EMA indicates that the smoothed recent price has been moving upward, while a falling EMA reflects the opposite. Price above a rising EMA can align with bullish momentum, but it does not guarantee an attractive entry. If the last rally is extended and H4 Supply lies immediately above, the remaining target room may be small. Flat and overlapping moving averages frequently appear when price is ranging. Determine the regime before choosing a moving-average model.
EMA CROSSOVER STRATEGY
A bullish crossover happens when a faster average crosses above a slower one; a bearish crossover is the opposite. Traders study combinations such as EMA 20/50 or SMA 50/200. Crossovers may confirm that recent prices have already moved strongly, meaning entry can be late. In sideways markets, averages can cross repeatedly and generate whipsaws. The existence of a crossover does not show whether the next trade has positive net expectancy.
GOLDEN CROSS AND DEATH CROSS
A fifty-period moving average crossing above a two-hundred-period average is commonly called a Golden Cross, whereas the reverse is a Death Cross. Names can sound powerful, but neither event guarantees a long-term trend. The crossover is backward-looking and sensitive to the chosen symbol, timeframe and smoothing method. On a volatile Gold H1 chart, a cross might follow a large move and offer limited immediate reward. Always inspect nearby highs/lows and economic context.
DYNAMIC SUPPORT AND RESISTANCE
An EMA may act as a convenient reference during pullbacks in an established trend because many traders monitor it and because it tracks the average price of recent candles. Yet price can cross and recross that line without any special order concentration. The EMA is not a horizontal Support Zone that will necessarily hold. A trader should look for a confluence with H1 Demand, a relevant swing low and completed price-action confirmation before declaring the pullback finished.
H4 BIAS, H1 ZONE, M5 CONFIRMATION
A practical workflow could begin with H4 Higher Highs/Higher Lows and a rising EMA 50 as supportive context. Next mark an H1 Demand Zone where price might retrace. Wait for price to reach it instead of buying only because candles are above EMA 20. Use M15 to observe rejection and M5 for a completed bullish engulfing or structure shift. Place Stop Loss beyond the actual rejection low and calculate lot from an acceptable loss amount.
EUR/USD EMA PULLBACK EXAMPLE
Hypothetically, EUR/USD has H4 bullish structure, and H1 price is above a rising EMA 50. A pullback takes the pair toward an old H1 swing low and the EMA region. M15 selling candles contract, then M5 closes bullish above a local lower high. A trader may consider a trend-continuation Buy with SL below the meaningful low. But if the nearest previous high is only fifteen pips away while the stop needs thirty pips, reward-to-risk may be unsuitable.
GOLD EMA CROSSOVER AND ECONOMIC NEWS
A strong XAUUSD rally after unexpectedly soft US inflation could lift a fast moving average above a slow one. By the time the cross appears, Gold may have already moved a large distance. Entering on the cross without a structural stop, realistic target or awareness of the next Fed announcement risks chasing a completed move. DXY and real yields can add context, but the technical setup should remain conditional rather than a guaranteed macro outcome.
EMA ON MULTIPLE TIMEFRAMES
An EMA 20 on M5 and EMA 20 on H1 do not summarize the same duration; each uses twenty bars of its own chart. If H1 EMA 50 slopes upward while M5 EMA 20 slopes downward, M5 may be experiencing a normal pullback. That is not necessarily a contradiction. Specify which timeframe governs the direction and which governs entry. Switching charts after a position goes against you can turn an entry model into uncontrolled holding.
ATR AND STOP LOSS WITH AVERAGES
Some traders combine a moving-average pullback with an ATR-based stop buffer. ATR measures recent volatility, not direction. The buffer must be tested against the structural low or high and broker spread. Making the stop wider without reducing position volume increases money risk. If market volatility changes sharply, yesterday's preferred static stop distance may no longer be appropriate.
MOVING AVERAGE BACKTEST DESIGN
Record the symbol, timeframe, type (SMA or EMA), periods, slope definition, crossover rule if used, market regime, H1 level, confirmation candle and exact Stop/TP. Include all setups meeting criteria, not just textbook examples. Account for spread, commission and slippage. Test sideways and trending periods separately. Optimize cautiously because a pair of parameters can look excellent only for one historical sample.
HOW PRICE CROSSES CAN MISLEAD
Suppose price closes above EMA 200 on M5 while H4 remains bearish and an H1 Lower High sits directly overhead. The crossover may signal only a local correction. If price immediately reverses, the oscillator-like use of an average can create rapid consecutive stop-outs. To prevent switching trading identity from one chart to another, specify that H4 selects directional bias, H1 defines location and M5 merely times the entry. An M5 breakout cannot override that hierarchy without a distinct tested reversal model. This matters especially during London open volatility.
THE DIFFERENCE BETWEEN SMA AND EMA IN PRACTICE
Take a sudden news-driven move on Gold after many relatively quiet candles. An EMA can respond more quickly than a comparable SMA because recent closes have higher weight, but the faster response also allows greater sensitivity to temporary spikes. The slower line may appear late, but that does not mean it will necessarily produce worse net results. Compare the same rule on historical charts with the same costs and trade filters. A mathematically faster average is not automatically a more reliable average for entry timing.
MOVING AVERAGE AS A NO-TRADE FILTER
One useful application is classifying the market as unsuitable for a trend-following strategy when EMA 20, 50 and 200 are repeatedly crossing or are almost horizontal. A trader can combine this with a visible H1 range, previous-day high/low and low follow-through. In a range, an EMA-touch trend entry may create many losses. Waiting for a decisive range break and proper retest can be a better match for some strategies. Define thresholds objectively; "lines look messy" can be hard to backtest.
A BEARISH EMA PULLBACK CASE
Suppose GBP/USD H4 shows Lower Highs and Lower Lows. H1 EMA 50 is descending, and price rebounds toward a previously broken H1 Support level that may now act as Resistance. M15 rally candles weaken, then M5 forms a Lower High and closes beneath local Support. This could be a candidate Sell, with SL beyond the relevant rejection high and target toward the prior H1 Low. But if the Bank of England unexpectedly alters policy guidance, the macro background may invalidate the historical technical view. Price, not the indicator label, ultimately determines execution.
RISK MANAGEMENT FOR CROSSOVERS
Suppose an EMA 20/50 bullish crossover happens after a large EUR/USD candle. If the nearest structural invalidation is forty pips below entry while the next H1 Resistance is twenty pips away, entering automatically offers poor planned geometry. An EMA crossover does not justify narrowing the structural stop to five pips solely to display a 1:4 ratio. Reduce volume to fit acceptable risk or skip the opportunity. A system can have convincing trend identification yet poor actual trade economics.
WHAT TO TRACK IN A MOVING AVERAGE JOURNAL
Save initial EMA values, timeframe, slope, whether the bars were fully closed, market regime, horizontal zone, actual order-fill price and the later stop/target outcome. Include a category for signal occurred but price was too extended. Analyze whether crossovers in trends behave differently from crossovers in consolidations. Also measure how much price moved before the crossover was confirmed; excessive lateness may justify a different setup without implying averages are useless.
PIPSEPAISA FREE COURSES
Sir Sajid Khan Ghori's Free Forex Technical Analysis Course provides a structured way to learn market structure, indicators and confirmation. Sir Ghulam Abbas's Free Forex Fundamental Analysis Course helps connect currency and Gold price action with economic releases. Visit www.pipsepaisa.com and the Courses tab to see enrollment instructions.
CONCLUSION AND RISK DISCLAIMER
Moving Averages can organize trend observation, but do not convert a backward-looking average into a guaranteed Buy/Sell signal. A robust workflow combines higher-timeframe structure, an important price zone, finished confirmation, structural stop and calculated position risk. No Confirmation = No Trade. This is educational material, not individualized financial advice; trading leveraged products can result in losses.
Read in Roman Urdu
INTRODUCTION — MOVING AVERAGE KA PURPOSE
Moving Average past Candles ki average Price ko smooth line mein show karti hai. Traders Trend Direction, Pullback aur possible Dynamic Support/Resistance observe karne ke liye use karte hain. Lekin ye Historical Prices se calculate hoti hai, future Gold ya Forex Candle predict karne ka guaranteed tool nahi. Historical Chart par line perfect lag sakti hai kyun ke woh pichhli movement follow karti hai. SMA vs EMA, 20/50/200 EMA, Crossover, H4/H1 Structure aur M5 Confirmation samajhna practical trading ke liye important hai.
SIMPLE MOVING AVERAGE FORMULA
SMA ka formula Recent N Prices ka Sum divided by N hai. Agar five closing prices 100, 102, 101, 103 aur 104 hain to total 510 aur SMA 102 hogi. New Candle close hone par oldest price calculation se nikalti hai aur new price add hoti hai. SMA sab included Closes ko Equal Weight deti hai. Long SMA sudden new movements par comparatively slow react kar sakti hai. Iska matlab SMA inaccurate nahi, bas smoothing ka calculation different hai.
EXPONENTIAL MOVING AVERAGE FORMULA
EMA recent Prices ko relatively more weight deti hai, is liye same period ke SMA se faster react kar sakti hai. Common Smoothing Multiplier 2/(N+1) hota hai. EMA 20 ke liye about 0.0952 aur EMA 50 ke liye 0.0392. Simplified Update: New EMA = Previous EMA + Multiplier × (New Close − Previous EMA). Different Chart Platforms mein Initial Values/Data Feed se early calculation slight different ho sakti hai. EMA bhi Lagging Calculation hai; future price guarantee nahi.
20 EMA, 50 EMA AUR 200 EMA
20 EMA shorter momentum observe karne ke liye, 50 EMA medium-term aur 200 EMA broader historical trend context ke liye common reference hain. Lekin H1 EMA 200 aur M5 EMA 200 same chronological time cover nahi karte. H1 par EMA 200 ke upar Price hona H4 overall Trend guaranteed bullish hone ka proof nahi. Timeframe aur Swing Structure ko priority dein. Har EMA ka objective pehle decide karein, sirf famous numbers ki wajah se indicators stack na karein.
EMA SLOPE AUR PRICE POSITION
Rising EMA recent smoothed Prices upward move hone ka clue hai. Falling EMA opposite. Price rising EMA se upar ho to bullish context possible hai, lekin zaroori nahi current price par Risk/Reward good ho. Agar Gold large rally ke baad H4 Supply ke bilkul neeche hai to Price above EMA 20 hone ke bawajood Buy late ho sakti hai. Flat EMAs aur repeated overlapping Crosses aksar Ranging Market show karti hain.
EMA CROSSOVER KYA HOTA HAI?
Fast EMA Slow EMA ke upar cross kare to Bullish Crossover aur neeche cross kare to Bearish Crossover kaha jata hai. Common combinations EMA 20/50 ya SMA 50/200 hain. Lekin price pehle movement de kar crossover create karti hai, is liye signal late bhi aa sakta hai. Sideways Range mein averages repeatedly cross ho kar Whipsaw Losses produce kar sakti hain. Har crossover profitable trade nahi.
GOLDEN CROSS AUR DEATH CROSS
SMA/EMA 50 jab 200 ke upar cross kare to traders Golden Cross kehte hain, reverse Death Cross. Naam popular hai, magar guarantee nahi ke Market Long-Term strong Trend start karegi. Indicators backward-looking hain aur Symbol/Timeframe ke mutabiq different results milte hain. XAUUSD H1 par Golden Cross strong rally ke baad aaye to Nearest Supply qareeb ho sakti hai. Entry se pehle Swing Structure, News Calendar aur actual target space dekhein.
DYNAMIC SUPPORT RESISTANCE
Established Uptrend mein EMA ke qareeb Pullback aa kar Price react kar sakti hai. Lekin EMA line permanent horizontal wall nahi. Price EMA ko multiple times cross aur reclaim kar sakti hai. EMA touch hone par direct Buy Limit rakhna ek aggressive Strategy hai, jabke H1 Demand + M5 Confirmation ka wait karna different conservative model. Dono ke historical results separately test karein. Institutional Buying ka guaranteed proof EMA touch se nahi milta.
H4 H1 M5 EMA WORKFLOW
Pehle H4 Higher High/Higher Low aur EMA 50 Slope observe karein. H1 Demand Zone aur old Swing Lows mark karein. Price ka Pullback wait karein. M15 par rejection aur selling pressure ka behavior analyze karein. M5 par completed Engulfing Candle ya Bullish CHoCH confirm karein. Stop Loss actual Swing ke beyond; Lot Stop Distance aur allowed Equity Risk se calculate karein. EMA sirf Context hai, entry ka complete reason nahi.
EUR/USD PULLBACK EXAMPLE
EUR/USD H4 bullish hai aur H1 EMA 50 upward slope show karti hai. Price pullback kar ke old H1 Demand aur EMA ke qareeb aati hai. M15 Red Candles chhoti hoti hain aur M5 local Lower High ke upar strong bullish Close deti hai. Possible Buy Continuation evaluate ho sakti hai. Lekin agar previous High sirf 15 Pips upar aur Structural Stop 30 Pips niche hai to RR poor ho sakti hai. Good Context ka matlab every trade acceptable nahi.
GOLD EMA CROSSOVER AFTER NEWS
US CPI unexpectedly soft aaye to Gold sharp rally kar sakti hai aur EMA 20, EMA 50 ke upar cross ho sakti hai. Lekin crossover tab appear hoti hai jab Price already significant move kar chuki ho. Agar us waqt trader high price par chase kare aur proper SL/TP na ho to risks high hain. Real Yields, DXY aur upcoming Fed news context dein, magar automatic Buy guaranteed nahi. Confirmed H1 Zone aur M5 Entry plan important hai.
MULTIPLE TIMEFRAME MOVING AVERAGES
M5 EMA 20 recent twenty five-minute candles ka data use karti hai jabke H1 EMA 20 twenty hourly candles ka. Is liye H1 EMA bullish aur M5 bearish ek normal pullback mein possible hai. Pehle fix karein H4 Main Direction, H1 Setup Location aur M5 Entry Timing. Trade against move hone par suddenly M5 Stop ko H4 Trend ke naam par ignore karna written plan change kar sakta hai.
ATR STOP AUR EMA STRATEGY
EMA Pullback ke saath kuch traders ATR volatility buffer use karte hain. ATR recent Range estimate karta hai, Direction nahi. ATR-based Stop ko actual Swing High/Low aur Spread se compare karein. Agar volatility high ho aur Stop wider required ho to Same Risk rakhne ke liye Lot kam karna pad sakta hai. Har Session mein fixed 10 Pip SL EMA touch par logical nahi.
BACKTESTING RULES
Pair, EMA/SMA Type, 20/50/200 Period, Timeframe, Slope, Crossover Conditions, H1 Level, M5 Confirmation, Stop/Target aur News Filter record karein. Har Valid Setup include karein. Historical Winning Screenshots only use karne se strategy edge prove nahi hota. Spread/Commission aur Slippage assumptions bhi include karein. Ranging aur Trending samples separately assess karein. Overfitting avoid karein.
M5 EMA CROSS H4 TREND KO AUTOMATIC REVERSE NAHI KARTA
Maan lein M5 Price EMA 200 ke upar close hoti hai lekin H4 Downtrend mein Lower Highs/Lower Lows intact hain aur H1 Supply bilkul qareeb hai. M5 Bullish Cross sirf short-term Pullback ka signal ho sakta hai. Agar trader isay full Market Reversal samajh kar Buy kare to Stop Loss hit ho sakti hai. Apni hierarchy clearly set karein: H4 Direction, H1 Zone aur M5 Timing. Agar aap Countertrend Reversal Strategy bhi trade karna chahte hain to uske separate tested rules hon. Har naya M5 EMA Cross original H4 Bias ko cancel nahi karta.
SMA VS EMA NEWS KE WAQT
Gold mein CPI release ke baad Large Bullish Candle aaye to EMA recent Price ko extra weight dene ki wajah se SMA se faster upward adjust ho sakti hai. Lekin faster line temporary news spike se bhi zyada influence ho sakti hai. SMA comparatively slow hoti hai magar fast hona automatically accurate hona nahi. Same Instrument, Timeframe, Transaction Cost aur Entry Rules ke saath SMA aur EMA historical performance compare karein. Jo screenshot mein perfectly price follow karti hai woh Live Entry aur Net Expectancy mein necessarily best nahi.
EMA SE NO TRADE FILTER
EMA 20, 50 aur 200 flat aur repeatedly overlap/cross hon to trend-following model ke liye unsuitable range conditions possible hain. H1 par clear Range High/Low aur weak breakout follow-through bhi context ho sakta hai. Agar aapki Strategy sirf strong trends ke pullback trade karti hai to aise sideways market mein No Trade valid rule hai. Jab Meaningful Breakout, Retest aur M5 Confirmation aaye tab fresh setup evaluate karein. 'Lines messy lag rahi hain' ke bajaye objective numerical thresholds ya Structure Definition define karein.
BEARISH EMA PULLBACK EXAMPLE
GBP/USD H4 par Lower High/Lower Low bana rahi hai. H1 EMA 50 downward hai aur Price broken H1 Support ke paas Rally kar rahi hai jo possible Resistance ban sakti hai. M15 Rally Candles weak hoti hain. M5 Lower High ke baad local Support ke neeche bearish close deti hai. Ye Trend-Aligned Sell Setup ho sakti hai. SL actual rejection high ke beyond, TP previous H1 Low ke qareeb evaluate karein. Agar BoE sudden Policy Surprise de to overall Fundamental Context badal sakta hai.
CROSSOVER PAR OVERSIZED LOT NA LAGAYEIN
EMA 20/50 Bullish Crossover huge candle ke baad aayi. Logical Structural Stop 40 Pips door hai aur nearest H1 Resistance 20 Pips upar. Is situation mein crossover attractive lagne ke bawajood RR weak hai. SL ko artificial 5 Pips kar ke 1:4 Ratio dikhana trading edge improve nahi karta. Proper Lot Position Size se risk manage karein ya setup skip karein. Signal ko blindly trade karna compulsory nahi.
EMA JOURNAL MEIN KYA LIKHEIN?
EMA Type, Period, H4 Bias, H1 Demand/Supply, Candle Close, Session, Entry Price, Spread, Structural SL, TP aur Trade Result. Saath label karein ke Cross Trending Market mein hua ya Sideways Range mein. Kya Entry Cross ke waqt Price already extended thi? Kya News expected thi? Kya M5 Signal Complete hua? Ranging vs Trending Results separate compare karein. Data ke baghair EMA 20/50 'always profitable' claim nahi karna chahiye.
PIPSEPAISA FREE COURSES
Sir Sajid Khan Ghori ke Free Forex Technical Analysis Course mein Market Structure, Indicators aur Entry Confirmation seekh sakte hain. Sir Ghulam Abbas ke Free Forex Fundamental Analysis Course se Economic News aur Gold/Forex Data ka context samajh sakte hain. www.pipsepaisa.com ke Courses Tab se enrollment guide dekhein.
CONCLUSION AUR DISCLAIMER
Moving Average Trends ko visually organize karti hai, guaranteed Trading Signal nahi. H4 Structure, H1 Zone, M5 Completed Candle Close, Structural SL aur Controlled Risk ke saath hi strategy evaluate karein. No Confirmation = No Trade. Ye educational information hai, Financial Advice nahi. Leverage se capital loss possible hai.
Educational content only. Trading involves risk. Always use independent analysis and appropriate risk management.