
Aroon Indicator Explained: Aroon Up/Down, Trend Strength, Crossovers and Forex Trading
PipSePaisa • Forex Education & Research
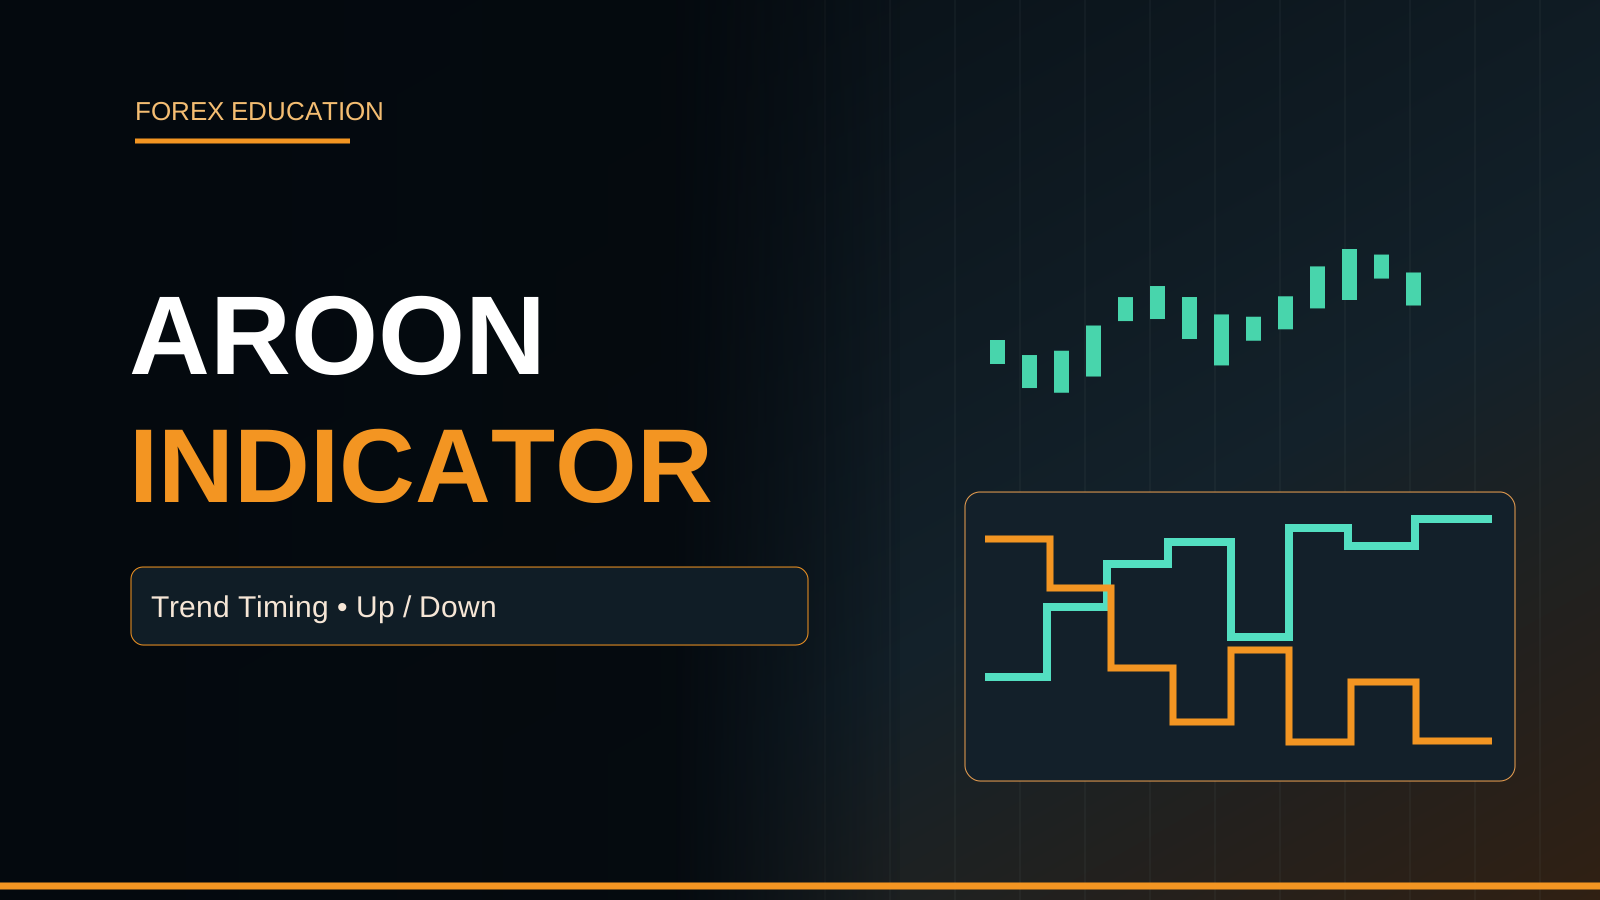
WHAT THE AROON INDICATOR MEASURES
The Aroon Indicator is a trend-oriented technical study introduced by Tushar Chande. It measures how recently price reached its highest high and lowest low within a specified lookback. Many versions show two lines called Aroon Up and Aroon Down on a zero-to-one-hundred scale. Unlike momentum indicators based directly on price-return percentages, Aroon emphasizes the timing of recent extremes. It can help describe emerging or persistent trends but does not guarantee the next candle direction. An Aroon crossover is not proof that a specific bank has opened a position.
AROON UP CALCULATION
A common Aroon Up calculation expresses how recently the highest high occurred in the selected period. One standard approach uses Aroon Up = 100 × (N − periods since highest high)/N, where N is lookback length and the window convention is specified. If a new highest high is current, Aroon Up may reach one hundred. The value can decline as the high ages without price necessarily dropping sharply. Different software may use lookback windows with one extra bar or differing tie-breaking rules. Match the exact implementation before comparing results.
AROON DOWN CALCULATION
Aroon Down applies the same idea to the most recent lowest low of the selected period. Under the common formula Aroon Down = 100 × (N − periods since lowest low)/N. A newly printed low may produce a reading near one hundred. As the low becomes older in the lookback, the line generally falls unless another qualifying low appears. This creates step-like changes that differ from RSI or CCI. A strong Aroon Down reading reflects the recency of a low, not confirmed sell orders or guaranteed bearish returns.
WHY HIGHS AND LOWS MATTER
A sequence of new highs with few new lows can be characteristic of an upward-trending market, while repeated new lows and aging highs can accompany downward trends. Aroon attempts to summarize this relationship using timing rather than only the current candle color. But an instrument can set a marginal new high and still reverse immediately. Short spikes during thin liquidity or high-impact news can also reset the indicator. Trend interpretation requires actual market structure and meaningful closes, not simply the timestamp of one wick.
LOOKBACK PERIOD SETTINGS
A lookback of twenty-five periods is frequently seen in educational Aroon examples, although platforms and traders may choose different lengths. On H1, twenty-five bars refer to a different observation horizon than on M5. A short lookback responds quickly to fresh extremes but may generate more frequent crossovers in noisy ranges. A longer lookback can reduce some changes while responding more slowly to newly established trends. No single setting produces consistent profits across every currency pair, session and volatility regime. Parameter selection requires an independent test.
WHAT AROON UP NEAR 100 MEANS
Aroon Up near one hundred suggests a recent highest high within the chosen window. This can be consistent with bullish trend behavior, especially if Aroon Down is relatively low. But a recent high may occur at a strong H4 Supply Zone, so it could be an exhaustion point rather than an attractive new Buy. Aroon does not assess how much space remains before an opposing level. A disciplined trader may use it to shortlist bullish charts, then wait for H1 Demand reaction and a completed M5 entry trigger.
WHAT AROON DOWN NEAR 100 MEANS
Aroon Down near one hundred indicates a recent lowest low in the selected window. In an established bearish market it can confirm ongoing downside exploration, but it does not tell whether the next candle will extend or bounce. Price may be at major H1 Demand immediately after registering the new low. A bearish breakout strategy could monitor a completed retest from below, while a countertrend model requires separate bullish evidence. Mixing both approaches after seeing the outcome produces unreliable backtests.
CROSSOVERS OF AROON UP AND DOWN
A bullish crossover happens when Aroon Up rises above Aroon Down, and a bearish crossover is the reverse. Crossovers can reflect a change in which extreme is most recent, but often occur after a trend shift has already begun. During H1 ranges, multiple crossings may appear with no meaningful directional follow-through. Some strategies require a crossover plus a threshold or higher-timeframe trend filter. Such extra conditions should be defined before backtesting. A forming candle may affect the latest extreme and crossover state.
THE 70 AND 30 REFERENCE AREAS
Some traders use regions such as seventy and thirty as heuristics to distinguish recently active extremes from older ones. For instance, Aroon Up above seventy with Aroon Down below thirty may look like bullish trend persistence under a chosen system. But these thresholds are not universal laws of financial markets and depend on lookback length. A trend can remain strong with other readings or produce false signals despite clear separation. Test thresholds on unseen data instead of claiming a fixed win rate without evidence.
AROON OSCILLATOR DIFFERENCE
Some chart packages also show an Aroon Oscillator calculated as Aroon Up minus Aroon Down. It therefore typically ranges between negative one hundred and positive one hundred under the common zero-to-one-hundred line definitions. A positive oscillator indicates Aroon Up is above Aroon Down, not necessarily that price returns are positive over the same interval. Zero crossings parallel the basic line crossover logic. This derived difference should not be confused with CCI, MACD histogram or a market volume delta indicator.
AROON VERSUS ADX
Average Directional Index, ADX, measures trend strength through calculations involving directional movement and smoothed true range. Aroon instead uses the recency of window highs and lows. Both can help analyze trends, but their mathematical assumptions are different. High ADX does not necessarily imply the latest highest high was very recent, and strong Aroon Up does not guarantee a particular ADX value. Combining them can create more restrictive conditions, which might reduce trades without necessarily improving expectancy. Compare filters using equivalent net-risk assumptions.
AROON VERSUS RSI AND CCI
RSI commonly compares gains with losses, while CCI normalizes deviation from a recent average. Aroon does neither. It asks how many bars have passed since a price extreme. Therefore a very large RSI reading can coincide with an Aroon Up reading that is not at one hundred, depending on price path and timeframe. Treating multiple oscillators as independent votes of institutional buying can exaggerate confidence because they often derive from related price data. Determine whether an additional filter materially changes after-cost outcomes.
USING AROON IN AN H4 TREND FILTER
One possible application uses Aroon on H4 as a broad trend filter and waits for technical entry conditions on smaller charts. Aroon Up above Down may align with a sequence of H4 higher highs and higher lows. The H1 chart then identifies a meaningful Demand Zone, and M5 provides a completed bullish engulfing or CHoCH. The exact values and thresholds need backtesting. If the latest H4 candle is not closed, its final extreme may not yet be available. Avoid future-data leakage during historical testing.
A GOLD H1 BUY SCENARIO
Suppose Gold H4 structure is bullish and the Aroon Up line has remained comparatively elevated as price makes new highs. During a quiet session, XAUUSD retraces toward H1 Demand. M5 forms a meaningful higher low and completed bullish engulfing after rejecting the zone. A trader might evaluate a conditional Buy with Stop beneath structural invalidation and target near the next H1 Supply. But if US CPI releases unexpectedly high and real yields jump, the bullish case can fail despite the prior Aroon strength.
A EURUSD H1 SELL SCENARIO
Imagine EUR/USD H4 displays lower highs and lower lows while Aroon Down is dominant. Price rebounds to a previously marked H1 Supply Zone and fails to reclaim broken support. A completed bearish M5 structural break may form a conditional Sell candidate. Its Stop should lie above the relevant swing high, and reward should be measured to the next H1 Demand. If ECB policy news lifts EUR sharply or the nearest target is too close, the trade may be skipped. Aroon does not override macroeconomic shocks.
AROON ON SIDEWAYS MARKETS
Aroon lines can swing when a range alternates between modest new highs and lows, even without a sustained trend. A short period can produce numerous crossovers as those extremes enter or exit its lookback. This may invite overtrading if every flip is treated as a new market direction. Identifying an H1 range with clear Support and Resistance can help decide whether trend-following signals are eligible. A system may require a completed H1 break and retest rather than relying only on the oscillator crossing.
RECENCY IS NOT THE SAME AS MOMENTUM SIZE
Aroon Up reaching one hundred only indicates the highest high is recent under the chosen window. It does not tell whether the new high exceeded the previous one by one pip or a hundred pips. Thus a tiny high made during quiet trade may reset the line just as a dramatic breakout does. ATR or other price-range measures can provide separate information about movement magnitude. Use those metrics for context rather than assuming Aroon measures the size of the move itself.
TIE-BREAKING AND PLATFORM DIFFERENCES
If several candles within the lookback have exactly equal highs, an indicator needs a rule for choosing which occurrence counts as the most recent highest high. Platforms may select the latest or earliest matching observation. Aroon values can therefore differ despite similar charts. Data feeds, broker timezones and number of historical bars also matter. An MT5 conversion should document tie logic, initialization and completed-bar indexing. Apparent discrepancies are not always bugs; investigate calculation specifications before changing strategy inputs.
REPAINTING AND INTRABAR EXTREMES
While the current candle remains open, its High and Low can update. A newly formed high may raise Aroon Up before the candle closes, while a subsequent rejection produces a bearish price bar. Some Aroon versions update intrabar normally, and others may wait for a completed candle. This should not be confused automatically with indicators that improperly use future bars. For any strategy requiring candle close, use closed-bar alerts and a chronological backtest. Do not claim that a current intrabar reading was guaranteed at bar completion.
POSITION SIZING WITH AROON
Aroon does not calculate Stop Loss distance, pip value or contract margin. A trade should start with the market-structure level where the idea is invalidated, then the entry-to-stop distance and a fixed account-currency risk budget. The volume needed for a thirty-pip EUR/USD Stop differs from a forty-pip Stop, and Gold's tick value depends on contract specifications. If a strong Aroon reading appears right before high-impact news, spread and slippage can overwhelm an attractive chart signal. No indicator makes leveraged risk disappear.
TESTING AROON IN A STRATEGY
Define the symbol, lookback, timeframe, exact Aroon crossover or threshold, H4 bias, H1 entry zone and completed M5 trigger. Replay historical bars in chronological order and include every valid losing signal. Compare the baseline H4/H1/M5 price-action method with and without Aroon filtering. Net R, win/loss distribution, drawdown, trade frequency, spreads and missed entries matter more than a small collection of perfect charts. Use different market regimes for out-of-sample validation before claiming the indicator improves profitability.
AROON INDICATOR FAQ
Does Aroon measure recently made price extremes? Yes. Is Aroon Up 100 a guarantee of a Buy winner? No. Can Aroon Down remain high while price is near strong Demand? Yes. Are Aroon and ADX calculated identically? No. Can Aroon lines change during an unfinished candle? Yes, depending on implementation. Is Aroon Oscillator the same as traded volume delta? No. Can the same lookback behave differently on M5 and H4? Yes. Treat Aroon as a trend-timing context and trade only when location, confirmation and risk rules agree.
PIPSEPAISA FREE COURSES
Explore chart structure, trend concepts, H1 zones and M5 confirmation in Sir Sajid Khan Ghori's Free Forex Technical Analysis Course. Study USD, inflation, rates and Gold news in Sir Ghulam Abbas's Free Forex Fundamental Analysis Course. Current information is at www.pipsepaisa.com under Courses. Educational use only; leveraged Gold and Forex markets carry significant risk of financial losses.
Read in Roman Urdu
AROON INDICATOR KYA HAI?
Aroon Indicator Tushar Chande ne introduce kiya. Ye selected Lookback Window mein Highest High aur Lowest Low kitni recently aaye, measure karta hai. Common Lines Aroon Up aur Aroon Down, 0 se 100 scale. Forex/Gold Chart par Trend Persistence ya possible direction changes visualize. Ye actual Institutional Pending Orders nahi. Aroon Up 100 guaranteed next M5 bullish Candle nahi. H4/H1 Structure aur M5 Confirmation compulsory according planned strategy. Indicator chart context de sakta hai, risk-free signal nahi.
AROON UP FORMULA
Aroon Up Formula common version 100 × (N − periods since Highest High)/N. Example Lookback N=20, highest High current considered ho to Up=100. Highest High 10 Bars pehle tha to around 50 under relevant convention. Price lower sharply drop hona necessary nahi, only Highest High older ho to score decline. Different Indicator Code N+1 Bars ya tie rules use kar sakta hai. TradingView/MT5 results compare karne se pehle definitions check. Up value Dollar Profit Probability nahi.
AROON DOWN FORMULA
Aroon Down = 100 × (N − periods since Lowest Low)/N common version. Price new Lowest Low print kare to Down around 100 possible. Low old hota jaye aur new low absent to Down value decline. Ye Price Movement ki absolute pips count nahi, Time Since Low measure karta hai. Aroon Down high = guaranteed institutional Sell Volume nahi. H1 Demand close ho to late Sell risky even if Down100. Broker Gold/Forex contract risk separate.
HIGHS LOWS KA ROLE
New Higher Highs repeated aur fresh Lows absent hon to potential Uptrend, Aroon Up high. Bearish H4 Trend mein New Lower Lows repeat aur prior High older, Down high. Lekin one wick marginal new High generate kar sakti aur Market reverse bhi. News M1 spikes extremes update kar sakti hain. H4 HH/HL, LH/LL and M5 Full Candle Close separately verify. Aroon Time of Recent Extreme show karta, exact Buy/Sell Price ya Market Depth nahi.
AROON LOOKBACK PERIOD
Some Aroon Examples Lookback25 use karte hain, but universally Best guaranteed nahi. H1 N25 previous twenty-five Hours bars context, M5 N25 much shorter. Small Lookback fresh High/Low quickly reflect but Sideways Market false crosses more. Long Lookback slower and fewer signals. EUR/USD vs Gold same Period best proof nahi. Out-of-Sample Backtest on different market regimes. Historical Winner screenshot dekh kar Period choose Overfitting. Chart H1 Zones important.
AROON UP 100 MEANING
Aroon Up 100 near means selected Window mein recent Highest High. Trend Follow model bullish context, especially Down low. Lekin Highest High H4 Supply touch kare to potential Reversal zone; late Buy poor RR. Indicator Next H1 Supply Target Room calculate nahi. H4 Structure, H1 Demand Retest and M5 Bullish Engulfing/CHoCH full close. Aroon bullish label automatic Market Buy nahi. No Confirmation = No Trade.
AROON DOWN 100 MEANING
Aroon Down near100 recent Lowest Low indicate, Bearish Trend context. Gold strong Selloff ke baad H1 Demand touch kar rahi ho to immediate Sell poor RR even if Down high. Breakout Sell requires tested H1 Support Breakdown/M5 Bearish Retest. Reversal Buy needs different H1 Demand and M5 Bullish CHoCH. One indicator at same price automatically two opposite trades justify nahi. Written Strategy Rules essential.
AROON CROSSOVER SIGNAL
Aroon Up line Down ke above cross kare = possible Bullish Trend Timing Signal. Down Up se above = bearish. Lekin H1 Range mein multiple Crosses false. Trend flip already Price mein start ho chuka ho to indicator lag possible. Some models 70/30 Threshold aur H4 Trend filter require, exact Rules before Test. Current M5 Candle new Extreme bana kar line flip and final candle reverse. Completed Bar confirmation important. No Confirmation = No Trade.
AROON 70 30 ZONES
Aroon Up >70 aur Down <30 some Traders bullish Trend Strength Context interpret, reverse bearish. Ye Reference Thresholds universal guaranteed winning signal nahi. Lookback 14 vs 25, H1 vs H4 par readings differ. Sideways Fakeout events thresholds briefly satisfy. M5 Engulfing/CHoCH without H1 correct location incomplete setup. Trader ko Historical Net R and Drawdown evaluate. Indicator color main purpose trend timing, not exact Pip Target.
AROON OSCILLATOR
Aroon Oscillator = Aroon Up − Aroon Down commonly. Range -100 to +100 under standard scale. +60 Score implies Up line Down se 60 points above, Price +60% nahi. Negative reading bullish entry impossible guaranteed nahi. Oscillator Zero Cross basic Aroon Lines Cross reflect. CCI, MACD, Footprint Delta different Formula. Same TradingView Green Bar ka matlab Institutional Buy Order Count nahi. Source code/version check.
AROON VS ADX
ADX Directional Movement aur True Range based Trend Strength, Aroon High/Low Timing. Dono same Signal guaranteed nahi. Aroon Up near100 but ADX low if price just new marginal High after Range. ADX high with Aroon recent extremes different patterns possible. Two Indicators combine trade frequency less but Win Rate automatically higher nahi. H4 Structure + H1 Zone + M5 Full Confirmation baseline compare. Net R backtest.
AROON RSI CCI DIFFERENCE
RSI Average Gains/Losses, CCI Typical Price relative Mean Deviation, Aroon Bars Since High/Low. Formulas different. RSI Overbought70 aur Aroon Up100 same exact technical reason nahi. High Score multiple Indicators all same historical OHLC data se derived ho sakte hain, Independent Banks Confirmation nahi. Trader indicator overload avoid. H1 actual Market Structure and completed M5 Price Action key. Risk-based volume.
H4 TREND FILTER
H4 Aroon Up>Down aur Price H4 HH/HL align ho to potential Bullish Watchlist. H1 Demand Zone retest, M5 Completed Bullish Engulfing/CHoCH conditional Buy. Agar Current H4 Candle unfinished, future final High use karke historical M5 Entry justify na karein. H4 Close required ho to four hour bar complete. Indicator Filter optional and independent test. No Confirmation = No Trade. Stop H1 Swing low below, TP next Supply.
GOLD AROON BUY EXAMPLE
Hypothetical XAUUSD H4 HH/HL, Aroon Up high and Down low. Gold H1 Demand Pullback, M5 Higher Low and Full Bullish Engulfing. Conditional Buy with Stop structural Swing Low below and target H1 Supply. CPI/FOMC Surprise Real Yields up kare to setup fail possible despite Aroon Up100. Contract Size, equity risk and spread check. One Score guaranteed winning signal nahi. Educational scenario only.
EURUSD AROON SELL EXAMPLE
EUR/USD H4 LH/LL, Aroon Down dominant. H1 Supply Retest par Price old Support reclaim fail, M5 Bearish CHoCH Full Candle Close. Conditional Sell SL Swing High above, TP nearest H1 Demand. ECB Hawkish News EUR sharply rise kare to Sell thesis fail. Target Room low vs SL Distance then No Trade. Aroon Indicator actual Broker Entry Price determine nahi. Pip Risk and Lot calculate.
AROON RANGE WHIPSAW
H1 Range mein Equal Highs/Lows nearby, small new Extremes Aroon Up/Down Cross frequently. Short Lookback signals high. Agar every crossover Buy/Sell, Spread/Commission and repeated Losses. H1 Consolidation Upper Supply, Lower Demand mark. H4 Trend unclear, no trade possible. H1 Break and Retest plus M5 completed Engulfing/CHoCH more meaningful. Countertrend strategy separately tested. No Confirmation = No Trade.
AROON TIME VS PIPS
Aroon Up100 New Highest High kitni recently bana, ye batata hai. High previous level se 1 Pip above ya 100 Pips above, same Up100 possible. Isliye Aroon Momentum Magnitude/Pip Distance directly measure nahi. ATR Volatility ya H1 Candle Body Size separately assess. Gold $5 vs $50 move account Dollar Risk different. Indicator Score alone lot size determine nahi. Forex Trader H4/H1 Price Structure ko priority.
EQUAL HIGHS TIE RULE
Lookback window mein multiple exactly Equal Highs ya Lows ho to Aroon Indicator ko recent/earlier occurrence choose rule chahiye. Software tie-breaking different => Line Values differ. MT5 Broker Candle Timezone, TradingView Data Feed and rounding bhi effect. Developer TF Change, History Load and Buffer Index verify. Aroon H1 Lines shift hone ko instantly repaint fraud label nahi; formula and data compare. Trading Signal audit entry-time available values se.
AROON INTRABAR FLIPS
Current M5 Candle High/Low market move ke sath update. Candle Upper Wick new High banaye to Aroon Up100 momentarily, final Close bearish possible. Ye always future-data repaint bug nahi, forming bar update normal. Strategy M5 Full Close require kare to Alert Once Bar Close. MT5 EA previous closed candle buffer use. Backtest final H4 data earlier M5 Signal par leak na ho. No Confirmation = No Trade.
AROON LOT SL RISK
Aroon 100 Reading Stop Loss ya Account Risk Percent set nahi karti. H1 Demand Buy SL meaningful Swing Low below, Sell Supply SL Swing High above. Entry-to-SL Pip/Gold Price Distance and Broker Pip Tick Value se lot size. EURUSD 20Pips vs Gold $20 Stop equal monetary risk nahi. CPI/NFP Slippage. Aroon strong despite minimum Lot oversize ho to Skip. Total Equity Exposure correlated trades also. No Confirmation = No Trade.
AROON BACKTEST
Symbol, Period25/Other, H4 Trend, H1 Supply/Demand, Aroon Cross/Threshold, M5 completed Trigger and SL/TP define. Historical Bar-by-Bar Replay with no future data. Every Losing Signal and Winners record. Price Action Baseline vs Aroon Filter compare. Net R after Spread/Commission, Max Drawdown and Missed Trades. Only selected perfect Winning Gold screenshot statistical Edge proof nahi. New Out-of-Sample Period test. Strategy Rules after Loss arbitrarily change na karein.
AROON FAQ
Aroon recent High/Low timing? Haan. Up100 guaranteed Buy? Nahi. Down High at Demand? Possible. ADX same Formula? Nahi. M5 forming bar lines change? Haan. Aroon Oscillator traded Volume Delta? Nahi. H4/M5 Same Period different behavior? Haan. Practical Flow H4 Structure → H1 P+ Zone → Aroon Optional Context → M5 Full Engulfing/CHoCH → Structural SL/TP/Lot → Journal. No Confirmation = No Trade.
PIPSEPAISA FREE COURSES
Sir Sajid Khan Ghori ka Free Forex Technical Analysis Course aur Sir Ghulam Abbas ka Free Forex Fundamental Analysis Course ki enrollment information www.pipsepaisa.com ke Courses tab par. Educational Guide; financial advice nahi. Gold Forex Leverage Risk.
Educational content only. Trading involves risk. Always use independent analysis and appropriate risk management.