
Chande Momentum Oscillator (CMO) Explained: Forex Momentum, Divergence, +50/-50 and Gold Trading
PipSePaisa • Forex Education & Research
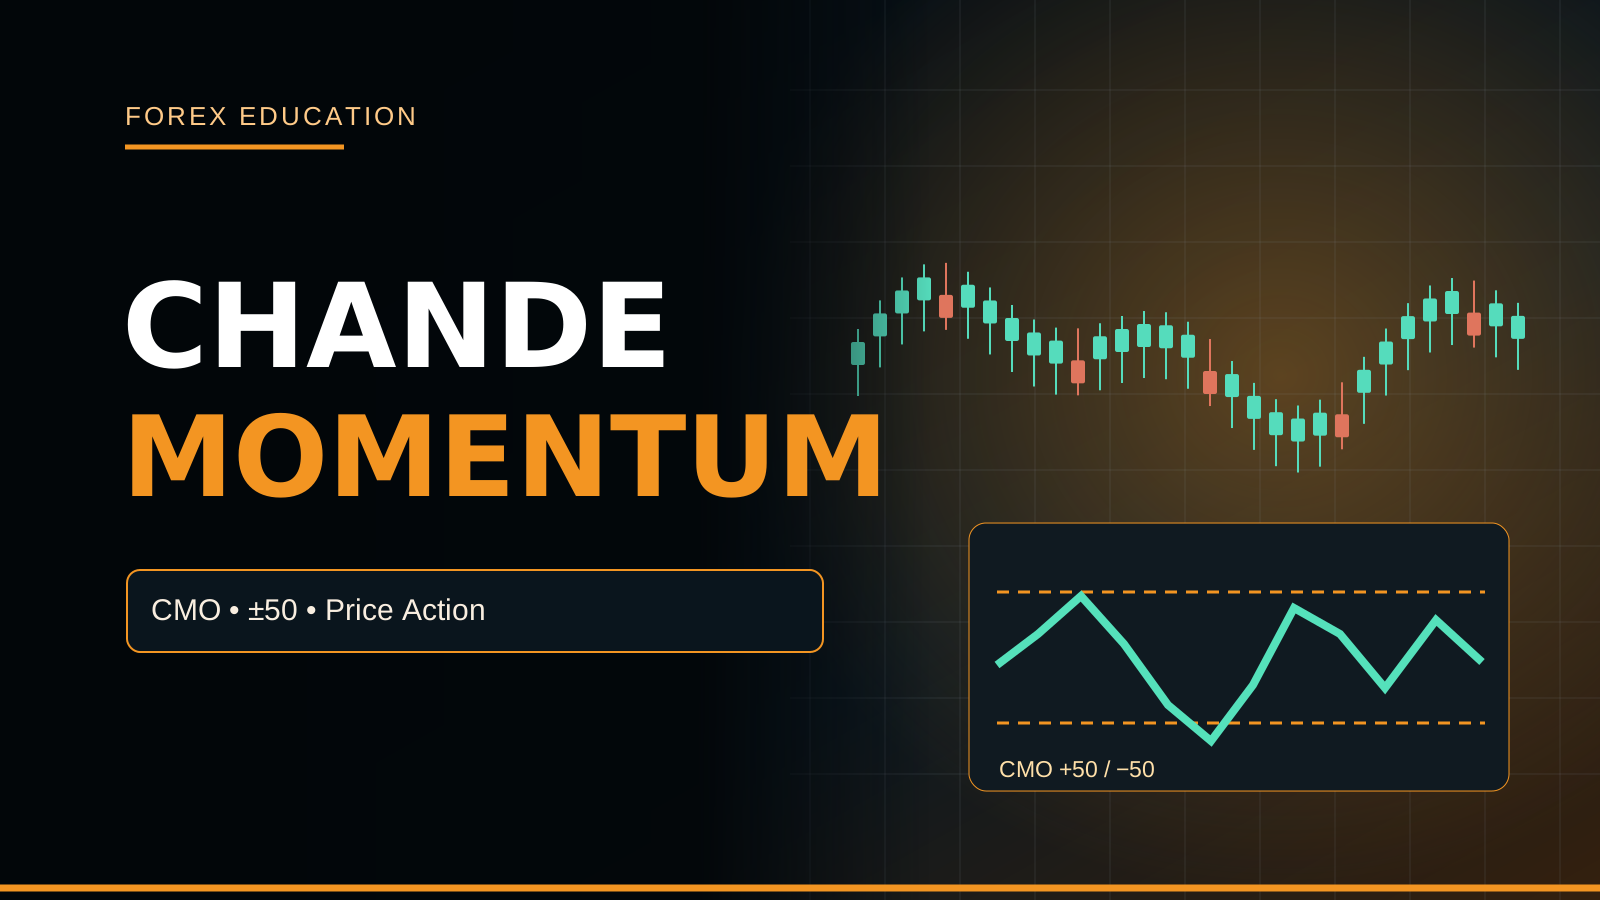
WHAT IS THE CHANDE MOMENTUM OSCILLATOR?
The Chande Momentum Oscillator, often abbreviated CMO, is a price-momentum indicator associated with Tushar Chande. It compares the magnitude of recent upward closing-price changes with downward changes over a selected lookback, producing a bounded oscillator from approximately minus one hundred to plus one hundred under its standard definition. Unlike market-depth tools, it does not reveal actual institutional orders. Its usefulness is in summarizing directional momentum and changes in that momentum. An extreme reading cannot guarantee the next EUR/USD or Gold candle will continue in that direction.
HOW THE CMO FORMULA WORKS
A common formulation is CMO = 100 × (sum of gains − sum of losses)/(sum of gains + sum of losses) over a selected number of recent periods. Gains and losses represent nonnegative absolute changes from one Close to the next, classified by direction. The numerator measures net upward versus downward movement, while the denominator normalizes by total movement magnitude. A zero denominator can occur in a perfectly unchanged series and needs defined handling by software. Different implementations may smooth inputs or use different price sources.
A NUMERICAL CMO EXAMPLE
Suppose a hypothetical five-bar window has cumulative upward closing changes totaling eighteen price units and downward changes totaling six. The CMO becomes 100 × (18−6)/(18+6), or plus fifty. That does not mean price is fifty percent higher, nor does it imply a fifty-percent probability of success. It describes the balance of positive and negative movement within that chosen sample. If the window changes or an older strong candle leaves the calculation, CMO can shift even with a relatively quiet new candle.
WHY THE SCALE IS BOUNDED
Because the magnitude of the difference between nonnegative summed gains and losses cannot exceed their sum, the standard formula stays between minus one hundred and plus one hundred whenever the denominator is positive. At the upper extreme the selected window has only upward closing changes; at the lower extreme only downward ones. This bounded interpretation differs from unbounded oscillators such as Commodity Channel Index. However, a CMO extreme is still not a fixed overbought or oversold reversal trigger; a strong trend may sustain extremes.
UNDERSTANDING THE ZERO LINE
CMO above zero suggests more total upward than downward closing movement over its window, while below zero suggests the reverse. A zero crossing can mark a change in that balance, but might occur repeatedly in sideways conditions. The location of the H4 trend and H1 zone matters more than a solitary crossing. An H4 bullish chart can show M5 negative CMO during an ordinary pullback without experiencing a major bearish structural shift. Define whether zero is used as a filter or an actual tested entry trigger.
WHAT A PLUS FIFTY READING SUGGESTS
Some traders use plus fifty as a reference for relatively strong upward momentum. The threshold is only a convention and must be evaluated against the chosen lookback and instrument. CMO can exceed plus fifty near the end of an extended Gold rally, when price is close to H4 Supply. Buying purely because the line looks strong may offer poor reward relative to a wide Stop. A more disciplined trend-following setup could wait for a pullback into H1 Demand and completed M5 bullish confirmation.
WHAT A MINUS FIFTY READING SUGGESTS
A CMO reading below minus fifty can be consistent with strong downward closing-price momentum over the selected periods. That does not mean the instrument is certain to fall further or ready to rebound. In a bearish H4 structure a trader might favor Sell setups on H1 Supply retests, rather than initiating a late Sell immediately above H1 Demand. The Stop must be placed beyond meaningful price invalidation. CMO does not calculate pip value, broker contract size or the amount of money at risk.
LOOKBACK LENGTH AND SENSITIVITY
A shorter CMO lookback reacts to recent closing changes quickly, often producing more frequent and noisier swings. A longer window can smooth some volatility but may respond slowly to a genuine reversal. A fourteen-period input is a common educational example, yet there is no universally best setting for Gold H1, EUR/USD M5 and GBP/JPY H4. Comparisons must use the same data feed, closing times and price source. Optimizing a parameter only on recent winners can manufacture attractive historical results without robust future evidence.
CMO VERSUS RSI
Relative Strength Index commonly calculates averaged gains and losses and displays a zero-to-one-hundred scale, while CMO uses a signed difference-over-sum formulation and displays around minus one hundred to plus one hundred. Under particular equivalent period and averaging assumptions, transformations can connect certain forms of these momentum measures, but platform implementations and smoothing details matter. A CMO zero line is not the same numeric threshold as RSI zero. Treat visual agreements as related price information rather than independent proof of bank accumulation.
CMO VERSUS MACD
MACD is typically built from moving-average differences and a signal line, while CMO measures upward and downward closing changes within a window. MACD histogram and CMO can diverge in their responses to sudden price moves because their memory and normalization differ. Neither tool knows whether an exchange-level bid wall will remain in place. A strategy stacking MACD, CMO and RSI may have overlapping information without a demonstrable performance improvement. Test the additional filter against a simpler price-structure approach, accounting for missed trades.
BULLISH MOMENTUM DIVERGENCE
A bullish CMO divergence may be described when price forms a lower low while the oscillator produces a higher low at comparable confirmed swing points. The reading might suggest negative momentum is losing intensity. But price can continue making new lows, especially after a significant US data surprise. Divergence is not a guaranteed reversal nor a precise prediction of where liquidity rests. If a trader uses divergence, pair it with a predefined H1 Demand area and completed M5 bullish market-structure confirmation. Include failed examples when evaluating the method.
BEARISH MOMENTUM DIVERGENCE
A bearish divergence can arise when price makes a higher high while CMO makes a lower high over comparable periods. This may alert a trader to weakening upward momentum, but it does not justify immediately shorting a strong H4 bull trend. News-driven continuation can overwhelm a momentum warning. Consider the proximity of H1/H4 Supply and require actual bearish price confirmation if the strategy is countertrend. A divergence can persist for many bars without leading to a profitable short. The invalidation point must be explicit.
CENTERLINE CROSSOVERS IN SIDEWAYS MARKETS
During consolidation the sum of positive and negative price changes may alternate, causing CMO to cross zero repeatedly. Each crossing can look persuasive after the market eventually breaks out, but the failed crossings before that move are still real. A trader should mark H1 range boundaries and consider standing aside until a meaningful close beyond structure, rather than force every oscillator flip into a trade. Spread and commission can overwhelm small target distances when the market lacks directional follow-through.
CMO AND VOLATILITY ARE DISTINCT
CMO's ratio normalizes directional gains against total closing changes, so it measures a form of directional imbalance rather than the absolute size of all candle ranges. A reading near plus seventy can occur during a series of relatively small rising closes. Average True Range measures range magnitude and may remain low at the same time. This distinction matters when planning Stops: a high momentum score does not tell a trader whether Gold volatility has increased enough to require a wider structural invalidation. Combine measurements carefully.
M5 FORMING CANDLE SIGNAL CHANGES
As the current M5 candle develops, its Close keeps changing. CMO calculated using the current Close can therefore cross a threshold before the candle closes, then move back after a reversal. This is different from a calculation that improperly uses future candles, although some third-party scripts may also have genuine implementation problems. If a method requires completed engulfing or structure confirmation, take oscillator readings only on the closed bar and record the alert timing. A screenshot of a later historical bar cannot prove an earlier signal was available.
H4 H1 M5 BULLISH FRAMEWORK
A sample educational workflow starts with H4 Higher High/Higher Low structure, marks H1 Demand and observes CMO recovery from a negative reading as a supporting filter. Entry is conditional on a completed M5 bullish engulfing or Change of Character, not on CMO alone. Stop Loss should lie beyond a meaningful price swing, and reward space to H1 Supply must justify the risk. If the entry candle is already oversized or a Fed speech is imminent, the method may skip the trade even when the oscillator appears positive.
H4 H1 M5 BEARISH FRAMEWORK
For a bearish setup, a trader might require H4 Lower High/Lower Low structure, an H1 Supply retest and declining CMO momentum. A completed M5 bearish CHoCH or Engulfing may provide the price trigger. Stop Loss beyond the recent swing high and a target near the next H1 Demand define the trade geometry. If price holds above Supply, the bearish narrative can fail despite a negative oscillator. Traders should never average into losing positions simply because CMO has remained below zero. Risk limits precede any signal.
A GOLD CPI REACTION EXAMPLE
Suppose CPI surprises on the upside and US real yields rise, placing near-term pressure on XAUUSD. Gold approaches H4 Supply, where CMO shows a lower peak while price fails to accept higher levels. A completed M5 bearish structure break may be part of a Sell setup, but the first CPI candle can carry wide spreads and significant slippage. The trader should verify real yield and DXY reactions, calculate monetary risk using the broker's Gold contract details and skip if the target room is insufficient. This is not a live signal.
BACKTESTING CMO FAIRLY
Record the instrument, broker, timeframe, lookback, thresholds and exact closed-bar trigger. Compare a baseline H4/H1/M5 price-action strategy with and without a CMO filter. Preserve identical Stop, target, position size and trading-cost assumptions. Count rejected winners as well as avoided losers. A test using only successful divergence screenshots is biased. Assess net expectancy in R, maximum drawdown and behavior across trending and ranging months. Out-of-sample and forward testing are necessary before claiming a repeatable edge.
CMO INDICATOR FAQ
Does the CMO typically range between minus one hundred and plus one hundred? Yes, under its standard definition. Is CMO plus fifty equivalent to a guaranteed Buy? No. Does it measure exchange order flow? No. Can CMO diverge while price continues trending? Yes. Are CMO and RSI the same calculation? Not exactly; conventions and smoothing differ. Can values change before a candle closes? Yes. A robust method combines H4/H1 structure, a completed M5 trigger, a sensible structural Stop and realistic lot sizing rather than relying on a single indicator.
PIPSEPAISA FREE COURSES
Learn market structure, technical indicator interpretation and candle confirmation in Sir Sajid Khan Ghori's Free Forex Technical Analysis Course. Explore CPI, Fed policy and USD/Gold fundamentals with Sir Ghulam Abbas in the Free Forex Fundamental Analysis Course. Current enrollment is at www.pipsepaisa.com in Courses. Educational information only; leveraged Forex and Gold trading can result in significant losses.
Read in Roman Urdu
CHANDE MOMENTUM OSCILLATOR KYA HAI?
Chande Momentum Oscillator CMO Tushar Chande ka Price Momentum Indicator hai. Ye recent Closing Price Up Moves aur Down Moves ki magnitudes compare karke around -100 to +100 Score calculate karta hai. CMO Stock/Forex/Gold Charts par use possible, but direct Bank Orders ya Futures DOM Data nahi. High Positive Reading directional momentum imply, guaranteed next M5 green nahi. H4 Market Structure and H1 Supply/Demand plus full Candle Confirmation essential. Indicator alone Stop Loss or Pip Target define nahi.
CMO FORMULA
Common CMO Formula = 100 × (Sum Positive Close Changes − Sum Absolute Negative Close Changes)/(Sum Positive + Sum Negative Magnitudes). Gains aur Losses nonnegative magnitudes, direct account Trading Profit/Loss nahi. Denominator total price movement. Agar selected bars all same Close, Sum Zero, software zero divide handle kare. MT5 TradingView Scripts Price Source and Smoothing Methods differ ho sakte. Exact Implementation read. Indicator Score signed momentum, probability of profitable trade nahi.
CMO EXAMPLE CALCULATION
Hypothetical 5-Bar selected period mein Up Close Differences ka Sum 18 Price Units aur Down magnitudes Sum 6. CMO = 100×(18−6)/(18+6)=+50. Iska matlab Price +50% nahi, 50% guaranteed Win Chance bhi nahi. Positive Movement relative Negative more. Lookback Window shift ho aur older big candle leave kare to Score change. Price Candle small ho lekin Indicator line jump possible. Calculation selected Symbol units mein.
CMO MINUS100 PLUS100 SCALE
Standard CMO nonnegative Sum Gains/Losses logic se -100 to +100 bounded. +100 means selected Window all positive closing movement/no negative under formula, -100 opposite. Ye RSI or CCI same formula nahi. CCI +/-100 ke beyond go kar sakta, CMO bounded. Extreme Score Trend persistence possible, automatic Reverse guaranteed nahi. H1 Strong Demand/Supply location and M5 completed Price Structure confirmation.
CMO ZERO LINE
CMO Zero above recent Up Closing Moves magnitude more, Zero below Down more. Zero Cross Sideways H1 Range mein repeatedly false directional changes. H4 Bullish Trend aur M5 CMO Negative normal Demand Pullback ho sakta, H4 Trend reversal guaranteed nahi. Strategy Rule predefine: Zero Line trend filter ya actual entry trigger? H1 Swing Structure and M5 full CHoCH/Engulfing key. No Confirmation = No Trade.
CMO PLUS50
CMO +50 above some Momentum Traders Strong Bullish reading label kar sakte, but no universal profitable threshold. Gold Rally already H4 Supply touch kare, CMO +70 and Buy late bad RR. H4 HH/HL, H1 Demand Pullback, M5 Bullish Engulfing Full Close may offer better conditional entry. Positive Score alone P+ Buying Level institutional proof nahi. Next Resistance to Target Space and account risk.
CMO MINUS50
CMO -50 below bearish Momentum context, automatic Sell next Candle ya automatic Oversold Buy nahi. Strong H4 LH/LL with H1 Supply Retest and M5 bearish CHoCH Full Close conditional Sell. Price already H1 Demand close ho to bad Target Room. CMO minus70 Score exact Dollar Stop or Account Loss calculate nahi. Gold Lot Tick Value and EURUSD Pip Value separately. No Confirmation = No Trade.
CMO PERIOD SETTING
CMO Period14 examples common, lekin universally Best nahi. M5 14 Bars short timeframe and H4 14 Bars long market context. Smaller Period fast +50/-50 crosses and false signals more. Larger Period slow and less noise, Trend Flip delay. Gold/Forex volatility and sessions differ. MT5 Broker Price Feed, TradingView Session and Close differences matter. Parameter past winning trades dekh kar optimize Overfitting risk. Out-of-Sample data necessary.
CMO RSI DIFFERENCE
RSI common 0–100 scale and averaged gains/losses. CMO -100 to +100 and normalized directional Difference. Some specific RSI/CMO formulas mathematical transform related possible, but smoothing/period versions different. CMO Zero rough neutral momentum region, RSI often 50 reference. CMO +50 not RSI +50 equivalent. Two Momentum Indicators same price data derived, independent Institutional Buyers confirmations nahi. H1 Demand/Supply and M5 actual Candle.
CMO MACD DIFFERENCE
MACD EMA-based Moving Average Differences/Signal Line, CMO Summed Up/Down Closing Price Movements. MACD Histogram and CMO same Gold Chart par sometimes opposite. Formula/Timing differences. Indicators all historical Price Information reflect, actual Spot Forex Order Book data nahi. MACD + CMO + RSI colors same = A++ Guaranteed Win nahi. H4/H1 Price Structure and M5 confirmation baseline Backtest.
BULLISH CMO DIVERGENCE
Gold/EURUSD Price Lower Low aur CMO comparable Higher Low ho to Bullish Momentum Divergence possible. Ye Downside Movement intensity weaker ka clue, guaranteed Market Up reversal nahi. Strong H4 Downtrend mein many divergences fail. H1 Demand Reaction and M5 Bullish CHoCH Full Close required under tested method. Confirmed Swings compare, after-fact arbitrary lines draw mat karein. SL beyond structural swing and risk controls.
BEARISH CMO DIVERGENCE
Price Higher High aur CMO Lower High, potential Bearish Momentum Divergence. H4 Gold Strong Bullish Trend mein CMO Divergence multiple bars while price continues Up. Blind Sell against Trend risky. H1 Supply Zone and M5 Bearish Engulfing/CHoCH complete before conditional Sell. Price H4 Supply above acceptance to thesis invalid possible. CMO divergence alone Bank Selling proof nahi. Stop and target actual price zones.
SIDEWAYS CMO WHIPSAW
H1 Sideways Range mein Up/Down Closing Change Sums similar; CMO Zero around repeated Crosses. Har Cross Buy/Sell to multiple Slippage/Spread Costs, fake signals. H1 Range Supply top, Demand bottom and H4 Bias mark. M5 completed Structural BOS/CHoCH and valid Retest better conditional. No trade is valid. One Breakout successful after 7 losses, Journal all signals count. No Confirmation = No Trade.
CMO ATR DIFFERENCE
CMO directional closing price gains/losses ka ratio, ATR total Price Range Volatility. CMO +70 but actual Candle ranges small possible, ATR low. Strong directional consistency and large pip volatility same concept nahi. Stop Loss H1 actual Swing, ATR context and Account Equity Risk. CMO Score se Gold Lot multiply ya leverage raise justified nahi. EU/USD and XAUUSD Tick/Pip monetary values differ. Technical indicators context, exact Broker stop fills not guaranteed.
CMO CANDLE CLOSE
M5 Forming Candle ka Current Close change, CMO +50 crossing temporary then price reverse to below. Agar Alert Once Per Bar open use kare, final history different. Strategy rule M5 full close ho to Indicator buffer previous closed bar read. TradingView Pine and MT5 EA Signal Timing audit. Future H1 bar final data earlier M5 entry par use = lookahead bias. Real Trading slippage and loss risk. No Confirmation = No Trade.
H4 H1 CMO BUY SYSTEM
H4 HH/HL Bullish Structure, H1 P+ Buying Zone, CMO negative se recovery, M5 Bullish Engulfing/CHoCH Full Close. Conditional Buy idea tested Rules ke under. Stop meaningful Swing Low below, TP nearest H1 Supply; RR poor to skip. CPI/NFP/FOMC News near ho, spread high then No Trade. CMO Positive alone Entry Alert not sufficient. Gold Contract risk-based Lot. No Confirmation = No Trade.
H4 H1 CMO SELL SYSTEM
H4 LH/LL Bearish Structure, H1 P+ Selling Zone, CMO Down Momentum and M5 Bearish CHoCH/Engulfing Full Candle Close. Conditional Sell, SL above relevant Swing High, TP next H1 Demand. Gold H1 Supply above strong Close to short thesis weak. CMO negative means trade cannot lose, false. Recovery Lot Double after SL significant risk. Planned Loss per Trade fixed. No Confirmation = No Trade.
GOLD CPI CMO EXAMPLE
Hypothetical Hot CPI, US Real Yields Up and DXY Higher, Gold H4 Supply. CMO Bearish Divergence possible, M5 completed Bearish CHoCH after rejection. Conditional Sell only if risk/reward room, Stop Swing High above, target H1 Demand. News M1 huge Candle chase not allowed. Gold Tick Value, Broker Spread, Slippage and Equity Risk calculate. CMO Score exact XAUUSD price target nahi. Educational example, not financial advice.
CMO BACKTEST
CMO Period, ±50 Threshold, H4 Trend, H1 Demand/Supply, M5 Engulfing/CHoCH and closed-bar timing written. Price-Only Baseline vs CMO Filter same dates, Stops, Lot, Spread test. Filter rejected profitable trades as well as losers count. Hindsight Divergence Winners only publish misleading. Net R, Drawdown and Trade Count. Forward Demo test. Zero Line Market Range False Signals audit. No Confirmation = No Trade.
CMO FAQ
CMO Standard Range -100 to +100? Haan. Plus50 guaranteed Buy? Nahi. Exchange Order Flow measure? Nahi. Divergence with Trend Continuation possible? Haan. CMO RSI same formula? Not exactly. Forming Candle value move? Haan. Correct Workflow H4 Trend → H1 Supply/Demand → CMO optional Momentum Filter → M5 Full Engulfing/CHoCH → Structural SL/TP/Minimum Lot & Equity Risk. No Confirmation = No Trade.
PIPSEPAISA FREE COURSES
Sir Sajid Khan Ghori Free Forex Technical Analysis Course aur Sir Ghulam Abbas Free Forex Fundamental Analysis Course www.pipsepaisa.com Courses section. Ye Educational Guide hai, personal financial advice nahi. Leveraged Forex/Gold mein Loss Risk.
CMO AND NEWS VOLATILITY
Important Gold CPI, NFP aur Fed FOMC Release ke first M1 price spike CMO extreme bana sakti hai, but Broker Spread Wide and Liquidity thin. If H1 Supply/Demand nearby, delayed entry bad Risk/Reward. CMO threshold +50/-50 one static future Profit Signal nahi. Trader Actual US Bond Yield, DXY News Reaction, H4 Structure and M5 Fully Closed Candle consider kare. M5 CHoCH incomplete ho to no order. Forex Trading Discipline missed first News move ke liye revenge trade nahi. Stop Loss exact Fill Price guaranteed during severe slippage nahi.
RELIABLE INDICATOR VALIDATION
TradingView Pine aur MT5 iCustom CMO calculated Series compare karte waqt source Close Price, Lookback Window, Shift Index, Sign and zero denominator handling verify karein. If Current M5 Bar CMO +50 briefly touch then Close +18, backtest mein signal at +50 assumed fill wrong. EA closed Candle Buffer i=1 according implementation use kare. Historical earliest Bars initialization differences possible. Position Size actual Pip/Point/Tick Value. One successful Divergence screenshot no statistical proof. Review all Losers, Winners, No Trade sessions. No Confirmation = No Trade.
Educational content only. Trading involves risk. Always use independent analysis and appropriate risk management.