
Supply and Demand Zones in Forex: Identification, Confirmation and Invalidation
PipSePaisa • Forex Education & Research
INTRODUCTION
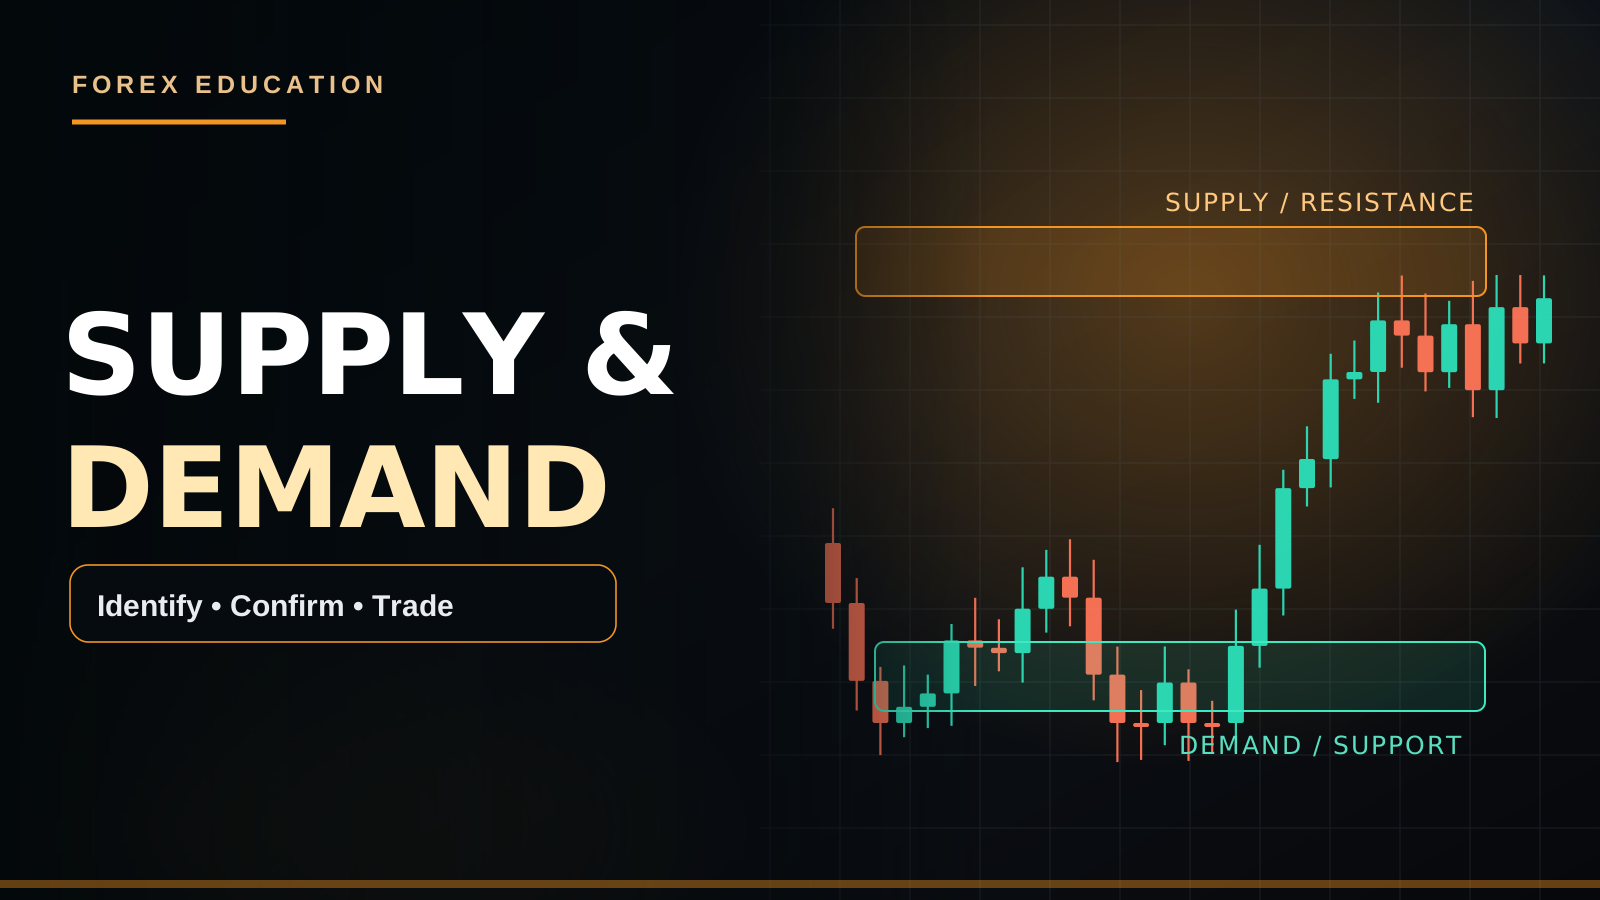
A supply zone is a price area where selling pressure previously overwhelmed buyers, while a demand zone is an area where buying pressure previously overwhelmed sellers. The chart shows where price responded in the past; it does not reveal a guaranteed pool of future institutional orders. That distinction prevents overconfident entries.
1. IDENTIFY AN IMPULSIVE DEPARTURE
On H4 or H1, look for a narrow base or consolidation followed by a clear directional move. For a demand zone, identify the base preceding an upward impulse; for supply, the base preceding a decline. Draw a band around the relevant candles using a consistent rule, then mark where your setup would be invalidated.
2. FRESHNESS AND CONTEXT
A zone that has not been revisited since the impulse may deserve attention because price response there is still untested. Yet 'fresh' does not mean guaranteed. Evaluate trend direction, nearby higher-timeframe levels, number of past retests, the size of the departure and how far price has already traveled.
3. EXAMPLE OF A DEMAND SETUP
Assume a hypothetical instrument forms a base between 98 and 100 and then rallies to 108. That 98–100 region becomes a candidate demand zone. On return, a trader watches whether selling weakens and whether lower-timeframe structure turns higher. A close decisively below the zone may weaken the bullish hypothesis.
4. ENTRY METHODS
An aggressive method places a limit order inside the zone, which can fill without confirmation and fail quickly. A conservative method waits for a rejection, an engulfing close or an M5/M15 change of character before considering a trade. Neither approach eliminates risk; the confirmation method may require a wider stop or produce a less favorable entry.
5. STOP LOSS AND TARGETS
Place invalidation where the underlying demand/supply thesis is no longer credible, often beyond the relevant swing extreme. Position size should follow stop distance and risk budget. Potential targets include opposing zones or structure levels, not arbitrary round-number returns.
6. HOW TO AVOID BAD ZONES
Do not mark every candle as a zone. Ignore vague, overlapping areas without a sharp departure. Avoid confusing a historical reaction with evidence of a live large order. Economic releases can overwhelm a technically clean area.
FAQ
Is supply/demand identical to support/resistance? They overlap, but supply/demand usually emphasizes the origin of an impulsive move and a price area rather than a single line. Do zones always hold? No; every zone eventually may fail.
SUPPLY/DEMAND AS A RANGE
Suppose a market rallies strongly after consolidating between 98 and 100. A potential demand zone is the area of prior buying activity, not necessarily the exact quote 100. Price may return to 99, wick beneath 98 or fail completely. Mark consistent boundaries based on the price base and avoid redrawing them after the fact.
FIND THE ORIGIN ON H4 OR H1
Identify a base followed by clear directional displacement. A demand zone usually originates before a decisive upward move; a supply zone before a strong fall. The move becomes more interesting if significant structure is broken, but that is still historical evidence, not proof that unfilled institutional orders remain.
FRESH AND TESTED ZONES
A fresh zone has not yet been revisited, while a tested one has already produced one or more reactions. Neither status guarantees a future response. Trend strength, distance from opposing zones, volatility and repeated retests affect the context. Avoid assuming every untouched area must eventually be defended.
TWO ENTRY STYLES
A limit order inside the zone is an aggressive approach: it can capture a better price but can also fill during a failed zone. A confirmation-based approach waits for M5/M15 rejection, a closed Engulfing Candle or a CHoCH. It may miss some moves but establishes an observable trigger. Decide which model is yours before trading.
DEMAND EXAMPLE
Hypothetical H1 demand lies at 98–100; price rallies to 108 and returns. If M5 dips to 99, forms a higher low and closes above local resistance at 100.5, a trader may evaluate a long with invalidation beyond the rejection low. The prior high or opposing supply is a possible target. Without confirmation, the zone touch is not an entry.
SUPPLY EXAMPLE
EUR/USD falls sharply from 1.1050–1.1070 and breaks H1 structure. On a rally back into that supply band, wait for bearish rejection or an M5 lower high. If price closes above the band and holds, the short thesis weakens. Always examine the next demand zone below to judge realistic reward.
FAILURES AND NEWS
Strong trends and macroeconomic surprises can slice through neat zones. During CPI, NFP or FOMC, spreads and slippage can expand. Repeatedly adding to a losing position because a historical zone 'must hold' exposes capital to compounding risk.
FAQ
Is a zone an Order Block? Related but not identical definitions. Is a fresh zone always best? No. Which timeframe? H4/H1 context, M15/M5 confirmation is one common approach.
THE ECONOMIC MEANING VS THE CHART MODEL
In economics, supply and demand describe how available quantity and willingness to transact interact with price. In chart-based trading, a Supply or Demand Zone is an inferred area where buying or selling previously dominated enough to create an observable move. The chart does not reveal all future orders at that price. The zone is a way to define a potential reaction location, not a certificate that buyers or sellers must return.
DRAW THE BASE AND DEPARTURE
Look for a relatively tight base followed by an obvious impulsive sequence. In a rally-base-rally pattern, the middle base may be considered a continuation demand area. A drop-base-rally may mark a reversal demand candidate. Rally-base-drop and drop-base-drop are common bearish counterparts. These names describe visible price sequences and should not be treated as four guaranteed trading signals. Consistency in identifying the base matters more than naming conventions.
CANDLE BODIES VS WICKS
One trader may draw demand from the lowest wick through the highest body of the base; another may use the entire candle range. Both can be made testable, but mixing them selectively after losses introduces hindsight bias. Record exactly which candles create the zone. If one base lasts two candles and another spans twenty, the trading logic may not be comparable.
WHAT MAKES A ZONE INTERESTING?
A strong departure with successive closes away from the base, a meaningful structure break, a previously untested origin and agreement with the H4 trend are commonly studied. None guarantees a bounce. A fresh zone directly below a major bearish macro surprise might fail, while an older zone can still produce a reaction. Evaluate trend, volatility, location and opposing zones together.
MITIGATION AND RETEST BEHAVIOR
Some frameworks call a revisit to an origin area "mitigation." A bounce might occur as resting liquidity interacts with new orders, or price may simply continue through. Traders cannot infer the exact institutional order book from a retail forex candle. Repeated retests should be documented objectively: first return, second return and so on. Do not quietly change the zone after each revisit.
DEMAND-ENTRY CASE STUDY
A hypothetical instrument makes a base at 98–100, rallies to 108 and later returns. If price touches 100 and immediately moves away, the trader using limit entries might participate, while a confirmation-based trader may miss it. On a deeper return to 99, suppose M5 first breaks below a local low, then closes above a prior short-term high. That can form a possible bullish structure-shift confirmation. The invalidation is below the relevant swing, not necessarily exactly at 98. Check how much target space remains.
SUPPLY-ENTRY CASE STUDY
EUR/USD consolidates around 1.1050–1.1070 before a downward displacement breaks a meaningful H1 low. On revisit, M15 prints a long upper wick and M5 creates a lower high followed by a bearish close. A trader may interpret this as selling pressure returning. But if the next H1 candle reclaims and holds above 1.1070, the hypothesis weakens. A proper plan specifies invalidation and does not keep shifting it higher.
HOW MARKET STRUCTURE CHANGES THE MEANING
A demand area aligned with H4 higher lows supports a possible trend continuation thesis. An identical-looking demand area beneath an H4 Lower High during a major downtrend is countertrend and may be less dependable. Traders need a rule for handling conflicts between H4, H1 and M5. Lower-timeframe CHoCH is useful for timing but does not automatically overrule the higher-timeframe trend.
NEWS AND VOLATILITY
CPI, NFP and FOMC can rapidly change market expectations and overwhelm historical zones. Spread expansion increases the effective cost of tight entries, and slippage can exceed planned losses. A historical Supply Zone may be broken because genuinely new information changed the fair price, not necessarily because traders were manipulated. Standing aside around a release is a valid strategy condition.
A ZONE QUALITY WORKSHEET
Write down the timeframe; price boundaries; candle count in the base; whether departure broke structure; how many retests occurred; direction of the higher timeframe; distance to opposing zone; upcoming economic events; required confirmation; invalidation and lot size. Evaluate historical samples using exactly the same fields. This is more useful than calling a zone A++ based on subjective appearance without a documented definition.
QUESTIONS TO CHECK UNDERSTANDING
Does touching H1 demand mean Buy? No. Does one rejection wick prove buyers are returning permanently? No. Can both supply and demand zones fail? Yes. Should a wider stop lead automatically to a bigger lot? No, usually the opposite for a fixed money-risk budget. Always remember: No Confirmation = No Trade.
CONCLUSION
Use higher-timeframe context, a consistent zoning method, lower-timeframe confirmation where appropriate and defined risk. No Confirmation = No Trade can be a helpful discipline rule.
CONTINUE LEARNING WITH PIPSEPAISA
Free Forex Technical Analysis Course — Sir Sajid Khan Ghori. Want to join? Message our team on WhatsApp or visit the Courses tab at www.pipsepaisa.com to enroll.
Free Forex Fundamental Analysis Course — Sir Ghulam Abbas. Want to join? Message our team on WhatsApp or visit the Courses tab at www.pipsepaisa.com to enroll.
EDUCATIONAL RISK NOTICE
Examples are hypothetical, not live signals or personal financial advice. Leveraged trading carries substantial risk, including loss of capital.
Read in Roman Urdu
INTRODUCTION
Supply Zone woh price area hai jahan pehle selling pressure strong tha. Demand Zone woh area hai jahan buying pressure strong tha. Chart se historical reaction nazar aati hai, lekin ye guarantee nahi hoti ke wahi orders future mein bhi maujood hon.
1. ZONE IDENTIFY KARNA
H4/H1 chart par consolidation ya chhoti base dhoondein jahan se strong impulsive move start hui. Upar ki strong movement se pehle wala base potential Demand Zone, aur neeche ki movement se pehle wala base Supply Zone ho sakta hai.
2. FRESH ZONE AUR CONTEXT
Agar price ab tak zone par wapas nahi aayi to usay 'fresh' kaha jata hai. Phir bhi guarantee nahi. Overall trend, higher timeframe level, retest count aur impulsive move ki quality check karein.
3. EDUCATIONAL EXAMPLE
Agar price 98–100 ke darmiyan base banaye aur 108 tak rally kare to 98–100 possible Demand Zone ho sakta hai. Jab price wapas aaye to buying rejection, M5/M15 structure shift ya confirmation close observe karein. Strong close zone ke neeche aaye to bullish idea weak ho sakta hai.
4. ENTRY METHODS
Aggressive entry mein trader directly zone mein limit order lagata hai. Conservative trader rejection, engulfing candle close ya CHoCH ka wait karta hai. Dono methods mein risk hota hai.
5. SL AUR TP
Stop Loss thesis ke invalidation swing ke beyond plan karein. Opposite supply/demand ya market structure target consider kar sakte hain. Risk budget se lot size calculate karna zaroori hai.
6. COMMON MISTAKES
Har chhoti candle ko zone banana, har touch par trade lena, news ignore karna aur historical zone ko guaranteed institutional order samajhna galat hai.
FAQ
Kya zone aur Support/Resistance same hain? Related concepts hain; zone method aksar impulsive origin par focus karta hai. Kya zone fail ho sakta hai? Bilkul.
ZONE KYA HAI?
Agar price 98–100 ke area mein base banaye aur phir strong 108 tak jaye, to woh previous area possible Demand Zone ho sakta hai. Sirf 100 ki exact line guaranteed reversal point nahi. Price 99 tak aa sakti hai, 98 se neeche wick bana sakti hai, ya poora zone break bhi kar sakti hai.
H4/H1 PAR KAISE MARK KAREIN?
Pehle chhoti consolidation ya base dhoondein. Uske baad strong bullish departure ho to potential Demand Zone; strong bearish departure ho to potential Supply Zone mark karein. Significant swing break extra context de sakta hai. Historical move se future institutional orders ki guarantee prove nahi hoti.
FRESH ZONE VS TESTED ZONE
Fresh woh zone hai jahan price ab tak wapas nahi aayi. Tested par price pehle react kar chuki hai. Fresh hone ka matlab guaranteed bounce nahi. H4 trend, opposite zone ki distance, volatility aur repeated retests bhi consider karein.
ENTRY KE 2 METHODS
Aggressive trader zone mein Limit Order pehle se rakhta hai. Entry better mil sakti hai lekin zone fail bhi ho sakta hai. Conservative trader M5/M15 Engulfing close, rejection candle ya CHoCH ka wait karta hai. Confirmation ka wait karne se kuch moves miss honge, lekin rule objectively follow ho sakta hai.
DEMAND EXAMPLE
H1 Demand 98–100 hai aur price 108 se wapas aati hai. M5 par low 99 banta hai, phir higher low aur 100.5 ke upar bullish close aaye to possible Buy setup evaluate karein. SL rejection low ke beyond aur TP opposing Supply ke paas plan ho. Sirf zone touch par trade nahi.
SUPPLY EXAMPLE
EUR/USD 1.1050–1.1070 area se gir kar H1 low break karti hai. Retest par M5 lower high ya bearish close aaye to possible Sell scenario ho sakta hai. Agar price Supply ke upar close kar ke hold kare to bearish idea weak ho sakta hai. Neeche Demand tak target distance bhi dekhein.
ZONE FAIL KYUN HOTI HAI?
Strong market trend aur CPI/NFP/FOMC news par zones break ho sakti hain. Wide spreads aur slippage risk barhate hain. 'Zone zaroor hold hogi' samajh kar losing trade mein repeatedly lot add karna risky hai.
FAQ
Order Block aur Zone same? Related, rules different. Fresh zone guaranteed? Nahi. Timeframe? H4/H1 context aur M15/M5 entry timing ke liye useful.
GOLDEN RULE
Zone → Price Reaction → Confirmation Close → SL/TP → Entry. No Confirmation = No Trade.
ECONOMIC SUPPLY DEMAND AUR TRADING ZONE MEIN FARQ
Economics mein Supply/Demand ka matlab market mein available quantity aur buyers/sellers ki willingness se price formation hoti hai. Trading chart par Supply/Demand Zone usually woh historical area hota hai jahan se buying ya selling pressure strong movement produce karne mein successful hui thi. Ye chart model hai. Is se prove nahi hota ke exact same future pending orders wahan guaranteed maujood hain. Trader zone ko possible reaction area ke taur par mark karta hai, compulsory reversal point nahi.
BASE AUR DEPARTURE KO PEHCHANEIN
Jab price thori der narrow range ya small candles mein base banaye aur uske baad strong impulse aaye to us base ko mark karna ek common approach hai. Rally-Base-Rally pattern continuation Demand ka model ho sakta hai. Drop-Base-Rally possible reversal Demand hai. Rally-Base-Drop aur Drop-Base-Drop Supply-side counterparts ho sakte hain. Lekin ye chaar naam chart structures describe karte hain, guaranteed signals nahi. Har setup mein base select karne ka consistent rule hona chahiye.
BODY AUR WICK SE ZONE KAISE DRAW KAREIN?
Kuch traders Demand Zone lowest Wick se base Body top tak mark karte hain. Kuch traders candle ka full high-low range use karte hain. Dono methods tabhi test ho sakte hain jab aap ek clear rule hamesha follow karein. Agar loss ke baad line shift kar di ya Zone extra wide kar diya to honest Backtesting kharab ho jati hai. Pehle hi note karein ke kaun se candles origin base create kar rahi hain, aur kitni candles ko base count karna acceptable hai.
HIGH QUALITY ZONE KA MATLAB
Zone se strong departure, multiple completed candles, meaningful BOS, fresh origin aur H4 trend alignment extra context de sakte hain. Lekin Fresh Zone guaranteed Buy nahi. Agar H4 downtrend strong hai aur ek chhoti M5 Demand bani to uski risk profile H4 Trend-aligned Demand se different hogi. Nearby Supply kitni door hai? CPI ya NFP qareeb hai? Price kis session mein aa rahi hai? Ye factors bhi zone ki practical importance change karte hain.
MITIGATION AUR RETESTS
SMC frameworks mein price jab origin area ko revisit kare to usay Mitigation kaha ja sakta hai. Kabhi wahan price reverse karegi, kabhi thori range banayegi aur kabhi direct level break karegi. Retail Forex candles se kisi bank ka complete pending order book verify nahi hota. First Retest, Second Retest aur later Retests ko alag record karein. Har visit par Zone boundaries change kar ke result improve show karna inaccurate hai.
DEMAND EXAMPLE STEP BY STEP
Hypothetical price 98–100 ke area se rally kar ke 108 tak jati hai. Phir wapas 100 par aati hai. Aggressive Limit Order trader ko first touch mil sakta hai, lekin confirmation-based trader ko setup miss ho sakta hai. Ab suppose price 99 tak wapas aayi, M5 par local low sweep hua aur phir bullish candle previous minor high ke upar close hui. Ye possible bullish structure shift hai. Stop Loss meaningful rejection low ke beyond plan karein, blindly 98 par nahi. Next Supply tak reward distance calculate karein; agar room kam ho to skip.
SUPPLY EXAMPLE STEP BY STEP
EUR/USD 1.1050–1.1070 ke base se fall karti hai aur important H1 Low break hota hai. Jab price retest mein Supply par aaye to M15 upper wick, M5 Lower High aur bearish confirmation close de sakti hai. Ye sellers ke possible response ka clue ho sakta hai. Lekin agar H1 candle 1.1070 ke upar close kar ke hold kare to Bearish Hypothesis weak ho jati hai. Stop ko har time upar shift karte rehna Risk Management rule violate karta hai.
H4 TREND ZONE KO KAISE AFFECT KARTA HAI?
Agar H4 Higher High/Higher Low bana raha ho aur H1 Demand aligned ho, to possible bullish continuation location mil sakti hai. Lekin H4 Lower High/Lower Low ke andar ek chhoti Demand Countertrend setup hai. Dono situations mein same candle pattern ka context equal nahi. M5 CHoCH useful timing clue de sakti hai, lekin H4 trend automatically reverse nahi hota. Timeframe hierarchy pehle define karein: H4 Bias, H1 Zone, M15 Setup, M5 Entry.
NEWS AUR FAILED ZONES
CPI, NFP aur FOMC data ke baad market ki fair-value expectations change ho sakti hain. Strong information purani Demand ya Supply ko direct break karwa sakti hai. News ke waqt Spread Wide, Slippage aur fast price spikes normal chart structure ko disrupt kar sakte hain. Iska matlab zaroori nahi market intentional Stop Hunt kar rahi thi. Economic surprise market price ko genuine new direction bhi de sakta hai. News window mein Trade Skip karna acceptable strategy rule hai.
ZONE QUALITY WORKSHEET
Har selected zone ke liye likhein: Timeframe kya? Upper/Lower Boundary kitni? Base mein kitni Candles? Displacement strong thi? BOS hua? Kitne Retests huay? H4 Direction kya hai? Nearest opposite zone? Economic Calendar? Entry Confirmation? Invalidation? Risk Budget aur Lot? Jab historical charts test karein to ye same fields use karein. Sirf subjective A++ label dekh kar guaranteed quality assume na karein.
FAQ AUR GOLDEN RULE
Kya Demand touch hona Buy signal? Nahi. Long Wick ka matlab permanent bullish reversal? Nahi. Kya fresh Zone bhi fail? Haan. Agar structural Stop Loss double wide ho to lot automatically double? Nahi, same risk rakhne ke liye lot normally kam hogi. Process hamesha: Higher Timeframe → Mark Zone → Wait for Price → Confirm Candle/Structure → Calculate Risk → Consider Entry. No Confirmation = No Trade.
CONCLUSION
H1/H4 zone, proper context, candle confirmation aur disciplined risk management ko saath use karein. No Confirmation = No Trade.
PIPSEPAISA KE FREE COURSES
Sir Sajid Khan Ghori ka Free Forex Technical Analysis Course join karna hai? PipSePaisa team ko WhatsApp par message karein ya www.pipsepaisa.com ke Courses tab se enroll karein.
Sir Ghulam Abbas ka Free Forex Fundamental Analysis Course join karna hai? WhatsApp par message karein ya Courses tab se enrollment karein.
RISK DISCLAIMER
Ye examples sirf education ke liye hain, live signals ya personal financial advice nahi. Leveraged trading mein capital lose ho sakta hai.
Educational content only. Trading involves risk. Always use independent analysis and appropriate risk management.