
Fair Value Gap (FVG) in Forex: Bullish and Bearish Imbalances, Mitigation and Entry Confirmation
PipSePaisa • Forex Education & Research
INTRODUCTION — WHY FAIR VALUE GAPS MATTER
Fair Value Gap, usually abbreviated FVG, is a price-action concept used by traders who study strong directional movement and the areas that price crosses with relatively little visible overlap. It is particularly popular in Smart Money Concepts discussions, but the term does not mean that the market has discovered an objectively measurable fair economic value. A gap on a retail candlestick chart is an analytical pattern, not a guarantee that any bank must fill an order there. To learn it properly, understand the three-candle definition, market structure, timeframe, confirmation, risk and alternative outcomes.
THE THREE-CANDLE BULLISH FVG
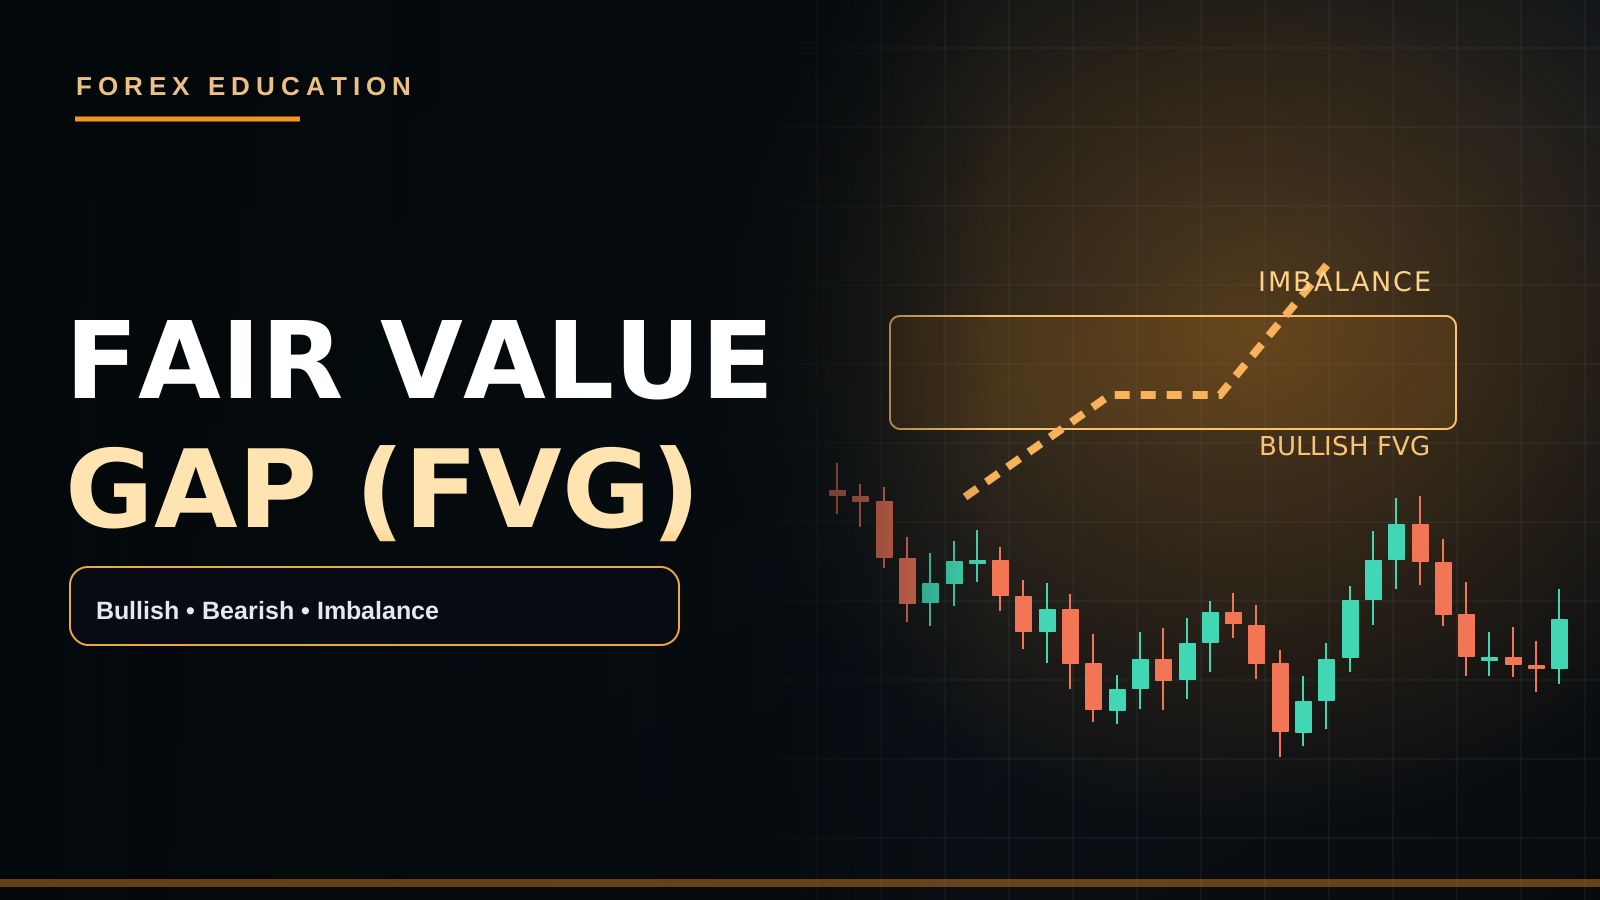
Imagine three completed candles in chronological order. For a common bullish FVG definition, Candle 1 has a high, Candle 2 advances decisively and Candle 3 has a low above Candle 1's high. The price interval between the first candle's high and the third candle's low becomes the bullish imbalance zone. The middle candle usually shows displacement. The candle bodies and wicks matter because traders who measure different boundaries can produce different zones. Choose an explicit rule and keep it consistent across historical and live charts.
THE THREE-CANDLE BEARISH FVG
For a common bearish FVG, Candle 1 has a low, Candle 2 drives price lower and Candle 3 has a high below Candle 1's low. The interval from Candle 3's high to Candle 1's low is the bearish imbalance area. A trader may later watch the zone for a possible selling reaction. But the pattern says nothing certain about whether price will revisit it or continue through it. Some bearish displacements never retest and some zones fail immediately when price returns.
FVG AND A REAL MARKET GAP ARE NOT IDENTICAL
A weekend price gap occurs when the next market price jumps beyond a previous close, sometimes because trading was closed. The three-candle FVG is often identified even in continuous intraday trading with no market shutdown. It is better described as limited candle-range overlap within a directional sequence. A three-candle chart pattern cannot prove that no trading occurred at the prices inside the marked rectangle. Distinguish candles from centralized order-book data and never claim the chart reveals hidden institutional orders with certainty.
HOW TO MARK THE ZONE WITHOUT REPAINTING
Select H1 or H4 first. Wait until all three candles have completed, check the chosen wick-overlap rule and draw the exact upper and lower boundaries. Record the creation time. Do not adjust the rectangle after later candles reveal the outcome. A useful annotation states: timeframe, bullish or bearish direction, whether the middle candle closed beyond previous structure, and whether the price has retested the area. A zone that is widened after a loss has stopped being a repeatable analytical rule.
FVG AND MARKET STRUCTURE
A bullish H1 FVG appearing during an established H4 uptrend may support a possible continuation scenario when price pulls back. The same bullish pattern inside an aggressive H4 downtrend may produce only a temporary retracement. Look at Higher Highs, Higher Lows, Lower Highs and Lower Lows before deciding how to interpret the imbalance. If an FVG forms after a meaningful Break of Structure, that adds a different context than an FVG appearing in the middle of a narrow choppy range.
MITIGATION, PARTIAL FILL AND FULL FILL
Traders commonly use the term mitigation when price later revisits an FVG. Some watch its upper edge, some the midpoint and some the far boundary. A partial revisit might still produce a response, while another setup may see price move through the entire area. No single rule obligates price to fill half or all of an FVG. Define whether your strategy permits a first-touch entry or instead requires confirmation after the revisit. Those are distinct systems with different frequencies and risk profiles.
EXAMPLE: BULLISH FVG IN EUR/USD
Suppose Candle 1's high is 1.1000, a strong middle bullish candle advances, and Candle 3's low is 1.1012. Under the wick-based definition, the potential bullish FVG lies from 1.1000 to 1.1012. If the H4 trend is bullish and H1 shows a recent structure break, a return into the band may become an area to observe. It is not an automatic Buy at 1.1012. Wait for price reaction, monitor spread, and ensure the next resistance offers sufficient space for a sensible target.
CONFIRMATION BEFORE EXECUTION
One model might require price to reach the FVG and then show M5 bullish engulfing or a confirmed bullish CHoCH. A bearish setup could require a completed M5 lower high and a bearish close beneath local support. An unclosed candle can change shape in seconds. If the confirmation candle is huge, the entry may be too far from structural invalidation and the risk-to-reward unattractive. The correct response can be to skip instead of chasing the move.
FVG, ORDER BLOCKS AND SUPPLY-DEMAND
An Order Block is frequently defined as an origin candle or base preceding displacement; an FVG reflects a later three-candle imbalance. These can overlap or be adjacent, but they are not identical by definition. A conventional Supply/Demand Zone is another historical reaction area, often built from a base and departure. Multiple patterns in one location are not independent guarantees. Record which factor actually adds information to your chosen strategy and do not label every rectangle institutional.
FAILED FVG AND CONTINUATION THROUGH A ZONE
Suppose a bullish FVG receives a small positive reaction and then an H1 candle closes decisively beneath the zone. That information challenges the bullish continuation idea. A trader may mark the zone invalid and stand aside rather than adding larger Buy positions. Price can also return to the zone and move sideways before choosing a direction. Failure is not proof of manipulation or of a hidden institutional battle; it is a normal possible price outcome.
TRADING COSTS AND MARKET EVENTS
During CPI, NFP or FOMC, strong candles can create apparent FVGs alongside wider spreads and fast slippage. A zone formed during a release may behave differently from one created in a stable London session. Do not assume the order book behind every candle is comparable. If your method excludes high-impact news, apply that filter before entry. A Stop Loss can slip during a gap and no chart pattern removes leveraged-trading risk.
ADVANCED CASE: TWO FVG ZONES ON THE SAME H1 CHART
Suppose Gold rises rapidly and leaves two bullish three-candle imbalance patterns: one near a recent H1 Higher Low and another higher up after an extended rally. The lower zone might be closer to historical demand and thus offer structural confluence, while the upper one might be located immediately under H4 Supply. The word FVG describes both patterns, but it does not make them equally attractive. A trader can write a priority rule: trade only a fresh zone aligned with higher-timeframe swing direction and with at least a pre-defined amount of target space. If the lower zone is never revisited, the setup never occurs. Do not quietly substitute the higher zone solely because you want a trade.
FIRST TOUCH VS CONFIRMATION — A FAIR COMPARISON
For a Buy Limit at the FVG's upper edge, the trader decides before price arrives that entering at the level is acceptable. That can improve entry price when the zone bounces immediately, but also leads to fills during powerful adverse moves. A confirmation trader waits until the price has entered the band and M5 creates a completed bullish shift. This avoids some failed first touches but may enter later or miss fast reversals. Neither method is universally superior. A serious test should count all qualifying zones and report net expectancy, maximum drawdown, average Stop Loss distance and the number of setups missed under each method.
PARTICIPATION DURING A STRONG TREND
Strong trends can form several consecutive FVGs. Treating every zone as a separate high-confidence signal can lead to excessive correlated exposure. If the same H4 bullish trend drives three M5 imbalance areas, three long entries may actually represent one macro bet. Define a maximum combined dollar risk for related positions. Some methods allow only the first pullback after a new BOS, while others permit later zones if a new swing structure forms. These decisions belong in the playbook before the market begins moving. A stacked set of FVG labels is not diversification.
A FAILED-SWEEP SCENARIO
Imagine EUR/USD briefly crosses Previous Day High, then prints strong bearish displacement leaving an M5 bearish FVG. It subsequently returns into the imbalance. A conservative setup could require an H1 resistance context, a confirmed sweep reclaim, a bearish M5 lower high and a finished bearish engulfing. The stop would belong beyond meaningful invalidation, not necessarily exactly at the FVG's top border. The target might be the range midpoint or a nearby H1 Support band. Even with every condition met, another USD release could cause price to break higher and invalidate the setup. The point is to distinguish a coherent scenario from a guaranteed prediction.
HOW TO STUDY FVG PERFORMANCE
Build a record with creation date, timeframe, zone boundaries, candle displacement size, nearest H4 Supply/Demand, whether BOS occurred, first/second retest, M5 entry trigger, Stop Loss and target. Include spreads, trade expiration rules and all invalidated setups. Compare your chosen FVG definition with a baseline such as trades from plain H1 Support/Demand using the same confirmation. If the FVG label does not improve net behavior compared with simpler levels, its added complexity might not be justified. Statistical estimates from historical charts remain uncertain and should never be presented as guaranteed returns.
PIPSEPAISA FREE COURSES
For structured Technical Analysis and practical price-action concepts, explore the Free Forex Technical Analysis Course with Sir Sajid Khan Ghori. For the underlying economics of currency and Gold movements, learn in the Free Forex Fundamental Analysis Course with Sir Ghulam Abbas. Visit www.pipsepaisa.com, open Courses and follow the enrollment instructions. Joining a course does not guarantee trading outcomes.
CONCLUSION AND DISCLAIMER
A Fair Value Gap is a clearly defined chart pattern that can help traders mark an area for observation after displacement. Its usefulness depends on trend context, accurate marking, realistic execution conditions and evidence from honest testing. The discipline remains Location → Reaction → Completed Confirmation → Risk Calculation → Possible Trade. No Confirmation = No Trade. All examples are hypothetical and for education only, not personal investment advice. Leveraged products can cause losses.
Read in Roman Urdu
INTRODUCTION — FAIR VALUE GAP KYA HAI?
Forex Trading mein Fair Value Gap ko FVG kehte hain. Ye Price Action aur Smart Money Concepts ka ek popular pattern hai jo strong movement ke dauran Candles ke darmiyan relatively kam overlap wali price range ko identify karta hai. Lekin iska naam Fair Value hone ka matlab ye nahi ke market ka mathematically exact fair economic price mil gaya. Retail Chart par FVG mark karna ek analysis method hai; guaranteed Bank Orders ka proof nahi. Is article mein Three-Candle Rules, Bullish/Bearish FVG, H1/H4 Context, Retest, Confirmation, Risk aur Failures ko practically samjhenge.
BULLISH FVG KI THREE-CANDLE DEFINITION
Teen completed Candles ko sequence mein dekhein. Common Bullish FVG model mein Candle 1 ka High, Candle 2 ka strong upward move aur Candle 3 ka Low, Candle 1 ke High se upar hota hai. Pehli Candle ke High aur teesri Candle ke Low ke darmiyan jo Price Band banta hai usay Bullish Fair Value Gap kaha jata hai. Middle Candle generally strong Displacement show karti hai. Agar aap Body Boundaries aur kisi aur trader ka Wick Rule compare karen to Zones different ho sakti hain. Pehle Rule fix karein.
BEARISH FAIR VALUE GAP
Common Bearish FVG mein Candle 1 ka Low mark karein. Candle 2 strongly neeche move karti hai aur Candle 3 ka High pehli Candle ke Low se neeche rehta hai. Is tarah Candle 3 ke High se Candle 1 ke Low tak possible bearish imbalance band banti hai. Future price agar is area ko retest kare to Selling Reaction mil sakti hai, lekin guaranteed nahi. Kabhi price directly trend continue karti hai aur retest hi nahi hota. Kabhi FVG first touch par fail ho jati hai.
FVG AUR ACTUAL WEEKEND GAP DIFFERENT HAIN
Weekend Gap mein market closure ke baad next price previous close se jump kar sakti hai. Three-Candle FVG intraday chart par bhi ban sakti hai jab market continuously trade kar rahi ho. Is liye FVG ko literally aisa price area na samjhein jahan duniya mein koi transaction hui hi nahi. Ye limited Candle-Range Overlap ka chart model hai. Retail Spot Forex mein complete global Institutional Order Book visible nahi hota, is liye claims mein caution zaroori hai.
ZONE CONSISTENT TAREEQAY SE MARK KAREIN
Pehle H1 ya H4 Timeframe select karein. Teenon Candles close hone dein aur Wick-based Rule ke mutabiq exact Upper/Lower Boundaries draw karein. Zone ka Time aur Trend Direction record karein. Kya middle candle important Swing High/Low break karti hai? Kya Zone First Retest ka wait kar rahi hai? Chart move ke baad Rectangle widen karke losing setup ko valid prove karna biased Backtesting hai. Same Rules har chart par apply karna seekhein.
FVG AUR MARKET STRUCTURE KA RELATION
Agar H4 Higher High/Higher Low bullish hai aur H1 Bullish FVG banati hai to potential Trend Continuation context ho sakta hai. Lekin H4 Strong Downtrend mein M5 Bullish FVG temporary Pullback bhi ho sakti hai. H1 BOS, CHoCH aur previous major Swing Levels dekhein. Range ke middle mein ek random FVG aur meaningful Structural Break ke baad bani FVG ki quality same assume nahi karni chahiye. Timeframe Hierarchy fix karein.
MITIGATION, HALF FILL AUR FULL FILL
SMC traders price ke FVG mein wapas aane ko kabhi Mitigation kehte hain. Kuch traders Zone ki first boundary par reaction expect karte hain, kuch 50% Midpoint aur kuch far edge watch karte hain. Lekin market par koi Rule nahi ke har FVG 50% ya 100% fill lazmi karegi. Price partial Zone touch karke reverse, full Zone cross ya sideways Range bana sakti hai. First Touch Limit Entry aur M5 Confirmation Entry alag Trading Models hain.
EUR/USD BULLISH FVG NUMERICAL EXAMPLE
Maan lein Candle 1 High 1.1000 hai, Candle 2 strongly upward move karti hai aur Candle 3 Low 1.1012 hai. Wick-based Rule se FVG 1.1000–1.1012 ka potential Buying Observation Area ho sakta hai. Agar H4 Bullish hai aur H1 important BOS hua hai, to price return par M5 Confirmation watch karein. Sirf 1.1012 touch hone par market Buy guaranteed nahi. Nearest Resistance, Spread, Stop Distance aur overall Reward Space check karna hoga.
ENTRY CONFIRMATION KYUN IMPORTANT?
Aapka method H1 FVG retest ke baad M5 Bullish Engulfing Close ya CHoCH demand kar sakta hai. Bearish setup mein M5 Lower High aur Bearish Close rule ho sakta hai. Open Candle minute three par convincing lag kar minute five mein different close de sakti hai. Is liye Full Candle Close ka wait karein. Agar Confirmation Candle bohat huge ho gayi aur SL Door hai, to RR poor ho sakti hai. Late Chase karne ke bajaye No Trade bhi acceptable decision hai.
FVG VS ORDER BLOCK VS SUPPLY DEMAND
Order Block commonly strong displacement se pehle ki Last Opposite Candle ya Base ko describe karta hai. FVG middle Displacement ke dauran Three-Candle Gap Pattern ko. Supply/Demand Zone historical base-departure ki reaction area ho sakti hai. Ye concepts related hain magar exact same nahi. Agar ek H1 Zone par teeno labels milte hain to guaranteed institutional orders ya high win rate assume na karein. Har condition ka separate evidence Backtest se evaluate karein.
FAILED FVG KO ACCEPT KAREIN
Maan lein Bullish FVG par price ne chhoti rejection di lekin baad mein H1 Strong Bearish Candle poore Zone ke neeche close kar gayi. Ye possible Invalidation ka signal hai. Har lower price par Buy Lot add karna sirf is liye ke 'Institutional FVG hai' risk barha sakta hai. Zone Fail hona normal market outcome hai. Kabhi price FVG retest par long Range bhi bana sakti hai. Failure ko manipulation ka conclusive proof na samjhein.
CPI NFP AUR FVG
CPI/NFP/FOMC data ke waqt Large Displacement Candles se apparent FVGs ban sakti hain. Lekin Spread Wide, Market Liquidity Thin aur Slippage risk high ho sakta hai. News Release par bani FVG ko normal calm session ke FVG jaisa test nahi samajhna chahiye. Agar written Strategy News Avoid karti hai to woh rule follow karein. Stop Loss guaranteed exact execution price nahi deta.
EK CHART PAR DO FVG ZONES HON TO KYA KAREIN?
Maan lein Gold H1 par strong rally deti hai aur do Bullish FVGs banati hai. Pehli FVG H1 Higher Low aur purani Demand ke qareeb hai. Doosri FVG rally ke kaafi upar aur H4 Supply ke neeche hai. Dono par Three-Candle Pattern technically valid ho sakta hai, lekin Market Context same nahi. Agar aapka Plan sirf Trend-Aligned Fresh FVG with sufficient Target Space allow karta hai to lower zone better watchlist candidate ho sakti hai. Agar price wahan return hi na kare to setup nahi mila. Sirf trade lena hai is liye next random Zone select mat karein. Har Zone ki quality objectively compare karein.
FIRST TOUCH LIMIT AUR CONFIRMATION ENTRY KI COMPARISON
First-Touch trader FVG ki Boundary par Buy Limit pehle laga sakta hai. Agar price direct bounce kare to achhi Entry Price mil sakti hai, lekin strong bearish continuation mein order bina confirmation fill ho sakti hai. Confirmation trader Price ka Zone mein return aur M5 Bullish CHoCH ya completed Engulfing Close wait karta hai. Is se kuch failed touches avoid ho sakti hain, magar Entry late ya missed trade ka chance hai. Dono Methods alag systems hain. Unka Win Rate, Average R, Stop Distance, Spread aur Drawdown ek honest Backtest mein compare karein. Har winning example mein First-Touch aur losing example mein Confirmation choose karna biased testing hai.
TREND MEIN MULTIPLE FVG TRADES
Strong H4 Uptrend ke andar M5 par multiple bullish FVGs ban sakti hain. Agar aap sab par Buy open karte ja rahe hain to combined USD ya Gold Direction Exposure barh sakti hai. Teen Tickets ka matlab teen independent Strategies nahi. Total Dollar Risk cap banayein. Kuch Systems sirf First Pullback after BOS allow karti hain, jabke kuch new Swing Structure banne par next setup allow karti hain. Ye decision pehle likhein. Har new FVG ko A++ keh kar Lot double karna responsible Risk Management nahi. Market same direction mein consistently chalti nazar aaye to bhi reversal possible hai.
LIQUIDITY SWEEP + BEARISH FVG EXAMPLE
EUR/USD Previous Day High ke upar Wick de kar Range mein wapas aati hai. Phir M5 par strong Bearish Displacement aur FVG form hoti hai. Price baad mein Imbalance ka Retest karti hai. Trader H1 Resistance, High Sweep Reclaim, M5 Lower High aur completed Bearish Engulfing Close ka combination study kar sakta hai. SL relevant Sweep High ke beyond, Target Range Midpoint ya H1 Support ke context mein. Lekin nayi USD News market ko phir upar break kar sakti hai. Is liye ye Conditional Trade Plan hai, guaranteed Institutional Sell nahi.
FVG BACKTEST MEIN KYA RECORD KAREIN?
Har FVG ka Date, H1/M5 Timeframe, Boundaries, Displacement Size, BOS, H4 Trend, First/Second Retest, Candle Confirmation, Stop Loss, TP, Spread aur Trade Expiry likhein. Jo Zones bina retest ke chali gayin, unhein bhi Missed/Not Triggered category mein record karein. Same Rules ke saath plain H1 Support/Demand setup ki performance compare karein. Agar FVG extra label Net Results improve hi nahi karta to complex Strategy rakhna zaroori nahi. Past sample profitable ho tab bhi Future Market mein guarantee nahi.
PIPSEPAISA FREE COURSES
Practical Technical Analysis, Price Action aur FVG concepts seekhne ke liye Sir Sajid Khan Ghori ka Free Forex Technical Analysis Course explore karein. Gold aur Forex ki fundamental movements ke liye Sir Ghulam Abbas ka Free Forex Fundamental Analysis Course bhi available hai. www.pipsepaisa.com ke Courses Tab se enrollment instructions follow karein. Education Trading Profit guarantee nahi karti.
CONCLUSION AUR DISCLAIMER
FVG ek Chart-Based Potential Reaction Zone hai. Isay mark karne ke liye clear Candle Rule, H4/H1 Trend, M5 Completed Close, Structural SL aur Risk Budget chahiye. Process: Trend → FVG Zone → Price Return → Confirmation → Position Size → Entry Consideration. Har FVG Buy/Sell Signal nahi. No Confirmation = No Trade. Ye sirf educational information hai, personal investment advice nahi. Forex aur Gold Leveraged Trading mein capital loss ka risk hai.
Educational content only. Trading involves risk. Always use independent analysis and appropriate risk management.